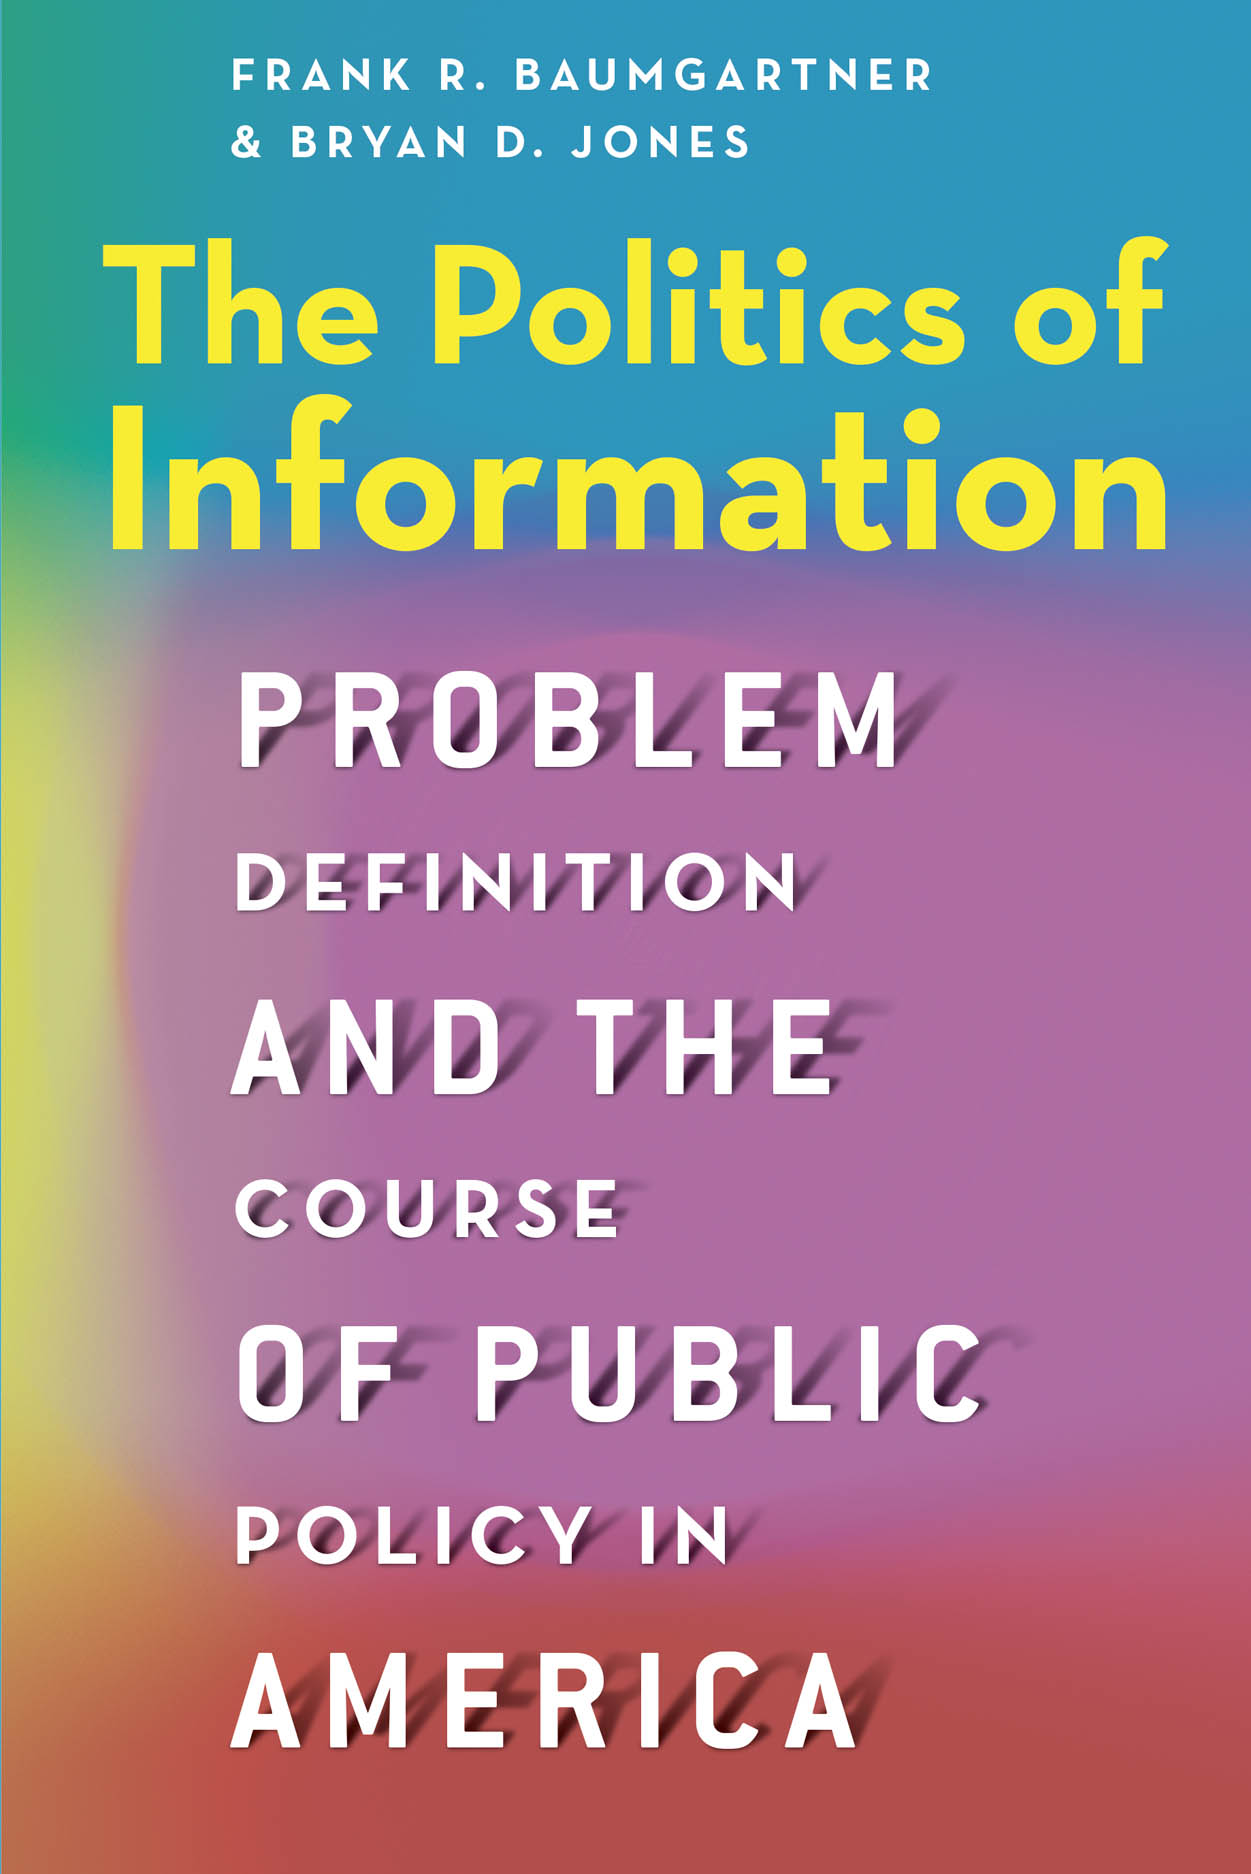
The Politics of Information
Problem Definition and the Course of Public Policy in America
Frank R. Baumgartner and Bryan D. Jones
University of Chicago Press, 2015
Winner of the Louis Brownlow Book Award from the National Academy of Public Administration for the best book in public administration, 2016. (Citation)
Winner of the 2017 International Public Policy Association award, recognizing the best book published in the English language in 2015 on any topic of public policy.

With The Politics of Attention, leading policy scholars Frank R. Baumgartner and Bryan D. Jones demonstrated the central role attention plays in how governments prioritize problems. Now, with The Politics of Information, they turn the focus to the problem-detection process itself, showing how the growth or contraction of government is closely related to how it searches for information and how, as an organization, it analyzes its findings. Better search processes that incorporate more diverse viewpoints lead to more intensive policymaking activity. Similarly, limiting search processes leads to declines in policy making. At the same time, the authors find little evidence that the factors usually thought to be responsible for government expansion—partisan control, changes in presidential leadership, and shifts in public opinion—can be systematically related to the patterns they observe.
Drawing on data tracing the course of American public policy since World War II, Baumgartner and Jones once again deepen our understanding of the dynamics of American policy making.
“Baumgartner and Jones provide insights regarding the reshaping of American governance that are truly invaluable to our understanding of the political process. There is no doubt this book will be widely cited for both its theoretical innovations and its empirical insights.” ~ E. Scott Adler, University of Colorado, Boulder
“Baumgartner and Jones have done it again! The Politics of Information is yet another pathbreaking study from the authors. This time focus is on the development of American government, but both the theoretical approach and the empirical analysis deserves attention well beyond. Scholars of public policy and comparative politics also have a lot to learn from the book.” ~ Christoffer Green-Pedersen, Aarhus University, Denmark
"The Politics of Information illuminates the vast landscape of the national policymaking process. The analysis of the broadening and thickening dimensions of government growth is especially noteworthy." ~ Morris P. Fiorina, Stanford University
Reviews:
- Political Studies Review 15, 1 (2017): 157-158, by Tevfik Murat Yildirim
- European Political Science 2016, by Tevfik Murat Yildirim (Joint review of Politics of Information and Agenda Dynamics in Spain)
- Governance 29, 4 (October 2016): 581-83), by Jacob S. Hacker
- Review Symposium in Perspectives on Politics 14, 2 (June 2016): 498-506, with commentaries by Kuhika Gupta, Kathleen Knight, Eric Patashnik, and Scott E. Robinson
- Congress & the Presidency, 2016, by Gisela Sin
- Public Administration 94, 4 (2016): 1155–57, by Peter Mortensen
- Cognitive Systems Research 40 (2016) 114-115, by George Kampis
- Symposium in Interest Groups and Advocacy 4, 3 (September 2015): 297-310), with reviews by Edward T. Walker, Matt Grossman, and Anne S. Binderkrantz
- Low-Information Lawmakers: Why today’s Congress can no longer cope with complex problems. Washington Monthly by Lee Drutman, June/July/August 2015
- Analyses of Social Issues and Public Policy 15, 1 (2015): 447–449, by Phyllis Wentworth
- Choice 55, 12 (August 2015), by L. T. Grover, Southern University and A&M College
Blog mentions and media discussions:
- Is Congress working as it should? Depends on who you are, Vox.com, by Frank R. Baumgartner and Lee Drutman, 15 September 2016.
- Why Congress Relies on Lobbyists Instead of Thinking for Itself, TheAtlantic.com,by Lee Drutman and Steven Teles, March 10, 2015
- Neither voters, nor interest groups? TheNoWaterEconomists.com, by Scott Beaulier, February 17, 2015
- Listen to a podcast about the book, with Heath Brown, as part of his web site: New Books in Political Science: Interviews with Political Scientists about Their New Books. The podcast lasts about 20 minutes, and the interview with Frank Baumgartner dates from January 2015.
Practical information:
Purchase the book from the University of Chicago Press or Amazon.
Link to the Policy Agendas Project, which houses the data on which our analysis is based.
Link to the Comparative Agendas Project, providing similar data for many countries.
Citation format for users of policy agendas data
Click here for a spreadsheet containing the data from all the figures in our book. The name of each sheet in the file (e.g., Fig1-1 or Fig1-2) indicates the figure to which the data are associated. See the book for a complete list of figures and explanation of the measures. The attached spreadsheet allows a reader to replicate exactly any of the analyses presented in the figures.
Click here for the R code written by former UNC-CH PhD student Will Winecoff (now assistant professor at Indiana University) to create all the numeric figures in the book. These commands can be used in conjuction with the data in the spreadsheet above to re-create all the figures, and can be used as a template for other graphing projects in R. Thanks to Will for a very professional job in putting this together.
updated: July 4, 2019