-
House of Representatives
Prescription Drug Task Force


-
-
-
| PRIME Institute |
-
- Pharmaceutical Research In
- Management & Economics
|
-
Patent Extension of Pipeline
Drugs:
-
Impact on U.S. Health Care
Expenditures
-
-
PRIME Institute, College of Pharmacy
-
University of Minnesota
-
Minneapolis, Minnesota 55455
-
-
July 28, 1999
-
Stephen W. Schondelmeyer, Pharm.D., Ph.D.
-
Professor and Director
-
PRIME Institute, College of Pharmacy
-
University of Minnesota
-
Minneapolis, Minnesota 55455
* This study was funded in part by a research grant from the
National Association of Pharmaceutical Manufacturers.
-
TABLE OF CONTENTS
-
-
-
LIST OF TABLES AND FIGURES
- LIST OF TABLES
LIST OF FIGURES
-
-
Executive
Summary
- Background
- * HR 1598 will affect 7 drug firms and 8 drugs worth $2.7 billion; that is
3.3% of U.S. Rx sales in 1998.
- * Congress addressed additional exclusivity for the 'pipeline drugs' when
it passed the Hatch-Waxman Act.
- * Pipeline drugs have already benefitted from 2 to 5 years of additional
protection from generic competition.
- * Drugs covered by this legislation currently have effective patent lives
ranging from 6.8 to 13.8 years.
- Drug Products Affected
- * Claritin had sales of $1.9 billion in 1998, Relafen had $450 million,
and Daypro had $300 million.
- * There are 45 million allergy sufferers and 40 million arthritis
sufferers who may be affected by this bill.
- * U.S. sales of Claritin ($1.9 billion) in 1998 accounted for 84% of
Claritin worldwide revenue ($2.3 billion). * Claritin sales provide 34% of
Schering-Plough's total worldwide revenue of $7.3 billion in 1998.
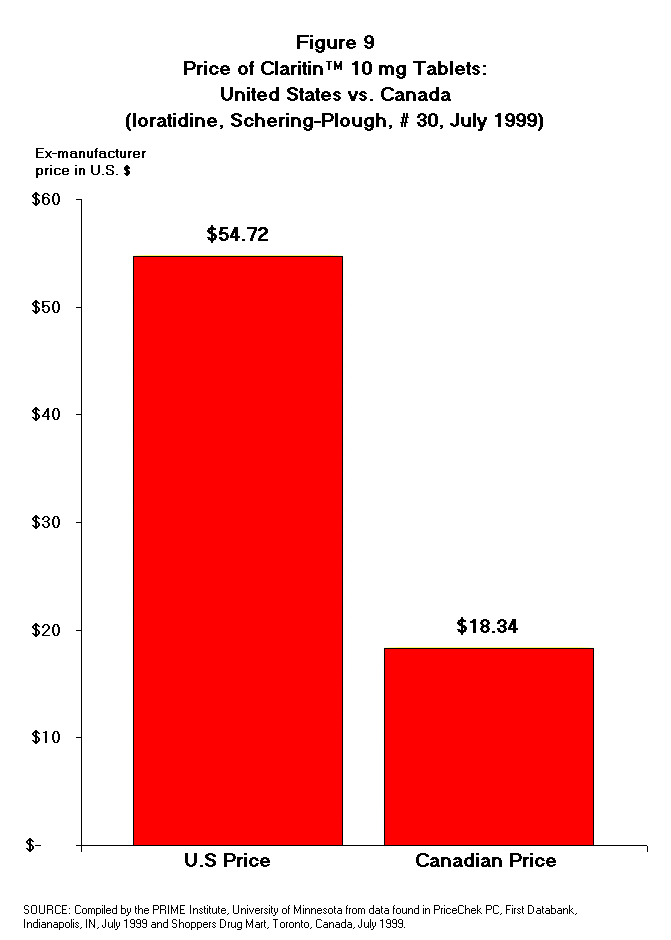
- * The Canadian price of Claritin is one-third of the U.S. price for the
identical drug from Schering-Plough.
- * Claritin 10 mg (#30) in the U.S. costs $54.72, while the same drug costs
$18.34 in Canada (mfg price).
-
- Cost to Consumers from Three-Year Delay in Generic
Competition
- * A case study of Claritin was done to estimate the economic impact of a
3-year delay in generic competition.
- * Claritin sales are expected to reach $3.46 billion by 2002 and $3.78
billion (NPV, 2000$) by 2005.
- * Generic competition for Claritin is expected to begin in July 2002; with
a delay, it is expected in July 2005.
- * Consumer savings from generic competition for Claritin is estimated at
$0.70 billion (NPV 2000 $) in 2003; $1.15 billion in 2004; $1.55 billion in
2005; $1.82 billion in 2006; and $2.01 billion in 2007.
- * Consumers can expect to save $7.33 billion (NPV, 2000 $) from generic
versions of Claritin in the first 5 years.
- * A 3-year delay in competition for Claritin will cost consumers $5.31
billion (NPV, 2000 $) from 2002 to 2007; and $7.36 billion (NPV, 2000 $) from
2002 to 2012.
- * The total cost to consumers from an exclusivity extension for the 8
'pipeline drugs' will be about $11.1 billion.
- Effect on Schering-Plough
- * Two Schering-Plough products (Claritin and Eulexin) represent 68% of the
market value of affected product.
- * Schering-Plough's marketing, advertising & admin. expenses are above
industry average (39% vs. 25%-30%).
- * Schering-Plough's R&D expenditures are considerably below the
industry average (12.5% vs. 20.0%).
- * This legislation will add $9.64 billion to Schering-Plough revenue from
2002 to 2012.
- * More than 60% (~$5.83 billion) of Schering-Plough's added revenue will
go to marketing, sales, and profits.
- * Less than 30% of R&D expenditures is typically allocated to
discovery of new medicines.
- * Less than 3.6% of the added costs to the American public is expected to
go toward discovery of new drugs.
- Effect on Pharmaceutical Firms
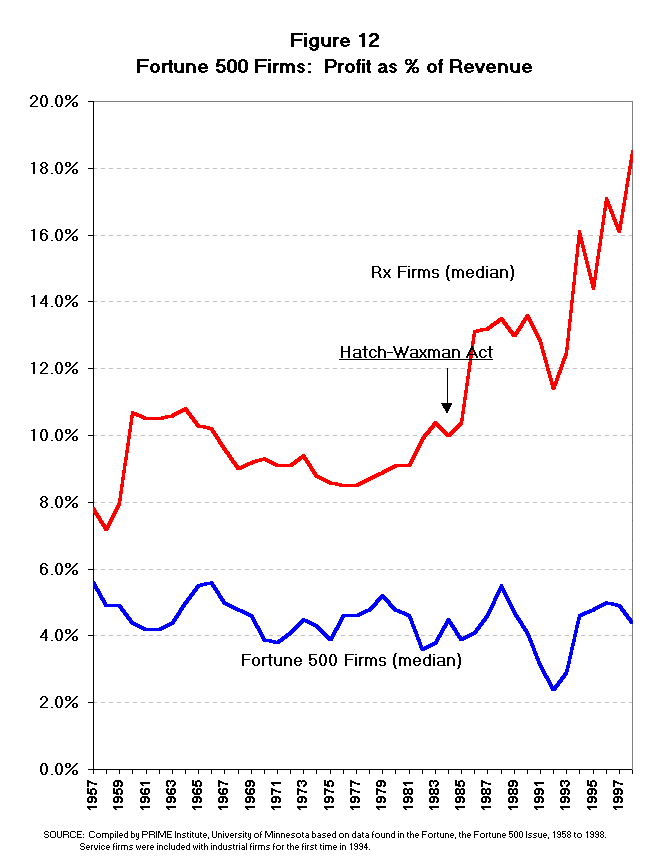
- * Pharmaceutical firms had higher net profit as a % of revenue than any
U.S. industry group for 20 years.
- * The profitability gap between pharmaceutical firms and the median
Fortune 500 firm (America's best
- corporations) has grown wider since passage of Hatch-Waxman.
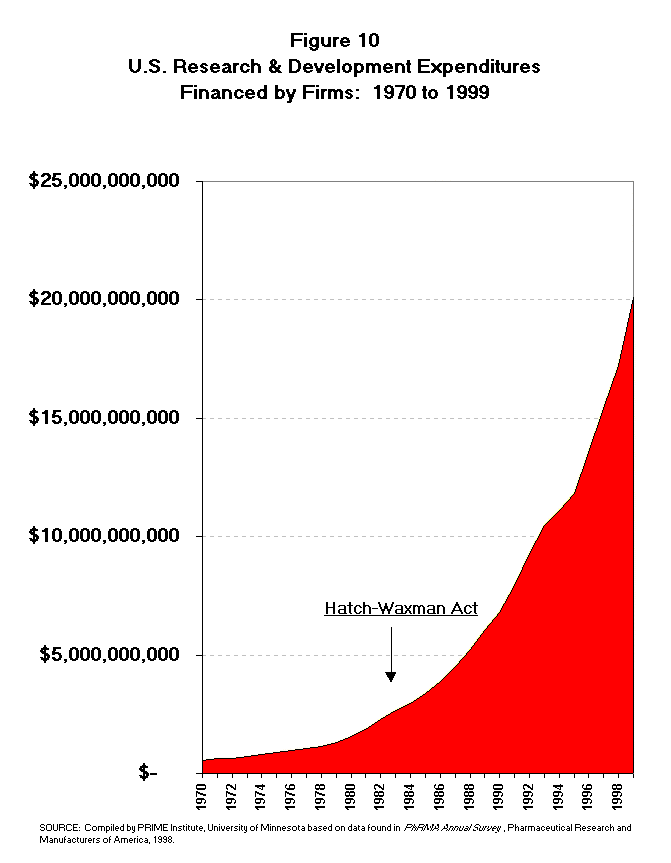
- * Both R&D expenditures and drug firm profits have shown dramatic
growth since the Hatch-Waxman Act.
- * The rate of return to pharmaceutical firms is higher than other
industries in the U.S., even when risk-adjusted.
- * CBO says lengthening patent periods is not the most effective means of
encouraging R&D.
- * Reduction of FDA review times is a more effective means of stimulating
research and development.
- * The FDA's NDA review time has been reduced substantially from > 30
months (1984) to 11.7 months in 1998.
- Economic Impact on Consumers and Government
- * The cost to American consumers from this proposed legislation exceeds
$11 billion (NPV, 2000 $).
- * Medicaid will bear about $1.34 billion of the cost, and other government
programs will bear $0.55-$1.34 billion.
- * Govt. programs will bear a cost of about $2.5 billion, and with a
Medicare drug benefit about $5.0 billion.
- * This legislation will have very real costs in terms of
increased pharmaceutical expenditures for Americans.
-
Patent Extension of Pipeline
Drugs:
-
Impact on Health Care Expenditures
- I. INTRODUCTION
-
- Legislation has been proposed to extend the patents of a special set of
drug entities defined under the Hatch-Waxman Act as 'pipeline drugs.' The
Hatch-Waxman legislation specifically mentioned the set of drugs which had
submitted a new drug application (NDA) to the Food and Drug Administration
(FDA) prior to passage of the Hatch-Waxman Act, but which had not yet received
approval to market from the FDA. When Congress defined this set of drugs, it
explicitly indicated that these drugs would have their patent monopoly
extended by two years. Proposed legislation (HR 1598) has been offered which
would provide an additional patent extension of up to 3-years for these
pipeline drugs which have already had patent extensions under the Hatch-Waxman
legislation.
- The implementation of this proposed legislation (HR 1598) is delegated to
the U.S. Patent and Trademark Office (PTO), despite the fact that PTO does not
have expertise in either FDA approval procedures or assessment of the economic
impact of its actions on public health programs (e.g., Medicare and Medicaid)
or consumers. In addition to the patent extension proposed in this act, these
drug products have already benefitted from other legislation extending their
patent monopoly or market exclusivity periods including: (1) Hatch-Waxman Act
adding 2 years; (2) GATT extensions up to 3 years; (3) pediatric study
extensions up to 6 months; and (4) other special-interest legislation
extending the exclusivity of drug products (e.g., Daypro).
- Pipeline drugs have already received the benefit of 2 to 5 years of patent
monopoly extension from the Hatch-Waxman Act and other legislation. Further
lengthening the period of patent protected monopoly for pipeline drugs will
create a barrier to the presence of a free market with competition. If
legislation is passed to award additional years of patent monopoly to the
pipeline drugs, American consumers would experience a delay in the opportunity
for savings which result from generic competition in the pharmaceutical
market. The delay of generic competition will result in awarding a 'windfall
profit' to the pharmaceutical firms whose products are affected by the
proposed patent extensions. In other words, pharmaceutical firms stand to
benefit from extended patent monopolies, while consumers and payers in health
care will experience an increase in expenditures due to lack of competition.
Much of this added cost for prescription drugs will be paid by individual
consumers such as senior citizens, low income families with no health
insurance, and others who do not have prescription drug coverage. Insurers,
managed care plans, self-insured employers and corporate sponsors of health
benefit plans will also bear some of the cost of this legislation.
-
- The consequences in the pharmaceutical market from additional patent
extension for pipeline drugs will include the following: (1) the
pharmaceutical firms marketing these drug entities will benefit from a
'windfall extension' in market exclusivity time; (2) the pharmaceutical firms
(i.e., generic firms) preparing generic versions of currently patented drug
products will face delays in approval and may have added costs due to the
delay in market entry; and (3) the consumer will have delayed access to
lower-cost, generically equivalent pharmaceutical products. While each of
these effects deserves substantial analysis, the focus of this study is on the
added costs to consumers from a three-year delay in generic approval and
market entry.
- II. PIPELINE DRUGS AFFECTED BY HR 1598
- Eight drug entities will benefit from additional patent monopoly granted
by the proposed legislation (HR 1598). Various characteristics of these drug
entities are described in Table 1. Collectively these eight drugs accounted
for more than $2.72 billion in U.S. sales at the manufacturer level in 1998
(Table 2). The $2.72 billion represented by these special-interest drugs is
3.3% of the total U.S. pharmaceutical sales in 1998.
- Claritin, the best-selling of these drugs, had $1.9 billion in 1998 sales
and accounted for two-thirds of the total value of the eight pipeline drugs
included in this legislation. Claritin is indicated for seasonal allergy
symptoms. In the United States there are approximately 45 million seasonal
allergy sufferers.1 This drug could potentially be used by one in
six Americans. Claritin's U.S. sales of $1.9 billion in 1998 accounted for 84%
of the $2.3 billion reported as worldwide sales for Claritin. Worldwide
pharmaceutical revenue for Schering-Plough Corp. was reported to be $7.3
billion in 1998.2 In other words, Claritin provides 34% of
Schering-Plough's total revenue worldwide.
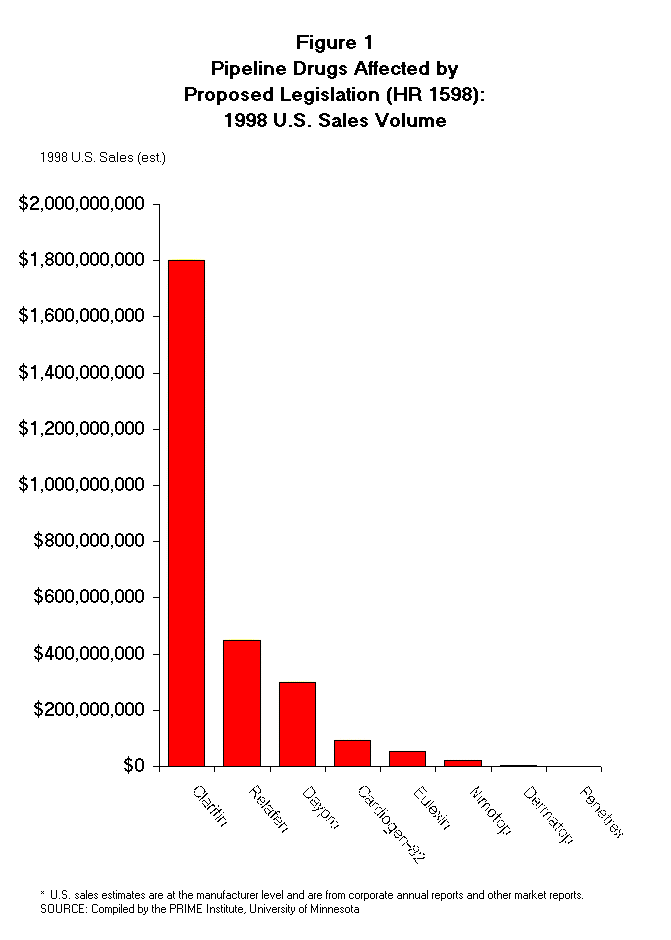
- Relafen and Daypro are also major drugs with 1998 sales of $450 million
and $300 million, respectively (Figure 1). Both Relafen and Daypro are
non-steroidal anti-inflammatory drugs (NSAID) used for treatment of
arthritis.3 An estimated 40 million Americans have some form of
arthritis. Relafen has been the number one NSAID (by sales volume) for more
than five years and had U.S. sales of about $450 million in 1998. U.S. Relafen
sales account for about 88% of worldwide Relafen sales. Relafen provided
nearly 12% of Smith-Kline Beecham's total pharmaceutical revenue in the U.S.
in 1998. Daypro became the second-leading NSAID in the U.S. during 1997 and in
1998 produced revenue of about $300 million.
- The other five pipeline drugs are Cardiogen-82 (Bracco Diagnostics),
Eulexin (Schering-Plough), Nimotop (Bayer), Dermatop (Hoechst Marion Roussel),
and Penetrex (Rhone-Poulenc Rorer). Collectively, these drugs are estimated to
have had 1998 U.S. sales of about $170 million (Table 2). In summary, three
pipeline drugs account for 93%, while the other five pipeline drugs account
for less than 7% of the collective 1998 U.S. sales volume for pipeline
drugs.
- III. PATENT MONOPOLY PERIODS FOR PIPELINE
DRUGS
- A single pharmaceutical product today may have two, three, or more patents
each with different implications for the manufacturer of competing products.
Patents may be issued for: (1) the chemical composition of the drug entity or
intermediate chemical entities; (2) one or more processes by which the drug
can be made; (3) the formulation of the drug product or the dosage form in
which the drug is delivered (e.g., a sustained release tablet); or (4) a
specific medical indication or use of the product. When the drug product,
Tagamet, went off patent (May 1994) with respect to the principal drug entity,
the patent holder (Smith-Kline Beecham) made it known to potential generic
manufacturers that it holds at least 26 other patents related to Tagamet and
that it intended to vigorously enforce them.4 A compilation of drug
products and certain related patents can be found in the Food and Drug
Administration's publication titled, Approved Drug Products with
Therapeutic Equivalence Evaluations published by the U.S. Food & Drug
Administration (also known as The FDA Orange Book). Process patents are not
eligible for listing in the FDA Orange Book.
- Although the language of the proposed legislation refers to 'patent term
restoration', the additional monopoly period proposed is beyond the existing
patent term. Furthermore, each of the affected pipeline drugs in this proposed
legislation has already had its patent term extended by other legislation.
Each of these drugs was granted a 2-year patent extension by the Hatch-Waxman
Act. Three of the drugs (Claritin, Daypro, and Dermatop) have also received a
previously unexpected patent extension from the GATT legislation which changed
the basis for calculating the patent period from 17 years after patent issue
to 20 years after patent filing. Three drugs (Claritin, Daypro, and Relafen)
have also submitted written requests to FDA for a 6-month exclusivity
extension based on the conduct of pediatric studies on the drug. One drug
(Daypro) has benefitted from additional special-interest legislation to
further extend its non-patent market exclusivity period.
- The pipeline drugs covered by this legislation currently have effective
patent lives ranging from 6.8 to 13.8 years and some have an additional 6
months exclusivity for conducting pediatric studies. These periods of market
monopoly are typical of the monopoly periods for other prescription drug
products and do not suggest that these pipeline drugs have been
disproportionately disadvantaged in a manner that warrants further extension
of their patent monopoly period. Since each of these drugs has already
benefitted from extensions of market exclusivity ranging from 2 to 5 years,
there appears to be no reason to legislate an additional 3 years of market
exclusivity for pipeline drug products. Claritin, for example, has already
received about 5 extra years of patent monopoly and market exclusivity
extension.
- There does not appear to be any 'equity' basis for the proposed
legislation (HR 1598) which requests up to 3 years of additional patent
monopoly beyond the 2 to 5 years of added monopoly already received by these
pipeline drugs. To further extend the patent monopoly of these pipeline drugs
would put other drug products on the market at a disadvantage. If this
legislation is passed, then the other drug companies may request legislation
to extend patents on their drug products to be 'fair and equitable' compared
to the deal the Hatch-Waxman pipeline drugs received.
- IV. METHOD FOR ECONOMIC IMPACT ANALYSIS
- The purpose of this section is to explicitly describe the methods and
assumptions used to estimate the economic impact of additional patent
extensions for pipeline drugs proposed by certain pharmaceutical firms.
Several aspects of the methodology deserve description and comment including:
(1) identification of the drugs affected by the proposed legislation; (2) the
method for calculating added years of market monopoly; (3) the time frame of
the analysis; (4) the market value and the net present value used to express
the cost to American consumers; and (5) the expected level of generic market
penetration and generic pricing.
- A. Pipeline Drugs Proposed for Additional Patent
Extension. This analysis is a case study of Claritin, which represents
two-thirds of the economic value of the pipeline drugs covered by this
proposed patent extension legislation. Since Claritin is such a dominant drug
in terms of U.S. sales in relation to the other pipeline drugs, it is assumed
that Claritin will be responsible for the vast majority of the economic impact
of this proposed patent extension legislation. Claritin represented two-thirds
of the U.S. sales for pipeline drugs in 1998, while the remaining seven
pipeline drugs, collectively, generated only one-third of the U.S. sales for
the affected drugs. Certainly a 3-year patent extension for Relafen, Daypro,
and the other five pipeline drugs will also have an economic impact on
American consumers.
- B. Added Years of Market Monopoly. The
legislation proposed by HR 1598 would extend the patent monopoly of
Hatch-Waxman pipeline drugs for a period of up to 3 years. Claritin is
expected to receive 3 years of additional patent monopoly if this legislation
is passed.
- C. Time Frame of the Analysis. If implemented,
the economic impact of the added patent monopoly from this proposed
special-interest legislation will be felt by American consumers well into the
first decade of the 21st century. The present patent exclusivity period of
pipeline drugs extends out as far as 2002. The effect of implementing a 3-year
extension of the patent for these pipeline drugs will move the patent
expiration date to some time in 2005. The full effect of this legislation
requires assessment of the economic impact from delay of generic competition
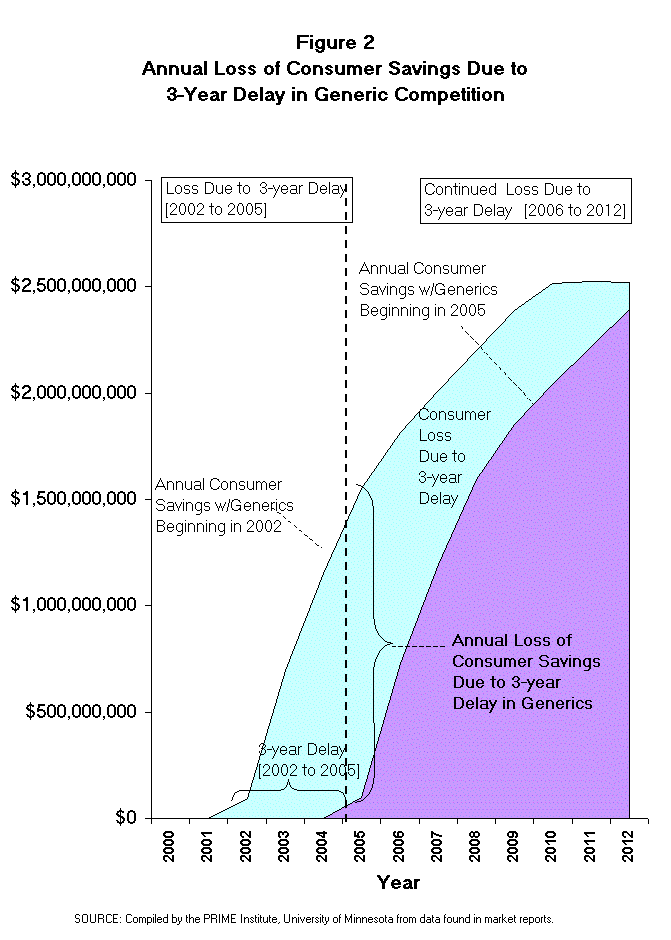
well beyond a 3-year period. The 3-year delay in generic competition means
that the savings curve is shifted to the right on the time axis.
- This means that the consumer savings from competing generic products will
be three years behind where it would have been for every year moving out into
the future (Figure 2). Note from the illustration of this effect (Figure 2)
that the majority of loss in consumer savings occurs after the first three
years of the delay in generic competition. Therefore, any fair evaluation of
the impact of this proposed legislation must examine the effect for at least 6
to 7 years beyond the extended patent period (i.e., at least to 2011 or 2012).
- Since a 3-year delay in generic competition for the affected drug products
will continue to have an economic impact 6 to 7 years beyond the 3-year patent
extension, the overall time frame of this analysis should be at least 9 to 10
years beyond the current patent expiration dates. Consequently, an economic
impact analysis that uses a time frame of less than 10 years beyond the
current patent dates would not capture the full impact of this legislation and
could grossly understate the cost of this proposed legislation to the American
government and public.
- D. Market Value and Net Present Value of Impact.
The market value of drug sales reported in this analysis is based on sales at
the manufacturer level. By reporting sales at the manufacturer level, the
impact of wholesale and retail mark-ups are not taken into account. The focus
on sales at the manufacturer level results in under-reporting of the expected
effect by about 25%. This approach, however, results in a more conservative
and lower estimate the cost of a 3-year delay in generic competition for
pipeline drugs.
- Net present value (NPV) is a means of reporting economic data over a long
period of time so that dollar values are represented in comparable terms. Over
time the spending power of the dollar declines. For example, it would take
about $1.42 in 2012 to have the same spending power as $1.00 in 2000 using a
3% inflation rate over that time period. The dollar values reported in the
analysis section of this report, unless otherwise noted, have been converted
to net present value or constant dollars for the year 2000. For purposes of
this analysis, the consumer price index-all items (CPI-all) for urban
consumers was used as the deflator to determine the net present value for
amounts from all years prior to 1998. An inflation rate of 2% was assumed for
1999 and 2000, and 2.5% for the year 2001. The inflation rate for 2002 through
2012 was assumed to be 3%.
- E. Generic Market Penetration and Generic
Pricing. Generic competition cannot begin until after each patent listed in
the FDA Orange Book (including patents on the drug's active ingredient,
formulation, dosage form, or indications for use) has expired, unless the
patent is challenged by a generic applicant as invalid or not infringed. In
many cases, generic applicants have not challenged basic patents regarding the
drug's active ingredient or the indications for use, but they have challenged
other FDA Orange Book patents (particularly formulation and composition
patents) as invalid or not infringed. Therefore, it will be assumed that
generic competition begins after the initial (or 'blocking') patent
expiration.
- This is a conservative assumption which does not take into account other
barriers which may impede generic competition, such as tactics used by the
original marketer to delay the FDA in establishing a bioequivalence standard,
the 6-month exclusivity period awarded to the first approved generic,
contractual agreements between the initial patent holder and the first
approved generic to delay marketing of that first generic and thereby blocking
entry of other generic products, difficulty in obtaining a source of raw
material, administrative delays in approval by the FDA, or other factors. This
assumption would tend to underestimate the cost to American consumers if
generic competition is delayed for several months to several years beyond the
expiration of the 'blocking' patent.
- Two primary factors determine the savings which American consumers can
realize from access to generic competition among drug products. First, the
penetration of generic drug products into the original marketer's unit volume
must be estimated. The generic penetration can be assessed by examining the
proportion of units (tablets or capsules) of a given drug product which are
filled with generic versions of the drug product. The second factor is the
price of generic drug products in relation to the original marketer's price
over time. This determines the amount of savings realized for each unit of the
original brand which is filled with a lower-cost generic.
- Empirical evidence related to these two critical factors, market
penetration and pricing of generic products, was examined. An October 1994
market analysis of the generic drug market evaluated the generic pricing and
unit penetration of twenty-five major drug products that had gone off patent
in the previous few years.5 The analysis used data from IMS
America, one of the leading sources of pharmaceutical market information used
extensively by the pharmaceutical industry, to determine the dollar and unit
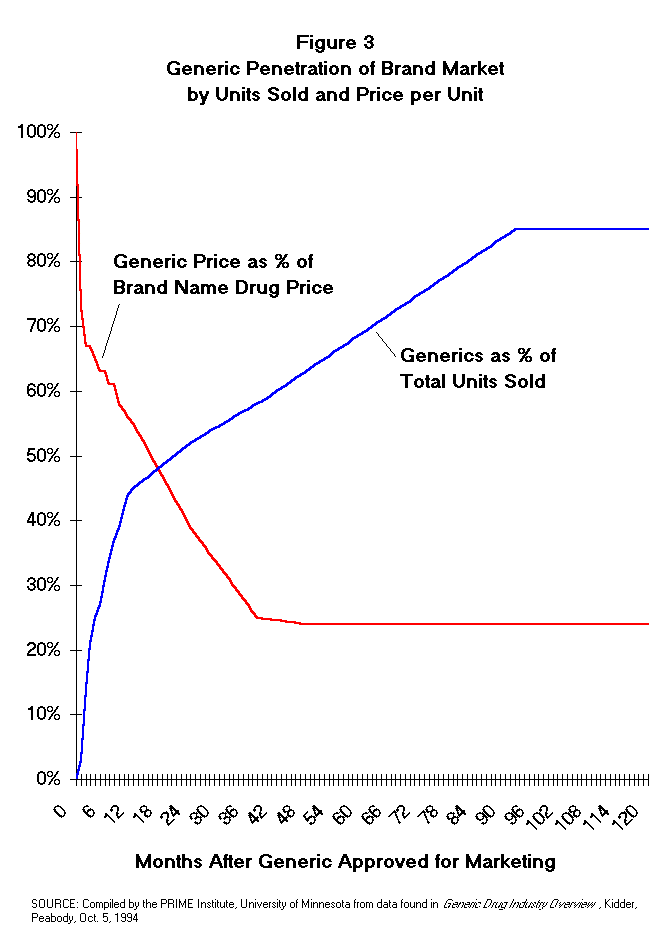
sales volume for these products from 1989 to 1994. The effect of both generic
unit penetration and competitive generic pricing is shown in Figure 3.
- Off-patent drug products were found to have lost 3% of the units in the
first month, 14% in the second month, and 21% by the third month after generic
competition entered the market. After one year generics, averaged 45% of the
unit volume and at two years generic penetration had grown to 52%. The effect
of generic competition on prices was measured by examining the average price
of generics in comparison to the originator product price over time. Generics
entered the market at a price averaging 73% of the originator price. By the
second month after generic competition, the price was typically at 67% of the
originators price and at 12 months it was at 55%. After two years, the average
generic was priced at only 39% of the originator's price.
- Evidence from the market in the past few years suggests that generic
penetration may occur even faster today than it did in 1994. While this is
quite likely, use of the 1994 penetration rates would be more conservative in
that it would understate the cost to consumers from delay of generic entry
into the market.
- V. ECONOMIC IMPACT OF PATENT EXTENSION FOR
PIPELINE DRUGS
- The relevant parties who stand to be significantly impacted by this
proposed extension of patent monopolies include: (1) individual Americans who
purchase their own prescription medications (about 25% to 30% of the
population); (2) corporate employers who purchase managed care and insured
health benefit programs that pay for prescription medicines (about 55% to 60%
of the market); (3) government health programs that pay for outpatient or
inpatient prescription drugs including Medicaid, Medicare, the Veterans
Administration, Indian Health Service, and others; (4) multinational brand
name pharmaceutical manufacturers with pipeline drugs; and (5) generic
pharmaceutical manufacturers planning to compete with the brand name product
upon patent expiration. This analysis has focused on economic impact from the
perspective of those who pay for prescription medicines either individually or
collectively.
- A. Cost to American Consumers of Patent Monopoly
Extension for Pipeline Drugs.
- The combined effect of generic unit penetration and competitive pricing
can be used to estimate the savings that will result from generic competition
in the market, and to estimate the cost to American consumers from the
proposed extension of patent monopoly periods of the previously marketed
pipeline drugs. The generic unit volume penetration and pricing pattern
(Figure 3) was used to estimate the consumer savings expected from the
availability of generics in the pharmaceutical market.
- To illustrate the economic impact of a 3-year delay in generic competition
as proposed in this legislation, Claritin was used as a case study. Claritin
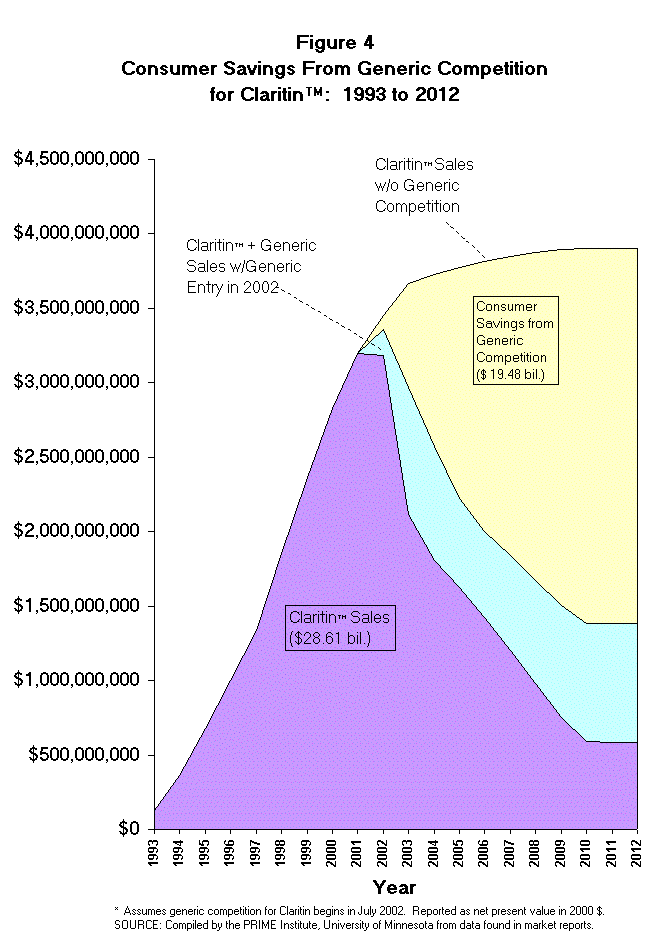
sales since introduction to the market have been quite brisk. In 1993 Claritin
recorded $107 million in U.S. sales and then showed a 192% increase to $316
million in 1994. Since then the annual sales growth has been 92% in 1995, 52%
in 1996, 37% in 1997 and 42% in 1998 (columns A and B of Tables 3 and 4 and
Figure 4). Sales have been projected forward for Claritin assuming a
conservative declining rate of growth curve. By the year 2002, Claritin should
be selling $3.46 billion (NPV, 2000 $) and by 2005 it should be up to $3.78
billion (NPV, 2000 $) (Table 4).
- The sales revenue for Claritin was projected forward to the year 2012
assuming that no generic competition enters the market. Patent 4,282,233
covers the use of Claritin for treating seasonal allergies. This patent
expires June 19, 2002, but the patent monopoly period would be extended by 3
years under the proposed legislation (HR 1598). The FDA Orange Book also lists
other patents with later expiration dates in connection with Claritin. This
study assumes that generic competition for Claritin can begin upon expiration
of the 4,282,233 patent, and that other patents listed in the FDA Orange Book
will not serve as impediments to generic competition.
- Therefore, the savings to consumers from generic competition for Claritin
will begin after July 2002. Savings in the first 6 months of generic
competition during 2002 are estimated to be $94 million (NPV, 2000 $). Then,
annual savings will be $0.70 billion in 2003 and will grow to $2.52 billion in
2010 (column F of Table 4 and Figure 4). If generic competition for Claritin
begins in 2002 as would be expected under the current Hatch-Waxman Act and
other relevant patent laws, American consumers can expect to save $7.33
billion (NPV, 2000 $) in the first 5 and years (July 2002 to 2007).
- Extension of the exclusivity period for Claritin, and the consequent delay
of generic competition, was evaluated next. Assuming a 3-year patent monopoly
extension, as proposed in HR 1598, the impact of generic competition beginning
in July 2005 was calculated (Tables 5 and 6). Initial generic competition in
the last six months of 2005 would produce consumer savings of nearly $100
million (NPV, 2000 $) and $0.73 billion annual savings would accrue in 2006.
In 2007 annual savings would be $1.19 billion and in 2008 $1.60 billion in
annual consumer savings would be realized.
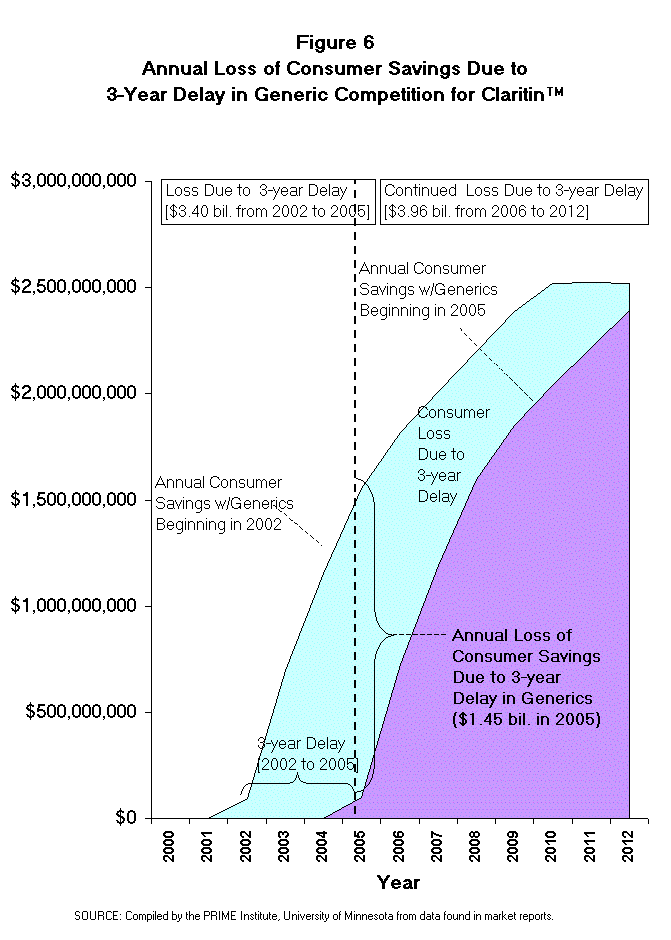
- The savings lost by American consumers from a 3-year delay in competition
for Claritin can be calculated by subtracting the savings achieved each year
with a 2005 generic launch from the savings achieved each year with a 2002
generic launch. [Note: this is column F on Table 4 minus column F on Table 6.]
The net present value (NPV, 2000 $) of consumer loss from this 3-year delay in
generic competition would be $94 million in the last six months of 2002. The
impact will grow to nearly $0.70 billion in 2003, and $1.15 billion in 2004.
During the first 5 years (July 2002 to 2007) after this delay of competition,
American consumers would pay an additional $5.31 billion (NPV, 2000 $) and in
the next five years (2008 to 2012) will add another $2.05 billion in cost to
American consumers.
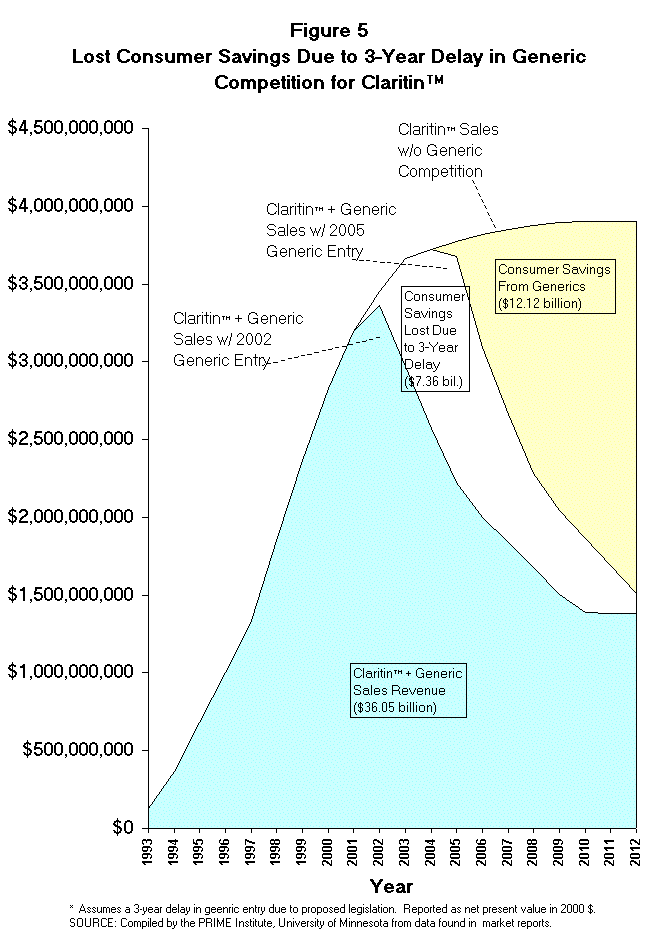
- To summarize, the cost of this proposed patent extension legislation upon
those who pay for prescription drugs is estimated to be $7.36 billion (NPV,
2000 $) between the years 2002 and 2012 (Figures 5 and 6) for Claritin alone.
Recall that Claritin represents only 66% of the market value for the pipeline
drugs covered by this proposed legislation. If one extrapolates these Claritin
findings to the other pipeline drugs covered by this proposed legislation, the
total cost to American consumers could reach more than $11.15 billion. If
wholesale and retail margins were taken into account, the total cost to the
American public would reach nearly $15 billion.
- B. Benefit to Pharmaceutical Firms from Patent
Monopoly Extension for Pipeline Drugs. The eight drugs known to be affected by
this special-interest legislative proposal are marketed by seven different
firms (Table 1). Schering-Plough Corp. has two drug products affected
(Claritin and Eulexin). Not only does Schering-Plough have the most products
affected, but these two drug products are 68% of the 1998 U.S. market value
for the pipeline drugs affected (Table 2).
- Claritin Sales Revenue. As noted earlier,
Claritin had U.S. sales in 1998 estimated to be $1.9 billion and worldwide
sales of $2.3 billion. U.S. sales of Claritin represent about 84% of Claritin
worldwide revenue.6 If Claritin is to receive $9.64 billion
additional revenue because of a 3-year patent monopoly extension, it is
reasonable to ask how is this money is likely to be used (Tables 8 and 9). One
can not always second guess the corporate decisions which will be made in the
future, but examination of the distribution of revenue for a company over time
can provide some fairly good clues about how a 3-year continuation of monopoly
revenues might be used. Annual reports and market information for
Schering-Plough were reviewed and the actual distribution of revenues across
major expense categories were identified. The expense categories were: net
profit (after taxes); research and development (R&D); marketing,
advertising, selling, and other administrative expense; cost of production (or
cost of goods sold); and taxes and other expenses. Although there were minor
variations, Schering-Plough showed a fairly consistent pattern for
distribution of revenues across these expense categories for the years 1993 to
1998 (Table 7). For purposes of this study it was assumed that a similar
distribution of revenues will continue by Schering-Plough in future years.
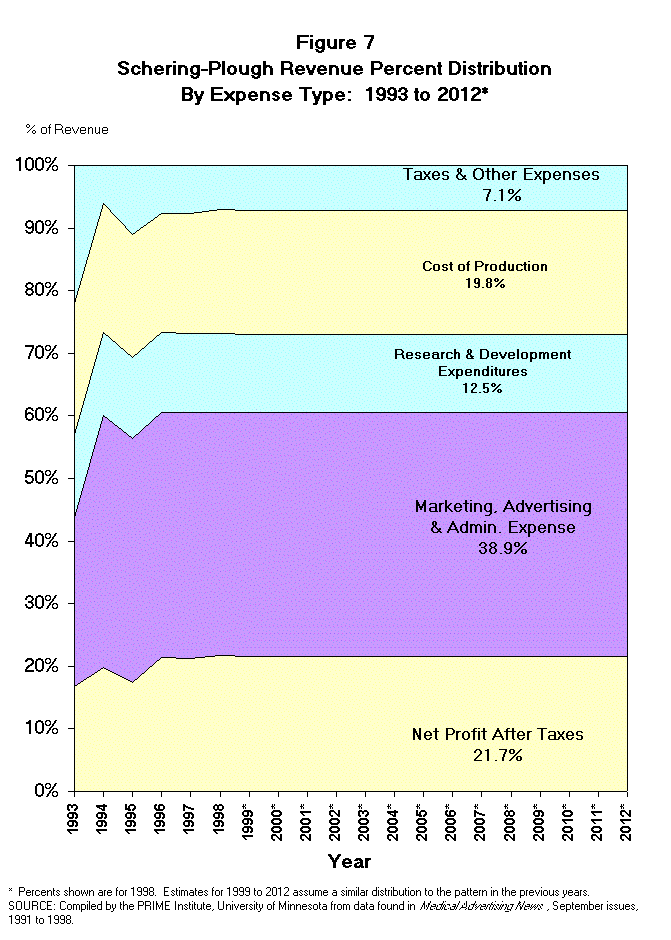
- Schering-Plough Revenue Distribution.
Schering-Plough Corp. retained 21.7% of 1998 revenues as net profit after
taxes, while expenditures on research & development accounted for 12.5% of
revenue. The cost of production was reported to be 19.8%, and taxes and other
expenses consumed 7.1% of revenue. Finally, 38.9% of revenue was spent on
marketing, advertising, selling and other administrative expense (Figure 7).
It should be noted that Schering-Plough's marketing, advertising, selling and
other administrative expenditures are somewhat above industry averages (38.9%
vs. about 25% to 30%) and the R&D expenditures are considerably below the
industry average (12.5% vs. 20.0%).7
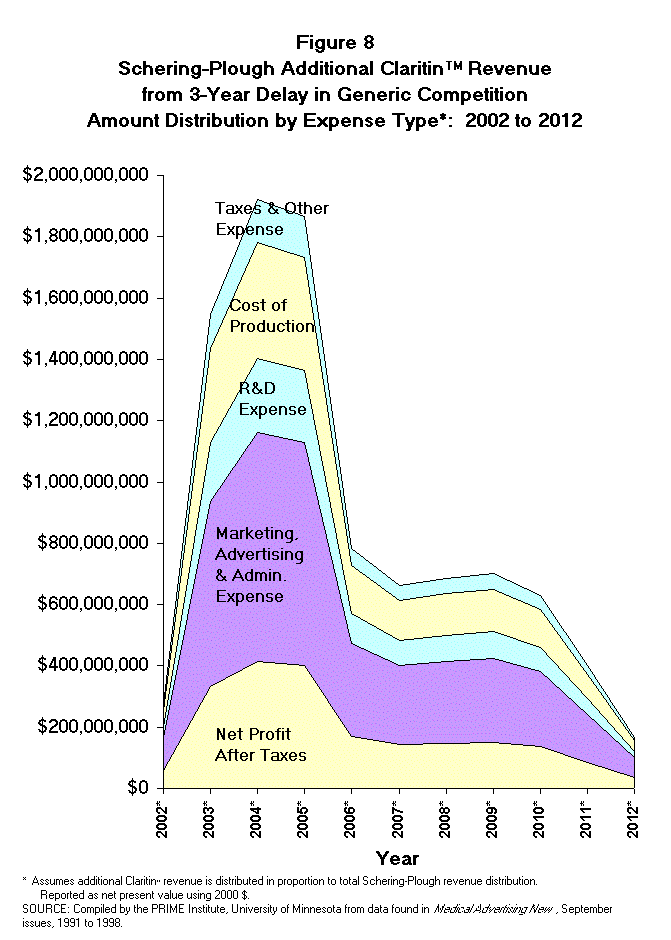
- Claritin Marketing and Advertising
Expense. If Schering-Plough continues these expenditure trends into the
future, the majority of the additional revenue (60% or about $5.83 billion)
from this proposed legislation will go toward marketing, advertising, selling,
and administrative expense or toward corporate profits (Table 9 and Figure 8).
Claritin was the most heavily promoted prescription drug by direct-to-consumer
advertising in 1998. In 1998, alone, Schering-Plough spent an estimated
$172,802,900 on direct-to-consumer advertising and $81,814,000 on professional
promotion of Claritin.8 These expenditures were an increase of
149.8% over the 1997 expenditures. Direct-to-consumer advertising may include
television, radio, magazines, and newspapers as well as direct mail to
consumers.
- Claritin Price. The U.S. wholesale
acquisition cost for a one-month supply (30 tablets) of Claritin 10 mg tablets
in July 1999 was $54.72 (US $).9 The Canadian wholesale acquisition
price of a one-month supply of the same drug entity in the same strength and
the same dosage form manufactured by Schering-Plough was $18.34 (US $) in July
1999 (Table 10 and Figure 9).10 The Canadian price is just
one-third of the price of the same drug product being sold in the United
States. Since the cost of production for this drug product is expected to be
the same for the product whether it is sold in the U.S. or in Canada, the
difference in price must be from other differences in expense such as net
profit, administrative expenses, or marketing and advertising expenses.
- Research & Development Expense.
Schering-Plough Corp. currently spends 12.5% of their revenue on R&D.
Based on industry standards, less than 30% (29.1%) of R&D expenditures is
typically allocated to research which leads to the discovery of new
medicines.11 This would mean that only about 3.6% of the additional
revenue to Schering-Plough would be used for discovery of new drugs. The
actual net present value of this estimate of the R&D expenditure would be
as follows:
- $9.64 billion added revenue X 12.5% for R&D x 29.1% for discovery
research = $350 million.
- If the intent of this legislation is to stimulate R&D, this is very
inefficient legislation because it requires a cost to the public of $9.64
billion to achieve $350 million in R&D discovery.
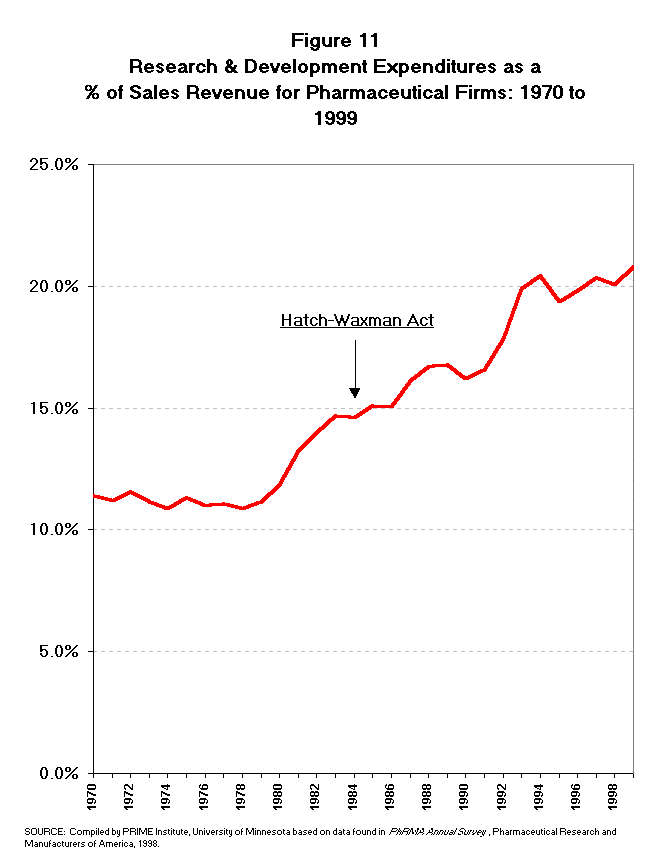
- The R&D expenditures of the pharmaceutical industry have been growing
dramatically since the time of Hatch-Waxman. A review of the R&D
expenditure trend does not show any adverse effect from the Hatch-Waxman
legislation. The U.S. R&D expenditures of pharmaceutical firms totaled
nearly $3 billion in 1984 (Table 11 and Figure 10).12 This
expenditure rate had more than doubled by 1990 to $6.8 billion. From 1990 to
1998 the R&D expenditure rate has again doubled reaching more than $17.2
billion. The growth in R&D expenditures has been at a double digit rate in
all but two years since 1984, the era of the Hatch-Waxman Act (Figure 11). The
growth rate of R&D expenditures does not appear to raise questions about
difficulty in securing private market funds for R&D investment.
- The Congressional Budget Office conducted a study of the Hatch-Waxman
Act.13 That study concluded that "reducing FDA approval times-if it
is done without sacrificing safety concerns-would be much more effective in
helping both the drug industry and consumers than would lengthening the
patent-protection period."14 In fact, the FDA has done an excellent
job of reducing the review time for new drug applications (NDAs). The average
review time for an approved NDA was more than 30 months at the time the
Hatch-Waxman Act was passed (1984). In 1998, the FDA averaged only 11.7 months
per NDA review-a two-thirds reduction in the NDA review time.15
This notable reduction of NDA review times by FDA has done far more to provide
an incentive for research and innovation than legislation such as HR 1598
would provide.
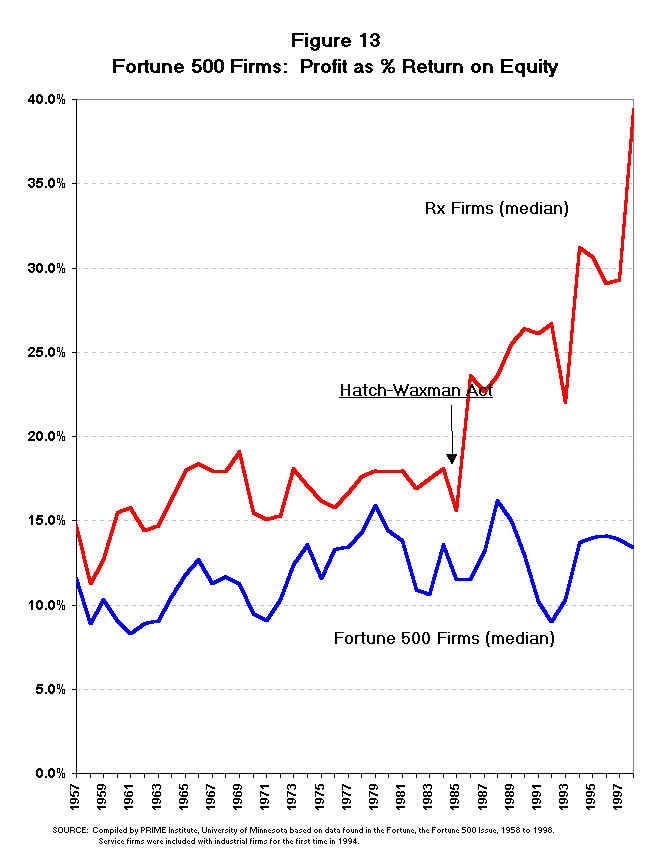
- Net Profit and Return on Investment.
Empirical evidence on rewards for innovation indicates that no other industry
in the United States is more rewarded than the pharmaceutical industry.
According to Fortune magazine, the pharmaceutical industry has the
highest level of net profit as a percent of revenue of any industry group in
the United States.16 Pharmaceutical firms have been the most profitable
industry for nearly two decades, and for two decades prior to that time
pharmaceuticals were the second most profitable industry (Table 12). Not only
have pharmaceuticals been the most profitable industry, but the gap between
pharmaceuticals and the median Fortune 500 firm (America's best corporations)
has been widening in the last one and a half decades (Figures 12 and 13). Both
the net profit as a percent of revenue and the return on equity have risen
dramatically since the mid-1980s, while the growth of other industries has
been much more modest. From the Fortune 500 measures of profitability, it
would appear that the Hatch-Waxman Act had a very positive effect on the
pharmaceutical industry.
- Because of the risk involved in discovery and development of
pharmaceutical products some analysts have argued that a comparison of profits
in the pharmaceutical industry with profits in other industries should be
adjusted for risk. A study by the Office of Technology Assessment (OTA)
included an analysis which used an internal rate of return adjustment rather
than the usual accounting rate of return. The OTA report concluded that "the
economic rate of return to the pharmaceutical industry as a whole over a
relatively long period (1976-1987) shows returns that were higher than returns
to non-pharmaceutical firms by about 2 to 3 percentage points per year after
adjustment for differences in risk among firms." The OTA report went on to say
"This is a much lower differential than is suggested by conventional
comparisons of profit ratios, but it is still high enough to have made the
industry a relatively lucrative investment." During the period (1976-1987)
studied by OTA the average difference in net profit as a percent of revenue
between pharmaceutical firms and the Fortune 500 median was 5.6%. In the years
since that study (1988-1998) the average difference in net profit between
pharmaceutical firms and the Fortune 500 median grew to 10.2%. This growth in
the profit gap between pharmaceutical and other Fortune 500 firms would
suggest that return on investment in pharmaceutical firms has been even more
lucrative in the past decade (the 1990s) than the OTA study indicated for the
previous decade (the 1980s).
- C. Cost to Consumers and Government from Patent
Monopoly Extension for Pipeline Drugs. American consumers will be impacted by
this proposed legislation, not only through the cost of medications directly
purchased, but also through the cost of such medications to government-related
health programs. The current expenditure patterns of Medicaid, and other
government programs such as the Veterans Administration and the Department of
Defense, indicate that the government pays directly for about 16% to 18% of
outpatient prescription drugs in the United States. If one included federal
and state employee health benefit plans, as well as active and retired
military personnel with dependents, the government share of outpatient drug
expenditures in the U.S. approaches 25% or more. Also, there is debate about
coverage of outpatient prescription drugs for the elderly under Medicare. The
elderly consume 34% of the outpatient prescriptions even though they represent
only about 12% of the population.
- The added cost of prescription medications from this proposed patent
extension legislation would be borne proportionately by individuals and
institutional payers for health care services including federal and state
governments. The government has a substantial role in paying for outpatient
prescription drugs at present (estimated to be 20% to 25%), and the future
potential for a significant expansion in responsibility for purchase of
prescription drugs with Medicare coverage of outpatient prescriptions (another
20% to 25%). If the Medicare expansion occurs, this would place the
government's total share of U.S. outpatient prescriptions as high as 45% to
50% of all expenditures.
- The economic impact of this proposed legislation was estimated to be more
than $11.15 billion (NPV, 2000 $). Approximately $1.34 billion, or 12% of this
amount, would be borne by Medicaid (both federal and state shares). Other
current government programs would bear another $0.55 billion to $1.34 billion
(5% to 12% of the total impact). Coverage of outpatient prescriptions by
Medicare could result in government being liable for an additional 20% to 25%
of the cost of this legislation ($2.23 billion to $2.79 billion). In total,
the government share of the cost of this proposed patent extension legislation
will range from $1.89 billion to as high as $5.0 billion, if Medicare drug
coverage is adopted.
VI. SUMMARY AND CONCLUSIONS
The proposed legislation sets up a patent extension process for a special set
of products known as 'Hatch-Waxman pipeline' drugs. At least eight drugs will
receive patent extensions from this proposed legislation, purportedly due to
inequities resulting from the Hatch-Waxman legislation. The effective patent
life of these eight drugs appears, however, to be consistent with the effective
patent life of other drugs approved at the time of the Hatch-Waxman Act. These
eight drugs would have market exclusivity ranging from 7 to as much as 14 years.
Both R&D expenditures and pharmaceutical company profits have shown
dramatic growth since the passage of the Hatch-Waxman Act. Consequently, it is
hard to accept the argument that research-intensive pharmaceutical firms have
been significantly disadvantaged by this Act. R&D expenditures over the past
two decades have grown at double digit rates in most years while the economy and
inflation have slowed to low single digit growth rates in recent years. The
pharmaceutical industry has been America's most profitable industry for nearly
two decades. The pharmaceutical industry is more profitable than other
industries even after considering a risk-adjusted rate of return. In addition,
the gap in profits between pharmaceutical firms and other Fortune 500 firms (the
best of corporate America) has grown wider in the last decade.
The major product (Claritin) affected by this proposed legislation sells for
a price which is three times the price of the same product in Canada. If
consumers in the U.S. market had access to the same price as in Canada, American
consumers would have saved $1.2 billion in 1998. With passage of the proposed
legislation, the projected cost to American consumers from patent monopoly
extensions will exceed $11 billion (NPV, 2000 $) over the next 10 years. The
majority of the added cost ($7.36 billion) will benefit one corporation
(Schering-Plough). Less than 3.6% of this added cost to the American public is
expected to go toward discovery of new drugs, while it is quite likely that more
than 60% of the total cost (greater than $6.6 billion) will go for marketing and
advertising or for corporate profits.
- This legislation would increase barriers to competition and to a free
market. Without generic competitors in the market, American consumers will pay
higher prices for their prescription drugs. The lower price and high market
penetration of generics, when available, results in substantial savings to
American consumers. These savings also benefit Medicaid, federal and state
government, private insurers, managed care, employers, unions, ERISA plans,
and others who pay directly for prescriptions. The cost of this patent
extension legislation could add as much as $1.32 billion in costs for the
joint federal and state Medicaid programs and another $0.55 billion to $1.32
billion to the cost of other federal and state government health programs.
- The extension of patent monopolies for these marketed drugs will mean that
the introduction of lower cost generics will be delayed up to three years.
Therefore, the American consumer will have to pay more for prescription
medications. Although the patent extension may have positive benefits for
those few pharmaceutical companies whose products are affected, this proposed
legislation will have some very real costs in terms of increased
pharmaceutical expenditures by Americans. These increased pharmaceutical
expenditures will be felt by individual American citizens, by hospital and
community pharmacies, by managed care and health insurance plans, and
certainly by federal and state government health programs. The impact of this
drug legislation will be even more dramatic if Congress adopts some form of
coverage of outpatient prescriptions for Medicare recipients.
REFERENCES
1 Schering-Plough, 1998 Annual Report
2 Ibid.
3 NIH News Release, May 5, 1998, "Arthritis Prevalence Rising as Baby Boomers
Grow Older"
4 Scrip, No. 1927, May 31, 1994, p. 16
5 Jerry I. Treppel and Edward A. Neugeboren, Generic Drug Industry
Overview, Kidder, Peabody, October 5, 1994)
6 Schering-Plough, 1998 Annual Report
7 Pharmaceutical Research and Manufacturers of America, PhRMA Annual
Survey, 1998, Table 2, p. 91
8 Taren Grom. Medical Advertising News, May 1999,18(5) p.8.
9 Price is the wholesale acquisition price for Claritin 10 mg tablets in a
bottle of 100. PriceChek PC, First Databank, Indianapolis, IN, July 1999.
10 Price at ex-factory level provided by pharmacist at a Shoppers Drug Mart,
Toronto, Canada, July 1999. Note: Claritin in Canada is over-the-counter, but
the dosage form and strength are the same as the prescription version in the
U.S.
11 Cathy Spence (editor), The Pharmaceutical R&D Compendium: CMR
International/Scrip's Complete Guide to Trends in R&D, 1997, p 31
12 Pharmaceutical Research and Manufacturers of America, PhRMA Annual
Survey, 1998.
13 Congressional Budget Office, How Increased Competition From Generic
Drugs Has Affected Prices and Returns in the Pharmaceutical Industry, July
1998
14 Ibid.
15 Food and Drug Administration, web site
16 Fortune 500 survey results, Fortune, April issue for years from
1970 to 1999.
17 Office of Technology Assessment, Pharmaceutical R&D: Costs, Risks,
and Rewards, February 1993
18 Ibid, p. 104
Tables
Figures


