

October 24, 2000
Public Citizen’s Congress Watch
U.S. Public Interest Research
Group
Gray Panthers of Metropolitan Washington Area
U.S. Public Interest Research Group
218 D St.,
SE
Washington, D.C. 20003
(202) 546-9707
http://www.pirg.org/
Gray Panthers of Metropolitan Washington Area
711
8th St., NW
Washington, D.C. 20001
(202) 347-9514
|
Contents Stories of D.C. Area Consumers Who Can’t Afford Prescription Drugs
|
Part One: D.C. Metro Area Drug Price Survey Finds Uninsured Consumers Pay Twice as Much as Most Favored Customers
Thousands of D.C. area consumers without prescription drug coverage face price gouging by pharmaceutical manufacturers. A price survey of 33 pharmacies in the D.C. area, conducted by the national consumer groups Public Citizen, U.S. PIRG and the D.C. chapter of the Gray Panthers shows that consumers who lack prescription drug coverage are being charged retail prices that are nearly double the prices prescription drug makers charge their most favored customers.
Public Citizen, U.S. PIRG and the Gray Panthers surveyed the prices of nine of the most widely prescribed drugs for older adults at randomly selected pharmacies in the District and in Maryland and Virginia inside the I-495 Beltway. Three of the nine are also the most widely prescribed drugs to all population groups. The retail price was compared to the "best" price charged to federal agencies, such as the Department of Veterans Affairs. According to the U.S. General Accounting Office, this is the lowest price pharmaceutical manufacturers charge their most favored customers.
The survey found that the prices charged to local uninsured consumers were nearly double — 97% more — the most favored customer price. If the Medicare program were to get the same price discount as the Veterans Department receives, the price of drugs to uninsured Medicare beneficiaries could be cut in half based on the survey results. Such a price cut would make Medicare drug coverage much more affordable for taxpayers and substantially reduce any out-of-pocket costs for beneficiaries.
For the top nine drugs used by seniors to treat a variety of illnesses, those in the D.C. area paid between 74% and 221% more than drug companies’ most favored customers.
D.C. Area Prescription Drug Price Survey Results
|
Prescription Drug |
Use |
Median Retail Price for Uninsured Consumer |
Most Favored Customer/Best Federal Price* |
Price Differential For Consumers Who Pay Retail |
| Celebrex | Pain Management |
$104 |
$51 |
104% |
| Fosamax | Osteoporosis |
$229 |
$114 |
100% |
| Lipitor | Cholesterol |
$210 |
$121 |
74% |
| Norvasc | Blood Pressure |
$128 |
$64 |
99% |
| Pepcid | Ulcer |
$72 |
$22 |
221% |
| Prevacid | Ulcer |
$436 |
$216 |
102% |
| Prilosec | Ulcer |
$136 |
$63 |
117% |
| Zocor | Cholesterol |
$250 |
$134 |
86% |
| Zoloft | Depression |
$249 |
$132 |
89% |
| Average Price |
$201 |
$102 |
97% |
(*Includes $4 markup to reflect reasonable pharmacy dispensing fee.)
Part Two: Medicare Beneficiaries’ Existing Drug Coverage, Drug Industry Profits and Legislative Options
Over 70 million Americans, one in four, have no or inadequate prescription drug coverage. Of those, 13 million senior citizens and people with disabilities who are Medicare beneficiaries have no outpatient drug coverage. Millions of other older adults have inadequate or insecure drug coverage with high deductibles and co-payments and low annual caps. Moreover, Medicare HMOs and employer plans are reducing drug coverage or raising costs for retirees.
In the D.C. metropolitan area at least 127,000 seniors have no prescription drug coverage and thousands of other consumers have no or inadequate coverage. Meanwhile, prescription drug costs are increasing 15-20% a year, breaking the budgets of many families or forcing people in need to go without their medications. Instead of offering most favored prices to Medicare beneficiaries -- because of their huge collective buying power -- as the drug companies do to veterans through the Veterans Department, the companies price gouge uninsured seniors and people with disabilities by charging them their highest retail prices.
The pharmaceutical industry profits handsomely from price gouging. For decades, brand name prescription drug makers have consistently been among the most profitable industries in America. In 1999, the drug industry ranked first among all industries in rates of return on equity, assets, and revenues. Despite these high profits, the prescription drug industry pays 40% less in federal taxes than other major industries. Moreover, CEOs of the top twelve pharmaceutical companies last year averaged $18 million in annual compensation, including stock options, and now hold more than $840 million in unexercised stock options.
The drug industry claims that high U.S. prescription drug prices are necessary to fund research and development. But European countries, which sell the same drugs for a fraction of the U.S. price because their governments negotiate fair prices with prescription drug makers, have produced 60% more new drugs than the United States since 1975. In fact, R&D is a lower priority than profits for drug companies. For instance, in 1999, the top twelve firms put nearly 50% more revenue into profits than put into R&D.
Congress has been debating how to best provide seniors with prescription drug coverage and whether to rein in skyrocketing drug prices. President Clinton and House Minority Leader Gephardt (D-MO) have proposed expanding Medicare to include comprehensive prescription drug coverage, much like the program now provides hospital and physician coverage. However, Rep. Bill Thomas (R-CA) and House Republican leaders passed a bill along party lines that would rely less on Medicare and more on the private insurance industry to offer drug insurance plans and encourage beneficiaries to join HMOs and other managed care plans to get coverage.
While the Clinton-Gephardt plan is far superior to the Thomas proposal, in that it relies on Medicare and not the private sector to provide coverage to seniors, both plans fail to adequately rein in soaring drug costs. To be truly cost-effective for both seniors and taxpayers, a Medicare prescription drug benefit must also use the bargaining power of Medicare to negotiate significantly lower drug prices. Such a proposal is embodied in the "Prescription Drug Fairness for Seniors Act" (H.R. 664/S. 731), which has 163 House and Senate cosponsors.
The prescription drug price survey conducted by Public Citizen, U.S. PIRG and the Gray Panthers found that D.C. consumers without prescription drug insurance are victims of price discrimination by pharmaceutical manufacturers. This survey of 33 local pharmacies in the D.C. metropolitan area found that uninsured consumers who buy retail pay on average twice as much for nine commonly prescribed drugs as most favored customers, such as the Department of Veterans Affairs. For standard dosages of nine brand name drugs most commonly prescribed for seniors, the survey found that D.C. area consumers without prescription drug coverage pay on average 97% more than most favored customers -- $201 versus $102 for equivalent dosages (see Figure 1). (1)
Instead of offering most favored customer prices to Medicare beneficiaries because of their collective buying power, the survey found that pharmaceutical makers price gouge consumers who lack drug coverage by charging them their highest retail prices. The retail price that these consumers pay, as compared to the most favored customer price, ranged from 74% more for the cholesterol drug Lipitor to 221% more for the ulcer drug Pepcid (see Table 1).
Table 1: D.C. Area Prescription Drug Price Survey Results
|
Prescription Drug |
Use |
Median Retail Price for Uninsured Consumer |
Most Favored Customer/Best Federal Price* |
Price Differential For Consumers Who Pay Retail |
| Celebrex | Pain Management |
$104 |
$51 |
104% |
| Fosamax | Osteoporosis |
$229 |
$114 |
100% |
| Lipitor | Cholesterol |
$210 |
$121 |
74% |
| Norvasc | Blood Pressure |
$128 |
$64 |
99% |
| Pepcid | Ulcer |
$72 |
$22 |
221% |
| Prevacid | Ulcer |
$436 |
$216 |
102% |
| Prilosec | Ulcer |
$136 |
$63 |
117% |
| Zocor | Cholesterol |
$250 |
$134 |
86% |
| Zoloft | Depression |
$249 |
$132 |
89% |
| Average Price |
$201 |
$102 |
97% |
(
*Includes $4 markup to reflect reasonable pharmacy dispensing fee; see Survey Methodology.)Celebrex is used for pain management and to relieve inflammation associated with the symptoms of osteoarthritis and rheumatoid arthritis in adults. D.C. area uninsured consumers pay 104% more for the G.D. Searle & Co. manufactured drug.
Osteoporosis is a major threat for 28 million Americans, 80% of whom are women. One out of every two women and one in eight men over 50 will have an osteoporosis-related bone fracture in their lifetime. The survey found that D.C. area uninsured consumers pay 100% more for Merck's osteoporosis drug Fosamax than do most favored customers.
One-third of those over 65 have high cholesterol, a prime risk factor for life-threatening heart diseases and strokes if it is not controlled. The survey found that D.C. area uninsured consumers pay 74% more for Warner Lambert's Lipitor and 86% more for Merck's Zocor than most favored customers.
High blood pressure (hypertension) affects almost 40% of those over 65. For D.C. area consumers without prescription drug coverage, Pfizer's Norvasc, which controls high blood pressure, is priced 99% higher than the company charges its most favored customers.
Nearly 25 million Americans currently suffer from ulcer disease; the condition is more common in those over 65 than in younger people. D.C. area consumers without prescription drug coverage pay 221% more for Merck's Pepcid, 102% more for Abbott's Prevacid, and 117% more for AstraZeneca's Prilosec than the companies charge their most favored customers for the same drug.
Late-life depression affects six million seniors, most of them women. Older people with significant symptoms of depression have roughly 50% higher healthcare costs than non-depressed seniors. Pfizer's anti-depressant Zoloft is 89% more expensive for D.C. area consumers without prescription drug coverage than for most favored customers.
Stories of D.C. Area Consumers Who Can’t Afford Prescription Drugs
According to the most recent data, there are more than 387,000 people over age 65 in the D.C. metropolitan area. These citizens as well as people with disabilities are eligible for Medicare, which does not provide outpatient prescription drug coverage. (2) At least 127,000 of these seniors have no prescription drug coverage. Thousands of others, including people with disabilities and families without health insurance, have no or inadequate prescription drug coverage. Below are the stories of three D.C. consumers who are struggling to afford the prescription drugs they need. They are all Medicare beneficiaries who would benefit from legislation that would provide Medicare drug coverage and allow them to purchase drugs at the most favored prices.
Margaret Washington, age 80, has lived in D.C. for 61 years. She was a teacher and director of a day care center until she retired 10 years ago. She remains active in her church and community even though she suffers from high blood pressure, arthritis, eye problems as well as heart ailments. Her primary source of income is $543 each month from Social Security benefits plus some assistance from her church. Margaret takes seven prescription drugs every day. Margaret’s monthly prescription drug costs exceed $250 so she is often forced to dip into her savings and sometimes ask her daughter for money, even though she hates to burden her. Margaret says that she "can’t pay for anything else other than food" because of the high price of her medication. She believes that the stress from her expensive drug bills complicates her medical conditions. "I know so many people having the same problem paying for their medicine. I have been a good citizen. I have paid my taxes and I have worked hard. I deserve some kind of help to make my prescription drugs more affordable."
Nishi Martin is 80-years-old and was a nurse in the District of Columbia for 35 years. Nishi suffers from high blood pressure, high cholesterol and diabetes. To control her serious conditions, Nishi must take five prescription drugs every day. She spends at least $260 each month on prescription drugs and combined with her husband Don’s prescription drug costs they spend $400 monthly. This necessary expense is almost 30% of their income, which is $1,400 from Social Security benefits. Nishi has cut back on her medication because of their price, but she can not risk her health by not taking her medication. "I tried to cut my medication but my blood sugar level went very high. My doctor said that I should never do that again if I want to live." Nishi and Don are very worried about the high prices of their medications and have cut out many things from their life because they can’t afford them. "We know what the problem is – we need help. Prescription drugs are too expensive."
Willie Speight will be 86 next month. She has lived in D.C. since 1934 and worked as a clerk in government offices including the post office and the government printing office. Willie suffers from osteo arthritis, a sinus condition, and a spastic colon. Willie had corneal implants 20 years ago that are now beginning to degrade – making it harder and harder for her to see. Willie takes at least four prescription drugs a day but may take more depending on whether her conditions flair up on a particular day. Willie’s monthly income is $672 from Social Security benefits. Her prescription drug costs exceed $100 each month. "I wouldn’t be able to pay if it were not for my neighborhood pharmacists who lets me pay for my medicine a little at a time," Willie said. "I need to have drugs to live but the cost is so high that sometimes I can’t pay for groceries."
The survey followed standard methodological protocols for a cross-sectional study with descriptive and analytic components.
Survey Drug Sample
The nine drugs selected for this survey were the most widely prescribed prescription drugs for senior citizens drawn from the 1998 list of the Pennsylvania Pharmaceutical Assistance Contract for the Elderly (PACE), as determined by dollar volume of sales. PACE is the largest state pharmaceutical assistance program for older adults and is frequently used as a data base for studies on prescription drug utilization by seniors. The dosages were the most commonly prescribed amounts according to the PACE data base. The top nine drugs did not include any generic drugs.
The nine drugs and their most commonly prescribed dosages were Celebrex (200mg, 36 tablets), Fosamax (10 mg, 100 tablets), Lipitor (10 mg, 100 tablets), Norvasc (5 mg, 90 tablets), Pepcid (20 mg, 30 tablets), Prevacid (30 mg, 100 capsules), Prilosec (20 mg, 30 capsules), Zocor (20 mg, 60 tablets), and Zoloft (50 mg, 100 tablets).
Most Favored Customer/Best Federal Price
The most favored customer price was determined by the "best" (i.e., the lowest) federal price, usually the federal supply schedule price, provided by the Pharmacy Strategic Benefit Management Group of the Department of Veterans Affairs, which oversees the federal supply schedule prices. Neither the pharmaceutical industry nor the HMOs and large insurers make public the drug prices paid by most favored private sector customers. But the U.S. General Accounting Office has found that "federal supply schedule prices represent the best publicly available information of the prices that pharmaceutical makers charge their most favored customers." (3)
Because the most favored customer/best federal price does not include a pharmacy dispensing fee, an average fee was added. Large purchasers like the federal and state governments and HMOs negotiate a fixed dispensing fee per prescription. Here are some sample fixed dispensing fees:
- HMOs: Specific fees are proprietary information, but industry observers indicate the fee is $4.00 or less per prescription paid to participating pharmacies. (4)
- D.C. Metropolitan Area: The federal government requires states to establish "a reasonable dispensing fee" for the pharmacies participating in the Medicaid prescription drug program. (5) The dispensing fee is $3.63/$3.94 per prescription. (6)
Based upon the best evidence, a $4.00 dispensing fee was added to the most favored customer/best federal price for each prescription.
Pharmacies
Thirty-three retail pharmacies in the D.C. metropolitan area were selected randomly from the online Yellow Pages. The area covered was the District and Maryland and Virginia inside the I-495 Beltway.
Survey Administration, Quality Control, and Data Management
A draft survey instrument and written instructions to solicit surveys were developed. A pretest was administered to five retail pharmacists. The results were evaluated and the instrument, instructions, and training curriculum were modified to improve the administration of the survey questionnaire.
The final standard survey instrument was designed. Revised instructional materials, including an interviewing script explaining the study, were prepared. Interviewers were recruited and received training on interviewing techniques, the questionnaire, and a script. Interviewers were supervised by the staff of U.S. PIRG. Pharmacists in 33 drug stores in the D.C. area were interviewed with the survey instrument and script during weekday morning and afternoon hours by U.S. PIRG and Gray Panthers staff and volunteers. A condition of the interview was anonymity for individual respondents.
Results of the surveys were analyzed by Public Citizen staff. Questionnaires were dated, coded for anonymity, and entered into a database. The median and standard deviation (at the 95% confidence interval) were calculated for each of the drugs surveyed. Figures are rounded to the nearest dollar.
Medicare Beneficiaries Existing Drug Coverage
Prescription drugs are the fastest growing health care expenditure in the United States, and are projected to rise more than twice as fast as all other health care costs this year. Prescription drugs rank behind only hospital and physician costs among all health care expenditures. (7)
Americans spent $111 billion for retail pharmaceutical drugs in 1999, an increase of 19% over 1998. (8) The federal Health Care Financing Administration (HCFA) forecasts a 165% increase in total drug spending over the next ten years. (9)
Skyrocketing prescription drug spending affects all Americans. Drug spending is soaring. Millions of dollars are spent on lobbyists to maintain the pharmaceutical industry’s status as the most profitable industry in the country. Meanwhile, more than 64 million Americans are left with no drug coverage and another seven million have inadequate coverage. (10) The high cost of prescription drugs is a pervasive and tragic national crisis which has forced families and individuals to choose between taking their proper dose of medication and paying for other necessities, such as food and electricity.
Medicare Does Not Cover the Prescription Drugs Seniors Rely On
Medicare recipients are especially dependent on prescription drugs in order to maintain good health. Senior citizens are 12% of the population but account for about one-third of all prescription drug spending. (11) The average Medicare beneficiary fills 18 prescriptions a year. (12) Moreover, 80% of retired Americans take at least one prescribed drug every day, spending on average $1,205 a year. (13)
About 39 million Americans have most of their health care costs paid for by Medicare because they are over the age of 65 or disabled. Yet, Medicare offers almost no outpatient prescription drug coverage. Medicare only covers prescription drugs used in a hospital or nursing home, immunosuppressive drugs, erythropoeitin, oral anti-cancer drugs, hemophilia clotting factors, and some vaccines. Generally, any drug that can be self-administered is not covered.
One in Three Seniors Has No Drug Coverage; Millions More Need Help
As Figure 2 shows, most Medicare recipients have few options to reduce or contain their prescription drug costs. Nationally, at least one in three, or about 13 million beneficiaries, has no drug insurance coverage at all, and millions more have inadequate prescription drug coverage. (14) In the D.C. metropolitan area at least 127,000 seniors have no prescription drug coverage, requiring them to pay all costs out-of-pocket.
Another 24% of retirees nationwide are covered through employer group plans. But the number of firms offering retiree health coverage has dropped from 40% to 28% in the past four years. (15) And many of these retirees are still at risk since employers are capping prescription drug coverage, charging higher deductibles, and requiring co-payments of as much as $30 per prescription.
About 8% of U.S. seniors purchase expensive Medigap insurance policies, which provide inadequate prescription drug coverage. Almost all of the seniors who have purchased Medigap drug coverage are enrolled in two plans with an average annual premium of $1,080, with coverage capped at $1,250 a year, a 50% co-pay and a $250 annual deductible. (16) Those with Medigap coverage pay on average 80% of their drug costs out-of-pocket. (17)
Source:
Margaret Davis, et al, "Prescription Drug Coverage, Utilization, and Spending Among Medicare Beneficiaries," Health Affairs, Jan.-Feb. 1999, Vol. 18, No. 1, pages 231-43.Medicaid, the Department of Veterans Affairs, and other public programs provide prescription drug coverage for 17% of Medicare beneficiaries, including many of the poorest or most medically needy beneficiaries.
One out of six Medicare beneficiaries, or 17%, has coverage through Medicare+Choice HMOs and other managed care arrangements. Many participants were recruited by initial offers of free drug coverage, but according to the Health Care Financing Administration, all Medicare+Choice plans will charge co-pays in 2000, and 86% of them will cap prescription drug coverage in 2000. (18) Almost 60% of all plans will cap coverage below $1,000 and 32% will have a $500 or lower cap. HCFA also reports that Medicare+Choice co-payments for brand name drugs will increase by 2l% and generic co-pays will increase 8% in 2000. Meanwhile, Medicare managed care plans will have dumped 1.5 million seniors from coverage between 1999 and 2001. (19)
This patchwork system leaves three out of four Medicare beneficiaries without decent, dependable coverage. If recent trends continue, the drug coverage some beneficiaries have will continue to erode.
Prescription drug company earnings are skyrocketing along with drug prices. Pharmaceutical manufacturers are the most profitable industry in America -- and have been for a long time:
- The prescription drug industry ranked most profitable among 41 industries in 1999, as measured by rates of return on revenue, equity, and assets, according to Fortune Magazine. The median profit rate was an extraordinary 18.3% as a percentage of revenue – three-and-a- half times higher than the 5.1% profit rate for all industries. (20) In 1970, the prescription drug industry was a little more than twice as profitable as all industries combined 9.3% vs. 4% (see Figure 3).
- Drug companies rank as the most profitable industry for the past 10 years and are consistently among the top two most profitable industries for the past 30 years. (21)
- The ten most profitable drug companies recorded a 20% increase in profits from 1998 to 1999. (22)
- CEOs of the top 12 prescription drug makers averaged roughly $9 million each in salary last year, and doubled their compensation by receiving an average of more than $9 million apiece in stock option grants. Together these 12 CEOs held more than $840 million in stock options. (23)
Source: Public Citizen update of
Stephen W. Schondelmeyer calculation, Competition and Pricing Issues in the
Pharmaceutical Market, PRIME Institute, University of Minnesota based on
data found in Fortune Magazine, 1958 to 1999; Fortune Magazine,
April 2000, Fortune 500 (www.fortune.com).
Foreign Consumers Pay Much Less than U.S. Consumers for the Same Drugs
Pharmaceutical manufacturers charge substantially lower prices overseas for prescription drugs than they charge American consumers. For example, American seniors can cross the border to Canada or Mexico and purchase the same drugs for 25% to 50% less than at home. (24) Figure 4 compares the prices that manufacturers charge in the U.S., with the prices charged for the same drugs in European countries and Canada. On average, the British pay 64%, the Swedes 60%, the French 51%, and the Italians only 49% of the prices paid by Americans for the same prescription drugs
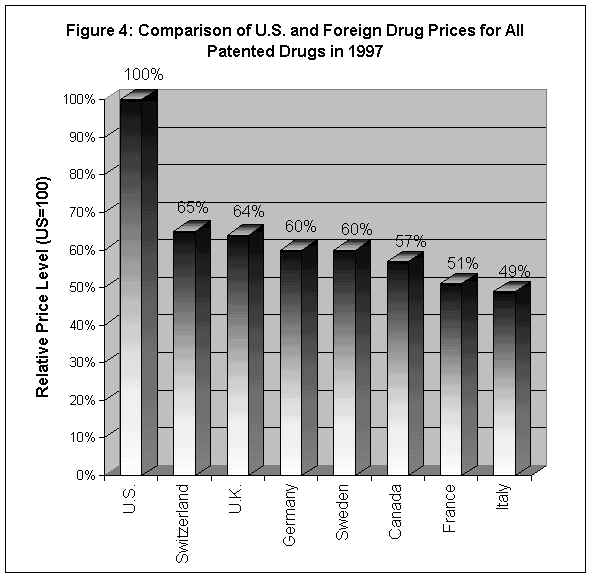
Source: Patented Medicine Drug Review Board of Canada, 1999 Annual Report. Percentages reflect relative price levels of drugs sold by drug manufacturers to wholesalers, hospitals and pharmacies.
Research and Development Myths and Facts
Pharmaceutical manufacturers deny that they price gouge. Instead, they justify high prices as the cost for research and development. Their industry trade association, the Pharmaceutical Research and Manufacturers of America or PhRMA, argues research would decrease and production of wonder drugs would decline if consumers paid lower prices. The fact is our economic competitors have very healthy drug industries even though they employ various means to rein in drug prices – from negotiations with drug companies to price controls to profit controls. Since 1975 European countries have produced 60% more new drugs than the U.S. – 585 vs. 367 new chemical or biological entities (see Figure 5). (25)
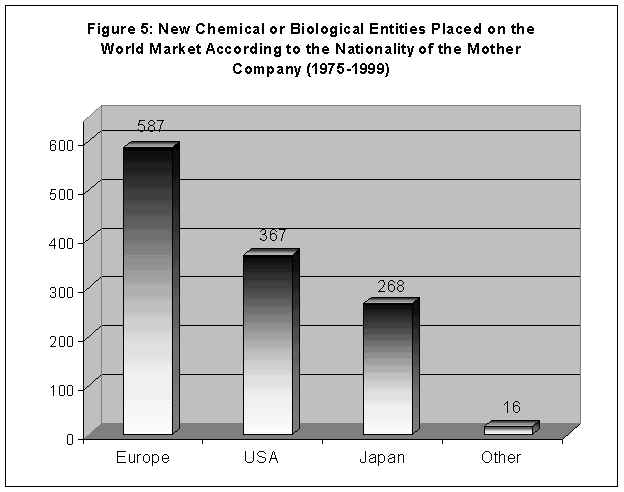
Source: European Federation of Pharmaceutical Industries and Associations, The Pharmaceutical Industry in Figures, 2000.
In reality, R&D is a lower priority than profits for the prescription drug industry. Figure 6 shows how the 12 largest drug companies, which account for more than one-third of industry revenues, allocated 1999 revenue between profits, R&D and marketing and administration costs. (26) For these companies, research and development is obviously a much lower priority than maximizing profits to shareholders and finding new ways to market their existing drugs to customers.
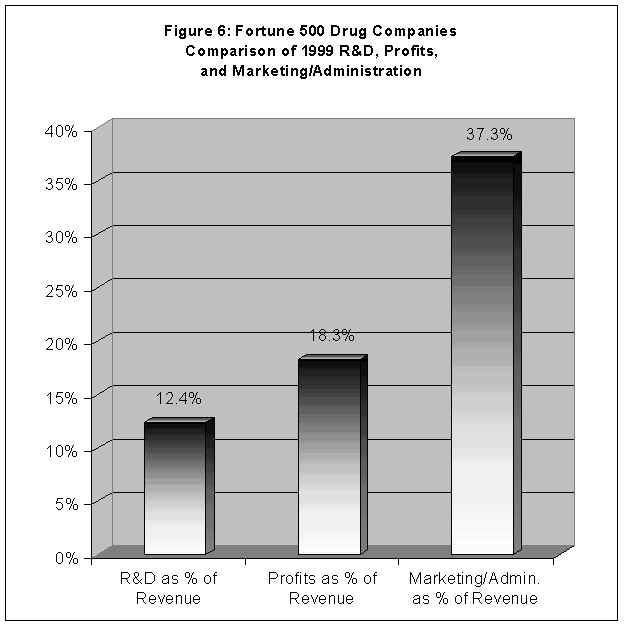
Source: Fortune Magazine, April 2000, Fortune 500 (www.fortune.com).
U.S. Drug Industry Pays Much Less in Taxes than Other IndustriesWhile the prescription drug industry reaps huge profits and price gouges those without prescription drug coverage, U.S. pharmaceutical manufacturers are also shortchanging the taxpayers. According to an analysis prepared by the Congressional Research Service, drug makers paid only 59% of the average federal tax rate paid by all major industries from 1993-1996. Overall, the pharmaceutical industry paid an effective U.S. tax rate of 16.2%, whereas companies in all major industries paid 27.3%. (27)
Federal Trade Commission Investigations
While consumers face rising drug costs, some manufacturers use illegal means to maintain their monopolies and soaring profits. In March 2000, the Federal Trade Commission (FTC) charged some drug manufacturers with stifling competition in the prescription drug markets. The FTC also announced a settlement with other drug manufacturers charged with engaging in anti-competitive agreements.
The FTC charged Hoechst Marion Russel (now Aventis) and Andrx Corporation with engaging in anti-competitive practices intended to keep generic drugs off the market. (28) Hoechst, the manufacturer of Cardizem CD, a drug used to treat hypertension and angina, entered into an agreement with Andrx, the potential manufacturer of the generic version of Cardizem CD, in which Hoechst would pay Andrx $10 million per quarter as well as $60 million per year if Andrx would not put the generic on the market. (29) This agreement benefited both manufacturers while costing consumers millions of dollars each year. A federal judge recently ruled that the Cardizem agreement was an illegal restraint of trade. (30)
The FTC also settled a case in which Abbott Laboratories paid Geneva Pharmaceuticals, Inc. $4.5 million per month to keep Geneva’s generic version of Hytrin, a brand name hypertension and prostate drug, off the market. (31) The FTC settlement agreement bars Abbot and Geneva from entering into further agreements in which a generic company agrees with a manufacturer of a brand name drug not to bring the generic to the market. It also requires FTC approval of agreements involving payments to generic companies to stay off the market. (32) The existence of these two anti-competitive agreements indicates some of the forces at work keeping generics off the market, which contributes to excessively high prescription drug prices.
Special Interest Legislation Helps Drug Manufacturers at Expense of Consumers
While some proposed federal legislation offers solutions to the prescription drug crisis plaguing American seniors, other legislation blatantly assists drug manufacturers in maintaining their high profits at the expense of consumers. The so-called Patent Fairness Act, H.R. 1598/S. 1172, would inappropriately extend the patents of several prescription drugs that will soon expire. Schering-Plough is seeking an extension on its expiring Claritin patent that could cost consumers $7.3 billion over ten years due to continued monopoly pricing. (33) Extending the patent would delay competition for Claritin from generic drug makers and other competitors, who typically charge cheaper prices. Schering-Plough spent $9.2 million on lobbyists in 1999 – more than any other drug company and twice what the company spent in 1998. (34) Most of that spending went to preserve its monopoly on Claritin, which brings in $2.3 billion in U.S. revenues a year.
There is a major debate raging in Congress over how to provide prescription drug coverage to seniors and people with disabilities under Medicare, and whether or not to enact policies that will significantly reduce drug costs. Major proposals include: (35)
Thomas Plan: the Medicare Rx 2000 Act
H.R. 4680, the Medicare Rx 2000 Act, is legislation sponsored by House Republican leaders and Rep. Bill Thomas (R-CA). It passed the House in July 2000 largely along a party-line vote. The bill would not provide prescription drug coverage through the Medicare program, as hospital and physician coverage is currently provided. Instead, it encourages the private insurance industry to offer Medicare beneficiaries prescription drug insurance. It also will force more and more seniors into HMOs to get coverage. The Congressional Budget Office estimates that 74% of Medicare beneficiaries would get coverage under this proposal – 7 million less than under the Clinton-Gephardt plan described below.
The Thomas bill has a monthly premium of $37, 50% higher than the Clinton-Gephardt plan outlined below. It has a deductible of $250 no matter what a person’s income level, which will discourage people from getting their needed drugs in the first place. The basic benefit is $2,100 a year, half of which would be paid for by the beneficiary. If the beneficiary is considered low-income (135% of poverty, or $10,800 single/$13,600 couple) all of the premium would be paid for by the government as well as all but 5% of the cost sharing. There is no assistance for drug expenses between $2,350 to $6,000, no matter what a person’s income. The federal government would pay for all drug costs above $7,050, or $6,000 in a beneficiaries out-of-pocket expenses.
Moreover, H.R. 4680 relies on current private sector methods to reduce drug costs – use of Pharmacy Benefit Managers. PBMs only reduce drug prices a modest 15% – an insufficient savings given the price gouging and huge profit margins of drug companies.
Clinton-Gephardt Plan
President Clinton and House Minority Leader Richard Gephardt (R-MO) have offered an alternative version of reform – H.R. 4770, the Medicare Guaranteed Defined Rx Benefit and Health Provider Relief Act of 2000. Their bill would provide drug coverage under the Medicare program, rather than rely on the private insurance industry and HMOs. The Congressional Budget Office estimates 93% of people now in Medicare would choose to have this drug benefit.
The legislation would provide a comprehensive benefit package for a $25 monthly premium with no deductible. The basic benefit is $2,000 per year, but rises to $5,000 by 2008. Beneficiaries pay 50% of the costs; however, if you are a low-income person (below 135% of the poverty level) Medicare will cover all your costs. When a person reaches $5,000 ($4,000 out-of-pocket) in drug costs the federal government picks up 100%.
Like the Thomas plan, Clinton-Gephardt would not do enough to contain rising drug costs. It also relies on Pharmacy Benefit Managers to negotiate drug discounts rather than permit the Medicare program to negotiate prices with the drug companies. PBMs currently achieve savings of about 15% off the retail level, whereas the Department of Veterans Affairs (VA) negotiates a 50% discount off the retail price.
Allen-Johnson Bill: Prescription Drug Fairness for Seniors Act
The concept of Medicare negotiating drug prices, as the Veterans Department does, is embodied in the "Prescription Drug Fairness for Seniors Act" (H.R. 664/S. 731), sponsored by Rep. Tom Allen (D-ME) and Sen. Tim Johnson (D-SD). The legislation would not provide Medicare drug coverage, so it is only half a solution to the prescription drug problem. But it would rein in high drug costs by harnessing the buying power of 39 million Medicare beneficiaries. Pharmacies would purchase drugs for Medicare beneficiaries from the manufacturer at the same low prices charged to favored customers, such as the Department of Veterans Affairs. Since these prices are about half the retail prices paid by uninsured Medicare beneficiaries, seniors will benefit from substantial cost savings even after including fair pharmacy dispensing fees. H.R. 664/S. 731 has 163 House and Senate co-sponsors representing 37 states and the District of Columbia.
While the Clinton-Gephardt plan is far superior to the Thomas plan, in that it relies on Medicare and not the private sector to provide coverage to seniors, both plans fail to adequately rein in soaring drug costs. To be truly affordable for seniors and taxpayers, a Medicare drug benefit must also use the bargaining power of Medicare to negotiate significantly lower drug prices. Negotiated prices are the first step in constructing an affordable benefit plan -- one with low premiums, low or no co-payments, and good coverage for those with high as well as low or moderate drug expenditures.
In sum, our organizations recommend the following policy options:
Congress should pass comprehensive Medicare prescription drug coverage, not support proposals that depend on the insurance companies and HMOs to provide coverage. The Medicare program should be given the authority to negotiate substantial price reductions with the prescription drug industry, just as it now negotiates reimbursement rates with hospitals, physicians, skilled nursing homes and other providers. Alternatively, the Medicare program could use the prescription drug fee schedule that the Department of Veterans Affairs and other federal agencies have negotiated with the drug industry – saving about 50% off retail prices. If Congress will not give Medicare the authority to get such price cuts, it should pass the "Prescription Drug Fairness for Seniors Act" (H.R. 664/S. 731). It requires drug companies to give local pharmacies the same "best" (or lowest) price that they give their most favored customers, so those prices can be given to Medicare beneficiaries. D.C. area consumers want all the members of the Maryland and Virginia congressional delegations to co-sponsor H.R. 664 and S. 731. Finally, even as Congress debates aid to Medicare beneficiaries, states should work individually or in regional alliances to enact legislation that provides comprehensive drug coverage and lowers drug prices for all uninsured and inadequately insured residents. Legislation recently approved in the State of Maine provides a useful model for achieving fair drug pricing.
Public Citizen is a 150,000 member national non-profit, non-partisan public interest group based in Washington, D.C. Public Citizen has 1,000 members and supporters in the D.C. metropolitan area. Since its founding by Ralph Nader in 1971, Public Citizen has fought for consumer rights, government and corporate accountability, campaign finance reform, a clean environment, and health and safety protection through lobbying, public education, research, and media outreach. Public Citizen has launched the Campaign for Affordable Prescriptions to educate the public and mobilize grassroots support for fair pharmaceutical prices. This report was prepared by Congress Watch, a division of Public Citizen.
U.S. PIRG is the national lobbying office for the State Public Interest Groups. The twenty-six state PIRGs are independent, non-profit, non-partisan public interest advocacy organizations with over half a million members nationwide. The state PIRGs were originally founded by college students in 1971, PIRGs now maintain fully-incorporated state organizations or field offices in approximately 37 states. The PIRGs advocate for consumer, good government and environmental legislation. The PIRGs run the largest network of door-to-door canvasses in the nation to recruit new members and educate the public about consumer and environmental campaigns. The PIRGs formed U.S. PIRG in 1984.
Gray Panthers is a national organization of intergenerational activists dedicated to social and economic justice. For nearly 30 years, the Gray Panthers have worked to make America’s dream a reality: equal opportunity, fair and just treatment for all people, and a better world for all children. Founded in 1970 by social activist Maggie Kuhn, the Gray Panthers today are active in local networks coast-to-coast, working for progressive change in communities and across the nation through civic engagement. The Gray Panthers’ current national priorities include: promoting universal health care, saving Social Security from privatization, exposing pharmaceutical corporations’ discriminatory pricing policies and use of public subsidies for profits, and offering a 10 point Prescription for Patients’ Bill of Rights. The Gray Panthers of the Metropolitan Washington area interviewed pharmacists in pharmacies throughout the D.C. area for this report.
1. The average differential for all nine drugs between the retail price for equivalent dosages paid by uninsured consumers and that paid by most favored customers is shown in order to provide a composite overview of the results of this survey. It does not reflect any one individual’s experience, since one person would not be taking all of the drugs. 2. This statistic was derived from the summary of Forecast of Population, by Jurisdiction for the Washington, D.C. metropolitan area based upon available census data and compiled by the Metropolitan Washington Council of Governments (MWCOG). For the year 2000, MWCOG projected a population of 4, 450,300 people. In 1990, people aged over 65 years comprised 8.7% of the population in the D.C. metropolitan area. We assumed 8.7% remained constant and estimated that the population of people aged over 65 years old in the D.C. metropolitan area is now approximately 387,000. Nationally, one out of three seniors has no prescription dug coverage. Applying the national figure to the D.C. metropolitan area, at least 127,000 seniors have no prescription drug coverage. This analysis focuses solely on seniors who are a sub-population entitled to Medicare. This analysis does not take into account other people eligible for Medicare such as people with disabilities. 3. Correspondence by William J. Scanlon, Director, Health Financing and Public Health Section, U.S. General Accounting Office, April 21, 1999. 4. Public Citizen interviews with independent pharmacists, pharmacy association staff, and Congressional staff, August 1999. 5. Health Care Financing Administration (HCFA), Department of Health and Human Services (DHHS), 42CFR447.331(b)(1). 6. National Association of Chain Drug Stores, "Medicaid Pharmacy Reimbursement", www.nacds.org, August 1999. 7. Health Care Financing Administration (HCFA), Department of Health and Human Services (DHHS), National Health Expenditure Projections, July 19,1999, www.hcfa.gov/stats/NHE-Proj/proj1998. 8. National Institute of Health Care Management Foundation, "Prescription Drugs and Mass Media Advertising," September 2000. 9. Health Care Financing Administration, Department of Health and Human Services, National Health Expenditure Projections, July 19, 1999, www.hcfa.gov/stats/NHE-Proj/proj1998. 10. Department of Health and Human Services, "Prescription Drug Coverage, Spending, Utilization and Prices," April 2000. 11. Stephen Long, "Prescription Drugs and the Elderly: Issues and Options," Health Affairs, Spring II 1994, Vol. 13, No. 2, page 159. 12. Margaret Davis, et al, "Prescription Drug Coverage, Utilization, and Spending Among Medicare Beneficiaries,"Health Affairs, Jan.-Feb. 1999, Vol. 18, No. 1, pages 231-43. 13. Michael E. Gluck, "A Medicare Prescription Drug Benefit," National Academy of Social Insurance Brief, April 1999. 14. M. Davis, op.cit. 15. National Economic Council/Domestic Policy Council, Executive Office of the President, "Disturbing Trends and Dangerous Trends: Facts about Medicare Beneficiaries and Prescription Drug Coverage," July 22, 1999. 16. AARP, "Selecting Medicare Supplemental Insurance," May 1999. 17. AARP Public Policy Institute and the Lewin Group, "Out-of-Pocket Health Spending by Medicare Beneficiaries Age 65 and Older: 1997 Projections," December 1997. 18. HCFA, DHHS, "Medicare + Choice: Changes for the Year 2000," September 1999. 19. HCFA, DHHS, Factsheet, July 15, 1999; Robert Pear, "Estimate of Ousters by H.M.O.s Is Raised," New York Times, July 25, 2000. 20. Fortune Magazine, April 2000, Fortune 500 (www.fortune.com). www.pathfinder.com/fortune/fortune500.medians6.html. 21. Alan Sager and Deborah Socolar, "Affordable Medications for All," Access and Affordability Monitoring Project, Boston University School of Public Health, www.house.gov/berry/prescriptiondrugs/studies.htm. Comparison is made upon median rate of profit for return on equity. 22. Fortune Magazine, April 2000, Fortune 500 (www.fortune.com). 23. AFL-CIO, CEO Pay Watch, June 2000, www.alfcio.org/cqi-bin/aflcio.pl. 24. David Cantor, "Prescription Drug Price Comparisons: The United States, Canada and Mexico," Congressional Research Service, January 23, 1998. 25. A drug is defined as a new chemical or biological entity if it has never before been marketed regardless of dosage form. This measure more accurately reflects the number of new drugs approved in a country or region of the world. 26. Fortune Magazine, April 2000, Fortune 500 (www.fortune.com). 27. Gary Guenther, "Federal Taxation of the Drug Industry from 1990 to 1996,"Congressional Research Service Memorandum to the Joint Economic Committee, December 13, 1999. 28. Federal Trade Commission, "FTC Charges Drug Manufacturers with Stifling Competition in Two Prescription Drug Markets," FTC Press Release, March 16, 2000. 29. Ibid. 30. Sheryl Gay Stolberg and Jeff Gerth, "How Companies Stall Generics and Keep Themselves Healthy," New York Times, July 23, 2000. 31. Federal Trade Commission, "FTC Charges Drug Manufacturers with Stifling Competition in Two Prescription Drug Markets," FTC Press Release, March 16, 2000. 32. Ibid. 33. Steven Schondelmeyer, "Patent Extension of Pipeline Drugs: Impact on U.S. Health Care Expenditures," PRIME Institute, University of Minnesota, July 28, 1999. 34. Public Citizen, "Schering-Plough Political Money Pushes Claritin Patent Extension and Distorts GAO Report," August 2000. 35. The analysis of the Thomas and Clinton-Gephardt plans is largely drawn from Michael E. Gluck, "A Side-by-Side Comparison of Selected Medicare Prescription Drug Coverage Proposals," prepared for the Henry J. Kaiser Family Foundation, August 2000.
Click here for a statement by Frank Clemente, Director of Public Citizen's Congress Watch, on the D.C. study. Or, click here for the news release. (October 24, 2000)