|

FOR IMMEDIATE RELEASE:
March 14, 2001
| Contact: |
Meg Mullery |
202.342.8439 |
Specialty Steel Imports in 2000 Set Record
Total Stainless Steel Bar, Rod & Wire
Imports
Captured More than Half of the U.S. Market
(Washington, DC) - Total specialty steel imports in
2000 hit the highest level ever, according to year-end data
released today by the Specialty Steel Industry of North
America (SSINA). Similarly, imports of stainless steel, the
industry's largest product line, reached record highs.
The data reflect that specialty steel imports in 2000
increased 7%, to 894,009 from 834,412 tons in 1999. More than
a quarter of the U.S. market for specialty steel products -
27% -- was lost to these imports.
Paralleling the total specialty steel data, imports of
stainless steel also increased 7% to 692,726 in 2000 from
645,282 tons the previous year, with import penetration
increasing to 27%.
Total imports of all long products, i.e., stainless
steel bar, rod and wire, captured more than half of the U.S.
market - 52%. This was a 7-percentage point increase in import
penetration over 1999, with imports of long products in 2000
at 238,840 tons vs. 177,946 tons in 1999.
"The last decade saw imports soar from 373,148 tons in
1990 to last year's 894,009 tons, a stunning 140% increase.
Most of these imports enter the U.S. market at prices that are
unfair, enjoying excessive subsidization from their home
governments. We believe it is time for strong action, and we
recently developed a plan of action that would help this
modern, efficient and competitive industry combat the record
deluge of unfairly traded imports," said H.L. Kephart, SSINA
Chairman and President and Chief Executive Officer of G.O.
Carlson, Inc., a specialty steel producer in Thorndale,
Pennsylvania.
Kephart was referring to a recommended program that the
industry made public last week which would involve the Office
of the United States Trade Representative, Department of
Commerce, Customs Service, and Congress. He explained,
"Specialty steel producers have been very aggressive and
successful over the last several years in taking targeted
actions against specific foreign producers for dumping and
foreign government subsidies of particular specialty steel
products. The nature and depth of the current import crisis,
however, requires a more comprehensive approach by the U.S.
government. We look forward to working with the Administration
and Congress to implement this plan."
According to the data, while imports of stainless steel
sheet/strip decreased 5%, stainless steel plate imports
increased 9% in 2000 vs. 1999. Imports of stainless steel
plate were 65,622 tons in 2000 compared to 60,305 in 1999.
Import penetration for stainless steel plate increased 2
percentage points in 2000 to 26%.
Stainless rod and bar imports saw increases of 25% and
44%, respectively, in 2000, with rod imports capturing a full
three-quarters of the U.S. market. This 75% import penetration
is a 6 percentage point increase over 1999; stainless bar
imports took a 47% bite out of the U.S. market, a 7 percentage
point increase. Stainless wire imports increased by 26%.
Imports of tool steel increased 6% to 78,629 tons,
reflecting an import penetration of 69% for 2000. Electrical
steel imports increased 7% to 122,654 tons; import penetration
remained the same at 22%.
SSINA is a Washington, DC-based trade association
representing virtually all continental specialty steel
producers. Specialty steels are high technology, high value
stainless and other specialty alloy products. While shipments
of specialty steel account for only 2% of all steel shipped in
North America, annual revenues of approximately $8 billion
account for over 14% of the total value of all steel shipped.
David A. Hartquist, an international trade attorney
with the Washington, D.C. law firm of Collier Shannon Scott,
PLLC, serves as lead counsel to the SSINA.
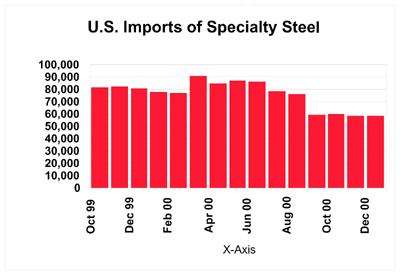
Note: See attached tables for more information on
U.S. imports, consumption and market penetration data; and bar
chart reflecting the 15-month trend of specialty steel imports
between October 1999 and December 2000. Attachment to press
release: Discussion paper entitled "Recommended
Program to Address the Steel Crisis" developed by the
Specialty Steel Industry of North America (SSINA).
U.S. Imports, Consumption and Market Penetration
Data
through 1999 and December 2000
For Specialty Steel
Product Lines
|
MONTHLY AVERAGE |
|
| |
4th Qtr.
'00
(Oct.-Dec.) |
3rd Qtr.
'00
(Jul.-Sep.) |
%
Change
4th Qtr. '00 vs.
3rd Qtr. '00 |
4th Qtr.
'99
(Oct.-Dec.) |
%
Change
4th Qtr. '00 vs.
4th Qtr. '99 |
Current
Month's
Data |
| IMPORTS |
| Stainless Sheet/Strip |
21,461 |
31,193 |
-31.2% |
39,947 |
-46.3% |
21,315 |
| Stainless Plate |
3,034 |
4,656 |
-34.8% |
5,865 |
-48.3% |
3,342 |
| Stainless Bar |
8,732 |
10,357 |
-15.7% |
9,435 |
-7.4% |
8,618 |
| Stainless Rod |
5,515 |
6,857 |
-19.6% |
6,535 |
-15.6% |
4,920 |
| Stainless Wire** |
2,437 |
2,636 |
-7.6% |
2,328 |
4.7% |
2,188 |
| Total Stainless*** |
41,180 |
55,699 |
-26.1% |
64,110 |
-35.8% |
39,383 |
| Tool Steel |
7,301 |
6,249 |
16.8% |
6,003 |
21.6% |
8,738 |
| Electrical Steel |
10,686 |
9,269 |
15.3% |
11,504 |
-7.1% |
10,474 |
| Total Specialty Steel*** |
59,167 |
71,218 |
-16.9% |
81,617 |
-27.5% |
58,595 |
| CONSUMPTION |
| Stainless Sheet/Strip |
127,889 |
149,001 |
-14.2% |
168,522 |
-24.1% |
130,615 |
| Stainless Plate |
16,658 |
18,331 |
-9.1% |
22,410 |
-25.7% |
14,600 |
| Stainless Bar |
19,641 |
21,224 |
-7.5% |
21,084 |
-6.8% |
19,061 |
| Stainless Rod |
7,452 |
8,703 |
-14.4% |
8,974 |
-17.0% |
6,567 |
| Stainless Wire** |
5,980 |
6,051 |
-1.2% |
7,112 |
-15.9% |
5,183 |
| Total Stainless*** |
177,620 |
203,310 |
-12.6% |
228,102 |
-22.1% |
176,027 |
| Tool Steel |
9,719 |
9,177 |
5.9% |
9,258 |
5.0% |
10,956 |
| Electrical Steel |
43,971 |
41,159 |
6.8% |
46,046 |
-4.5% |
40,186 |
| Total Specialty Steel*** |
231,311 |
253,646 |
-8.8% |
283,406 |
-18.4% |
227,169 |
| IMPORT PENETRATION |
| Stainless Sheet/Strip |
16.8% |
20.9% |
-4.2% |
23.7% |
-6.9% |
16.3% |
| Stainless Plate |
18.2% |
25.4% |
-7.2% |
26.2% |
-8.0% |
16.0% |
| Stainless Bar |
44.5% |
48.8% |
-4.3% |
44.7% |
-0.3% |
45.2% |
| Stainless Rod |
74.0% |
78.8% |
-4.8% |
72.8% |
1.2% |
74.9% |
| Stainless Wire** |
40.8% |
43.6% |
-2.8% |
32.7% |
8.0% |
42.2% |
| Total Stainless*** |
23.2% |
27.4% |
-4.2% |
28.1% |
-4.9% |
22.4% |
| Tool Steel |
75.1% |
68.1% |
7.0% |
64.8% |
10.3% |
79.8% |
| Electrical Steel |
24.3% |
22.5% |
1.8% |
25.0% |
-0.7% |
26.1% |
| Total Specialty Steel*** |
25.6% |
28.1% |
-2.5% |
28.8% |
-3.2% |
25.8% |
| NOTE: |
Changes in import penetration are percentage
point changes. |
| * |
Imports adjusted to exclude hot bands imported
for re-rolling and reported under shipments.
|
| ** |
Shipments for 2000 estimated and subject to
revision when actual data is received. |
| *** |
Shipment and consumption data for these
categories may be overstated due to the inclusion of
shipments from wire redrawers which are aready included
in shipments/imports of rod; consequently import
penetration may be slightly understated.
|
Prepared by Georgetown Economic Services for the
Specialty Steel Industry of North America
U.S. Imports, Consumption and Market Penetration
Data*
For Specialty Steel Product Lines
2000/1999/1998
|
Imports |
U.S. Consumption |
Twelve Month
Import Penetration
|
Specialty Steel
Product
Lines |
Month
Dec.
2000 |
YTD
Dec.
2000 |
Percent
Increase/
Decrease |
YTD
Dec.
2000 |
Percent
Increase/
Decrease |
YTD
Dec.
2000 |
YTD
Dec.
1999 |
| Stainless Sheet/Strip |
21,315 |
388,263 |
-5% |
1,875,208 |
-1% |
21% |
21% |
| Stainless Plate |
2,342 |
65,622 |
9% |
252,076 |
1% |
26% |
24% |
| Stainless Bar |
8,618 |
125,725 |
44% |
267,115 |
22% |
47% |
40% |
| Stainless Rod |
4,920 |
82,056 |
25% |
108,910 |
15% |
75% |
69% |
| Stainless Wire** |
2,188 |
31,059 |
26% |
83,032 |
-2% |
37% |
29% |
Total Stainless Steel***
(Sheet, Strip,
Plate, Bar, Rod & Wire) |
39,383 |
692,726 |
7% |
2,586,341 |
2% |
27% |
25% |
| Tool Steel |
8,738 |
78,629 |
6% |
114,226 |
1% |
69% |
65% |
| Electrical Steel |
10,474 |
122,654 |
7% |
564,474 |
10% |
22% |
22% |
| Total Specialty |
58,595 |
894,009 |
7% |
3,265,041 |
3% |
27% |
26% |
1999 and 1998 statistical data in tons
follow:
|
Imports |
U.S. Consumption
|
Twelve Month
Import Penetration
|
Specialty Steel
Product
Lines |
1999
|
Percent
Increase/
Decrease |
1999
|
Percent
Increase/
Decrease |
1999
|
1998
|
| Stainless Sheet/Strip |
407,032 |
-2% |
1,896,918 |
4% |
21% |
23% |
| Stainless Plate |
60,304 |
7% |
249,955 |
-6% |
24% |
21% |
| Stainless Bar |
87,537 |
-7% |
219,156 |
-8% |
40% |
40% |
| Stainless Rod |
65,672 |
6% |
94,783 |
5% |
69% |
69% |
| Stainless Wire** |
24,738 |
-19% |
85,113 |
-7% |
29% |
33% |
Total Stainless Steel***
(Sheet, Strip,
Plate, Bar, Rod & Wire) |
645,282 |
-2% |
2,545,924 |
2% |
25% |
26% |
| Tool Steel |
74,117 |
9% |
113,431 |
5% |
65% |
63% |
| Electrical Steel |
115,012 |
-8% |
512,062 |
-1% |
22% |
24% |
| Total Specialty |
834,412 |
-2% |
3,171,417 |
1% |
26% |
27% |
|
| NOTE: |
Changes in import penetration are percentage
point changes. |
| * |
Imports adjusted to exclude hot bands imported
for re-rolling and reported under shipments.
|
| ** |
Shipments for 2000 estimated and subject to
revision when actual data is received. |
| *** |
Shipment and consumption data for these
categories may be overstated due to inclusion of
shipments from wire redrawers which are aready included
in shipments/imports of rod; consequently import
penetration may be slightly understated.
|
Prepared by Georgetown Economic Services for the
Specialty Steel Industry of North America
|
