|

FOR IMMEDIATE RELEASE:
May 17, 2001
| Contact: |
Meg Mullery |
202.342.8439 |
U.S. Market Share Lost to Unfair Specialty Steel
Imports
Industry Calls on President to Act Promptly
(Washington DC) -- Imports of specialty steel continue
to wreak havoc with more than a quarter of the U.S. market
lost to imports, according to the latest available data
released today by the Specialty Steel Industry of North
America (SSINA).
U.S. market share lost 27% to specialty steel imports
in January/February of this year, which is no change from last
year. For the same 2001 period, imports of stainless steel,
the industry's largest product line, captured 26% of U.S.
market share, while import penetration for individual
subproduct lines ranged from 19% (for stainless steel
sheet/strip and stainless steel plate) to a high of 82% (for
stainless steel rod).
"Our competitive, viable industry continues to lose
substantial market share to waves of dumped and subsidized
imports," said H. L. Kephart, SSINA Chairman and President and
Chief Executive Officer of G.O. Carlson, Inc., a specialty
steel producer in - Thorndale, Pennsylvania. "Among the major
markets, only the United States is largely open and free of
subsidies. These unfairly traded imports impart substantial
costs not only to the specialty steel industry, but to the
U.S. economy and global trading system."
"We know that President Bush and his administration
have been actively considering how to address this situation.
SSINA respectfully calls upon the President to act promptly to
implement both short- and long-term solutions to this
pervasive problem," Kephart stated. "A Recommended Program to
Address the Steel Crisis," a white paper compiled by SSINA,
was sent to the White House on March 8, 2001.
The data reflect that specialty steel imports and
consumption declined 18% and 19%, respectively, in YTD
February 2001 vs. the same 2000 period. Stainless steel
imports saw a 26% drop, while consumption was down 21%.
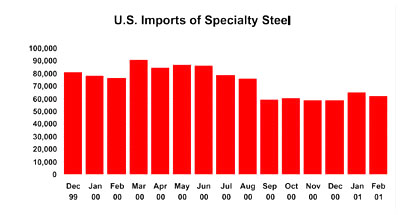
According to Kephart, however, February was the second
consecutive month of increasing stainless steel imports.
Explained Kephart, "In December 2000, total stainless steel
imports were 39,383 tons. In January 2001, imports jumped to
45,176 tons, a 10% increase over the previous month. February
saw another increase in total stainless steel imports to
46,216 tons. These numbers indicate that imports continue to
land on our shores in huge and growing numbers."
SSINA is a Washington, DC-based trade association
representing virtually all continental specialty steel
producers. Specialty steels are high technology, high value
stainless and other specialty alloy products.
While shipments of specialty steel account for only 2%
of all steel shipped in North America, annual revenues of
approximately $8 billion account for 14% of the total value of
all steel shipped.
David A. Hartquist, an international trade attorney
with the Washington, D.C. law firm of Collier Shannon Scott,
PLLC, serves as lead counsel to the SSINA.
Note to Editors: See attached tables for more
information on U.S. imports, consumption and market
penetration data; and bar chart reflecting the 15-month trend
of specialty steel imports between December 1999 and February
2001.
U.S. Imports, Consumption and Market Penetration
Data*
through 2000 and February 2001
For Specialty Steel
Product Lines
| |
MONTHLY AVERAGE |
|
| |
1st Qtr.
'01
(Jan.-Feb.) |
4th Qtr.
'00
(Oct.-Dec.) |
%
Change
1st Qtr. '01 vs.
4rd Qtr. '00 |
1st Qtr.
'00
(Jan-Feb.) |
%
Change
1st Qtr. '01 vs.
1st Qtr. '00 |
Current
Month's
Data |
| IMPORTS |
| Stainless Sheet/Strip |
23,923 |
21,461 |
11.5% |
35,308 |
-32.2% |
22,923 |
| Stainless Plate |
3,423 |
3,034 |
12.8% |
7,077 |
-51.6% |
3,885 |
| Stainless Bar |
9,750 |
8,732 |
11.7% |
10,249 |
-4.9% |
10,488 |
| Stainless Rod |
5,878 |
5,515 |
6.6% |
6,960 |
-15.5% |
6,192 |
| Stainless Wire** |
2,721 |
2,437 |
11.6% |
2,424 |
12.2% |
2,727 |
| Total Stainless*** |
45,696 |
41,180 |
11.0% |
62,019 |
-26.3% |
46,216 |
| Tool Steel |
6,957 |
7,301 |
-4.7% |
6,102 |
14.0% |
7,014 |
| Electrical Steel |
10,704 |
10,686 |
0.2% |
9,169 |
16.7% |
8,789 |
| Total Specialty Steel*** |
63,357 |
59,167 |
7.1% |
77,290 |
-18.0% |
62,019 |
| CONSUMPTION |
| Stainless Sheet/Strip |
126,325 |
127,889 |
-1.2% |
164,870 |
-23.4% |
121,623 |
| Stainless Plate |
17,597 |
16,658 |
5.5% |
23,102 |
-23.9% |
17,501 |
| Stainless Bar |
21,553 |
19,641 |
9.7% |
22,424 |
-3.9% |
22,174 |
| Stainless Rod |
7,178 |
7,452 |
-3.7% |
8,239 |
-12.9% |
7,359 |
| Stainless Wire** |
5,854 |
5,854 |
-2.1% |
7,431 |
-21.2% |
5,567 |
| Total Stainless*** |
178,489 |
177,620 |
0.5% |
226,066 |
-21.0% |
174,224 |
| Tool Steel |
9,141 |
9,719 |
-6.0% |
9,374 |
-2.5% |
8,469 |
| Electrical Steel |
43,927 |
43,971 |
-0.1% |
48,609 |
-9.6% |
37,572 |
| Total Specialty Steel*** |
231,557 |
231,311 |
0.1% |
284,049 |
-18.5% |
220,265 |
| IMPORT PENETRATION |
| Stainless Sheet/Strip |
18.9% |
16.8% |
2.2% |
21.4% |
-2.5% |
18.8% |
| Stainless Plate |
19.5% |
18.2% |
1.3% |
30.6% |
-11.2% |
22.2% |
| Stainless Bar |
45.2% |
44.5% |
0.8% |
45.7% |
-0.5% |
47.3% |
| Stainless Rod |
81.9% |
74.0% |
7.9% |
84.5% |
-2.6% |
84.1% |
| Stainless Wire** |
46.5% |
40.8% |
5.7% |
32.6% |
13.9% |
49.0% |
| Total Stainless*** |
25.6% |
23.2% |
2.4% |
27.4% |
-1.8% |
26.5% |
| Tool Steel |
76.1% |
75.1% |
1.0% |
65.1% |
11.0% |
82.8% |
| Electrical Steel |
24.4% |
24.3% |
0.1% |
18.9% |
5.5% |
23.4% |
| Total Specialty Steel*** |
27.4% |
25.6% |
1.8% |
27.2% |
0.2% |
28.2% |
| NOTE: |
Changes in import penetration are percentage
point changes. |
| * |
Imports adjusted to exclude hot bands imported
for re-rolling and reported under shipments.
|
| ** |
Shipments for 2001 estimated and subject to
revision when actual data is received. |
| *** |
Shipment and consumption data for these
categories may be overstated due to the inclusion of
shipments from wire redrawers which are aready included
in shipments/imports of rod; consequently import
penetration may be slightly understated.
|
Prepared by Georgetown Economic Services for the
Specialty Steel Industry of North America
U.S. Imports, Consumption and Market Penetration
Data*
For Specialty Steel Product Lines
2001/2000/1999
|
Imports |
U.S. Consumption |
Two Month
Import
Penetration |
Specialty Steel
Product
Lines |
Month
Feb.
2001 |
YTD
Feb.
2001 |
Increase/
Decrease
YTD
02-00 |
Month
Feb.
2001 |
YTD
Feb.
2001 |
Increase/
Decrease
YTD
02-00 |
YTD
Feb.
2001 |
YTD
Feb.
2000 |
| Stainless Sheet/Strip |
22,923 |
47,846 |
-32% |
121,623 |
252,650 |
-23% |
19% |
21% |
| Stainless Plate |
3,885 |
6,846 |
-52% |
17,501 |
35,157 |
-24% |
19% |
31% |
| Stainless Bar |
10,488 |
19,501 |
-5% |
22,174 |
43,105 |
-4% |
45% |
46% |
| Stainless Rod |
6,192 |
11,757 |
-16% |
7,359 |
14,356 |
-24% |
82% |
73% |
| Stainless Wire** |
2,727 |
5,442 |
12% |
5,567 |
11,708 |
-21% |
46% |
33% |
Total Stainless Steel***
(Sheet, Strip,
Plate, Bar, Rod & Wire) |
46,216 |
91,392 |
-26% |
174,224 |
356,976 |
-21% |
26% |
27% |
| Tool Steel |
7,014 |
13,914 |
14% |
8,469 |
18,281 |
-2% |
76% |
65% |
| Electrical Steel |
8,789 |
21,408 |
17% |
37,572 |
87,854 |
-10% |
24% |
19% |
| Total Specialty |
62,019 |
126,714 |
-18% |
220,265 |
463,111 |
-19% |
27% |
27% |
2000 and 1999 statistical data in tons
follow:
|
Imports |
U.S. Consumption
|
Twelve Month
Import Penetration
|
Specialty Steel
Product
Lines |
2000
|
Percent
Increase/
Decrease |
2000
|
Percent
Increase/
Decrease |
2000
|
1999
|
| Stainless Sheet/Strip |
388,263 |
-5% |
1,875,208 |
-1% |
21% |
21% |
| Stainless Plate |
65,622 |
9% |
252,076 |
1% |
26% |
24% |
| Stainless Bar |
125,725 |
44% |
267,115 |
22% |
47% |
40% |
| Stainless Rod |
82,056 |
25% |
108,910 |
15% |
75% |
69% |
| Stainless Wire** |
31,059 |
26% |
83,032 |
-2% |
37% |
29% |
Total Stainless Steel***
(Sheet, Strip,
Plate, Bar, Rod & Wire) |
692,726 |
7% |
2,586,341 |
2% |
27% |
25% |
| Tool Steel |
78,629 |
6% |
114,226 |
1% |
69% |
65% |
| Electrical Steel |
122,654 |
7% |
564,474 |
10% |
22% |
22% |
| Total Specialty |
894,009 |
7% |
3,265,041 |
3% |
27% |
26% |
|
