ADMINISTRATION
for
CHILDREN and FAMILIES
Final FY 2002 Annual Performance Plan,
Revised Final FY 2001
Performance Plan,
and
Fy 2000 Annual Performance Report
for the Government Performance and Results Act of 1993
The Administration for Children and Families (ACF), within the Department of Health and Human Services, administers programs which promote the economic and social well-being of children, youth, and particular attention on vulnerable populations including low-income children, refugees, Native Americans, and the developmentally disabled.
April 2001
Table of Contents
Part I: Agency Context For Performance Measurement
1.1 Agency
mission and long term goals
1.2 Organization,
Programs, Operations, Strategies and Resources
1.3 Partnerships and
coordination
1.4 Summary FY 2000
performance report
Performance
commitment
Summary of
performance success
Summary of
performance challenges
Part II: Program Planning and Assessment
Strategic Goal 1: Increase Economic Independence and Productivity for Families
1.1
Temporary Assistance for Needy Families
1.2 Developmental
Disabilities: General
1.3 Developmental
Disabilities: Employment
1.4 Refugee
Resettlement
1.5 Social
Services Block Grant
2. Increase independent living
2.1
Developmental Disabilities: Housing
2.2 Assets for
Independence
3. Increase parental responsibility
4. Increase affordable child care
Strategic
Goal 2: Improve Healthy Development, Safety and Well-Being
of Children and
Youth
5. Increase the quality of child care to promote childhood development
6. Improve the health status of children
7. Increase safety, permanency, and well being of children and youth
7.1 Child
Welfare
7.2 Developmental
Disabilities: Education
7.3 Developmental
Disabilities: Health
7.4 Youth Programs
Strategic Goal 3: Increase the Health and Prosperity of Communities and Tribes
8. Build healthy, safe and supportive communities and Tribes
8.1
Community Services Block Grant
8.2 Family
Violence Prevention Program
8.3 Low Income
Home Energy Assistance
8.4 Native
Americans Programs
Strategic Goal 4: Build a Results-Oriented Organization
9. Develop
and retain a highly skilled, strongly motivated staff
10. Improve
automated data and management systems
Appendices to the Performance Plan
A.1 Approach to performance measurement
Methodology
and rationale
Data verification
and validation and other data issues
A.2 Changes and
improvements over previous year
A.3 Linkage to
DHHS and OPDIV strategic plan
A.4 FY 1999
performance data omitted from prior FY 1999 performance
report
A.5 Status of FY
2000 data and detailed changes between final FY 2001 plan and revised final FY
2001 plan
A.6 Performance
measurement linkages
Information
technology planning
Cost accounting
Program
evaluation
Linkage with budget
Cross
walk of ACF goals and objectives with the budget:
Detailed budget
linkage table
The Administration for Children and Families is committed to managing for results. Four years ago, we published our first performance plan for fiscal year FY 1999 and last year, we published our first combined performance plan and report. This combined plan and report gives us the ability to display the achievements of past years with future strategic planning and resource decisions. By combining this information in one document, we have created a tool that is useful to ACF management, our partners and stakeholders to begin integrating budget and performance management systems.
The performance information that follows is consistent with the Government Performance and Results Act of 1993 (GPRA) requirements and supports ACF’s four goals and related strategic objectives. Our ability to report on actual performance for FY 2000 is dependent on the availability and reliability of administrative performance data submitted by our partners. Over time, we will be able to analyze annual trends and adjust targets and distribution of resources accordingly. Currently our targets for FY 2002 are projections of incremental improvement or maintenance of effort.
This combined corporate plan and report is the result of lengthy conversations, negotiations and collaborative efforts among our fourteen program areas and our partners. The accomplishment of these results is dependent upon the joint efforts of ACF, its partners and coordination with other Federal agencies. The diversity of programs, target populations, levels of government, and range of partners make efforts to establish and achieve goals and outcome measures extremely challenging.
In FY 2000, ACF placed special emphasis on developing priority work plans that were aligned with the annual performance plan results. This effort required both central and regional office staff to identify cross-cutting strategies and activities in collaboration with their partners. These work plans include more detailed strategies and activities covering ten cross-cutting program areas: welfare reform, child support, child care, infants and toddlers, Head Start, child welfare, youth, Tribal programs, domestic violence and ACF reinvention efforts.
Purpose
The FY 2002 Annual Performance Plan provides a comprehensive set of measures and outcomes for the major programs in the Administration for Children and Families (ACF). The combined FY 2002 Performance Plan and FY 2000 Performance Report identify the performance measures that we will use to track our progress toward achieving strategic goals. The plan includes linkages of the goals and objectives to the budget (see Budget Linkage Table in Appendix A.6) and to the Department-wide strategic plan (see Appendix A.3).
Role of ACF
With its partners, ACF supports strategies that create opportunities for individuals, families, and communities to be economically and socially productive. Our services and interventions are directed toward improving job skills, access to social services, family and community stability and independent living for low-income families, children, the elderly, persons with disabilities and distressed communities. ACF’s role in accomplishing its objectives is to provide leadership, funding and technical assistance to its partners, conduct research, promote best practices, and work to eliminate barriers to access of services.
Sustained commitment to continuous improvement has focused our attention on measurable results. Substantial progress has been made in the past several years in helping welfare recipients move to work, increasing child support payments, and providing child care and early learning services to low and moderate income families.
Status of Children and Families
Our commitment to improving the lives of children and families is the foundation for the series of strategies, goals, objectives, measures and targets included in this plan. Statistics provide evidence for a continued focus on providing assistance to children and families. For example, data (1999) indicate that 16.9 percent of all children still live in poverty. Preschool enrollment for these children is still at only 40 percent. In 1999, only 1.8 million of children in low-income families are receiving child-care subsidies through the Federal Child Care and Development Fund (CCDF) on an average monthly basis representing 12 percent of the children eligible for these subsidies. Over 900,000 children were victims of substantiated or indicated child abuse or neglect in 1998. Only twenty-one percent of children who exit foster care achieve permanency after three or more years; 33 percent of the children currently in care (as of September 1999) have been in care for three or more years. While the welfare caseload has fallen by 8.3 million recipients (from 14.1 million in January 1993 to 5.8 million in June 2000, a drop of 59 percent), there remains the need to make continued investments in raising wages and other incentives to make rewards of work economically meaningful. Although many families work hard, they struggle financially to support their children.
Vision, Mission and Goals
VISION STATEMENT
We are committed to the vision of strong, healthy, supportive communities where families and individuals are empowered to increase their economic and social well-being and productivity and to programs that contribute to the protection and healthy development of children.
MISSION STATEMENT
The Administration for Children and Families provides national leadership and creates opportunities for low-income, disadvantaged families and individuals to lead economically and socially productive lives, for children to develop into healthy adults, and for communities to become more prosperous and supportive of their members.
ACF STRATEGIC GOALS
Increase economic independence and productivity for families
Improve healthy development, safety and well-being of children and youth
Increase the health and prosperity of communities and Tribes
Build a results-oriented organization
Organizational Structure and Program Responsibilities
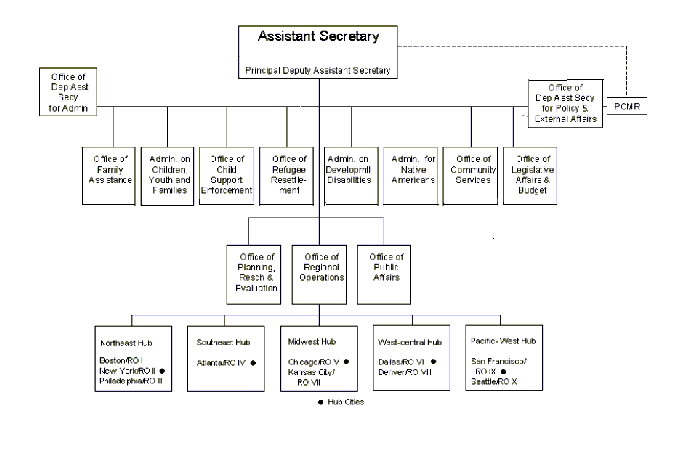
ACF employs 1500 people in Washington, DC and the ten regional offices (five regions also act as hub sites for activities that affect several regions). ACF was established in 1991, bringing together several pre-existing programs; it is organized into eight program offices and five staff offices.
ACF is responsible for over 60 programs that promote the economic and social well being of families, children, individuals and communities. With its partners, ACF administers the State-Federal welfare reform program, Temporary Assistance to Needy Families (TANF) providing assistance to an average of 5.88 million persons monthly as of June 2000. ACF administers the national child support enforcement system collecting almost $18 billion in FY 2000 in payments from non-custodial parents referred for collection follow-up. It also administers the Head Start program serving 857,664 pre-school children. ACF provides funds to assist low-income families in paying for child care and supports State programs to provide foster care and adoption assistance.
How Goals, Outcomes and Measures were Selected
ACF focuses on outcomes because they not only convey a sense of value to the American people, but they provide us with a focus for working with a broad range of partners, local communities, non-profit
organizations and States, to accomplish agreed upon goals. Representative performance measures address activities in each program area. These measures, and the discussion of strategies under each, are generally illustrative of the major activities within ACF.
The targets reflect a combination of current funding, past funding, program initiatives and the actions of our partners. While there is a certain aspect of "stretch" in some targets, we are committed to identifying targets that are realistic and challenging and that move results in the right direction.
This is our fourth year of performance planning. In a number of cases, we have improved our ability to define measures and in some cases, we have developed entirely new measures. New strategies and initiatives have been provided for the replacement measures. We will continue to improve and revise measures with the purpose of improving management and accountability. The budgeted resources support the broad range of ACF goals. A detailed budget linkage table in the appendix displays program activities that have been aggregated or consolidated to support our goals and objectives.
Reader’s Guide
ACF has followed a standardized format provided by the Department of Health and Human Services (DHHS).
Part I provides general information describing the role of ACF in program implementation, coordination and planning and explains how our goals, targets and levels of performance support the mission and long-term goals. This section includes the context for performance measurement including the mission and long term goals, description of the organization, programs and strategies supporting the four strategic goals, description of partnerships and a brief summary of the FY 2000 performance report including performance success and challenges.
Part II includes the FY 2002 plan and the FY 2000 report covering fourteen programs with the accompanying measures and targets under the appropriate ACF goals and objectives. Each program section includes a narrative description providing the context, legislative intent and broad program goals; program activities, strategies and resources; program coordination, partnerships and cross-cutting issues; and program wide performance and data issues. This section also includes a summary table with FY 1999 -- 2002 targets and performance information for the baseline year. The total program funding reflects the dollars in the President’s FY 2002 Budget and appropriated funds (aggregated by program area) for FY 2001, 2000 and 1999. See Detailed Budget Linkage Table in Appendix A.6 for line items included in each program total. This section is followed by a presentation of performance measures for FY 2002 and the final measures for FY 2001.
The Appendices include sections on ACF’s approach to performance measurement; changes and improvements over the previous year; linkage to the DHHS’ strategic plan; itemization of new data reported for FY 1999 and FY 2000; status of FY 2000 data and detailed changes between the FY 2001 plan and the revised final FY 2001 plan. The appendices also include sections on a variety of critical performance measurement linkages, e.g., information technology, cost accounting, program evaluation and budget.
Highlights of Accomplishments
1. We helped to improve the economic independence of low-income families.
Welfare caseloads have fallen to historic new lows; they are at their lowest level since 1965, at 2.1 percent of the population as of June 2000, based on the monthly average.
In 1996, a comprehensive, bipartisan welfare reform law, the Personal Responsibility and Work Opportunity Reconciliation Act, dramatically changed the nation's welfare system into one that requires work in exchange for time-limited assistance. States, Tribes, and Territories receive block grants from ACF under the Temporary Assistance to Needy Families (TANF) program to cover benefits, administrative expenses, and services.
The States, Tribes and Territories have great flexibility to design and implement programs to move clients from welfare to work, including eligibility requirements, benefit levels, and services provided, as long as they are consistent with the purposes of the program.
One of the purposes is to encourage the formation and maintenance of two-parent families. Of the 38 States, D.C. and Guam with two-parent family programs, 28 States met the FY 1999 target rate for work participation of two-parent families. The legislation established the two-parent participation rate at 75% for FY 1998 and 90 percent for FY 1999 and subsequent years. States have the option to move their two-parent cases into a separate State program and thus avoid the two-parent work participation requirements. While some States have exercised this option, the statutory two-parent participation target of 90 percent remains a rigorous standard.
|
Performance Measure |
Target |
Actual |
|
All States meet the TANF two parent families work participation rates: Two parent families rate=90% work participation |
FY 00: 100% of States |
FY 99: 74% |
In December 2000, DHHS awarded $200 million in bonuses to 28 states with the best records for FY 1999 (the most recent year for which data is available) in moving parents on welfare into jobs and assuring their success in the workforce. According to reports filed by the 48 States and the District of Columbia competing for the bonus, more than 1.2 million parents on welfare went to work in the period between Oct. 1, 1998, and Sept. 30, 1999. Overall, 43 percent of welfare recipients entered the work force in 1999 in comparison to 39 percent in 1998. Retention rates in FY 1999 were also high: of those who obtained jobs, 77 percent were still working in the next quarter. The States also reported an average increase in earnings of 22 percent from $2,114 in the first quarter of employment to $2,578 in the third quarter for FY 1999. In FY 1998, States reported an average increase of 24 percent.
The challenges for TANF will continue in four areas: reaching all families, moving families into work and promoting success at work, transforming the welfare office, and maintaining the investment. ACF continues to implement a wide range of projects to help the States produce the desired outcomes, such as training, technical assistance and sharing of best practices, and sponsoring research.
2. We increased parental involvement and financial support of non-custodial parents in the lives of their children.
The most recent census data show that, in the spring of 1998, 14 million families with children had a parent living elsewhere. These custodial parent families, of which 85 percent were headed by women and 15 percent by men, comprised one fourth of all families with their own, never married children under 21. Of the 14 million custodial parent families, only 7.9 million (56 percent) of the custodial parents had awards or agreements for child support.
To ensure that parents support their children, ACF partners extensively with a range of Federal, State, and local entities and provides funding and technical assistance for identifying parents and assets of non-custodial parents who have not supported their children.
As of January 31, 2001, 52 States and Territories submitted data requests to the Federal Case Registry, which locates absent parents across State lines. The FCR contains 15.5 million child support cases. When absent parents are found, ACF promotes State use of the IRS tax refund and administrative offsets for child support. As part of the total $17.9 billion collected for child support in FY 2000, a record $1.4 billion in delinquent child support was collected in calendar year 2000 using the tax refund and administrative offset, representing a 100 percent increase since 1992. More than 1.42 million families benefited from these collections.
|
Performance Measure |
Target |
Actual |
|
Increase child support collections |
FY 2000: $20.8B |
FY 00: $17.9 |
As of January 31, 2001, 52 States and 146 agencies are reporting data to the National Directory of New Hires, another tool for identifying absent parents. During FY 2000 more than 690 million records were posted there that matched child support orders to employment records with a value in excess of $3 billion. In addition, to match delinquent parents with financial records, ACF is operating the new multi-State financial institution data match system and is working with States to implement the in-State financial institution data match system.
3. We continued to promote access to quality child care services to help low-income working parents and their children.
In order to break the cycle of poverty and dependency, it is essential to focus on both the parents and the next generation. Parents are more likely to seek employment and maintain jobs if they have access to and confidence in their child care arrangements. According to new State-reported statistics for FY 1999, 1.8 million children in low-income families are receiving child-care subsidies through the Federal Child Care and Development Fund (CCDF) on an average monthly basis. This is an increase from the 1.5 million children served in 1998. A continuing challenge is to reach the estimated remaining 88 percent of the 15 million children who are eligible for child care subsidies under Federal rules.
The quality of child care affects the health and safety, as well as the cognitive, emotional, and social development of children. The National Institute for Child Health and Human Development (NICHD) study of early child care, When Child Care Classrooms Meet Recommended Guidelines for Quality (1998), shows that children attending centers meeting professional standards for quality score higher on school-readiness and language tests and have fewer behavioral problems than their peers in centers not meeting such standards.
ACF provides Federal funds through CCDF to States, Territories and Tribes and works with State administrators, professional groups, service providers, and others to promote quality child care. States are required to spend at least four percent of Federal CCDF funds to improve the quality of child care and offer additional services to parents. In addition, funds are earmarked for resource and referral services and school-age care, infant and toddler care, and additional quality improvement activities. States are continuing to expand the innovative ways to improve quality. As an example, several States have already implemented, or are implementing, programs of tiered licensing based on the quality of care.
Based on the combined data of independent national organizations who have information about provider accreditation and certification, there were 9,535 accredited child care facilities nationwide in FY 2000 (reported as of November 2000). The FY 2000 number of accredited facilities will be used as the baseline for tracking future improvements.
On August 30, 2000, DHHS issued final regulations to implement High Performance Bonuses (HPB) under the TANF Program. These regulations included a child care HPB to reward States that effectively support working families with child care assistance.
4. We improved the healthy development and learning readiness of preschool children.
Head Start is a national program that provides comprehensive developmental education, health, mental health, nutrition, and social services for America’s low-income, preschool children ages three to five and their families. The primary goal of Head Start is to promote the social competence and school readiness of low-income children. 1,525 community-based organizations develop unique and innovative programs. In 2000, there were 18,000 centers and 45,000 classrooms, serving 857,664 children.
Head Start children have been found to be ready for school, with the cognitive and social skills that indicate readiness to learn more in kindergarten. For example, in an age-appropriate assessment of word knowledge, the percentage of children scoring close to or above the national mean increased from only one in four when they started the program in the fall to more than one in three in the spring -- nearly a 40% increase.
As in child care, Head Start children experience better outcomes when they have good classroom quality. Observed classroom quality is good on average with no classrooms scoring below a minimum standard of quality. An element of that quality is the qualification of the teacher. For Head Start, that means classroom teachers who have a degree in early childhood education (ECE), a child development associate credential, a State-awarded preschool certificate, a degree in a field related to ECE plus a State-awarded certificate or who are in CDA training and have been given a 180-day waiver, consistent with the provisions of Section 648A(a)(1) of the Head Start Act.
|
Performance Measure |
Target |
Actual |
|
Increase the number of classroom teachers with appropriate education for Head Start |
FY 00: 100% |
FY 00: 94% |
The target for FY 2000 established in the legislation for qualified teaching staff was 100%; the actual was 94%. This shortfall is due to a combination of staff turnover and/or limited access to training and credentialing opportunities in certain areas of the country. In partnership with institutions of higher education, Head Start is working to ensure that a majority of teachers obtain associate’s or bachelor’s degrees in early childhood education over the next few years.
5. We increased the safety and security of children and youth.
ACF funds a number of programs that focus on preventing maltreatment of children in troubled families, protecting children from abuse, and finding permanent placements for those who cannot safely return to their homes. Programs such as Foster Care, Adoption Assistance, and Independent Living provide stable environments for those children who cannot remain safely in their homes, assuring the child's safety and well-being while their parents attempt to resolve the problems that led to the out-of-home placement. When the family cannot be reunified, foster care provides a stable environment until the child can be placed permanently with an adoptive family. Adoption Assistance funds are available for a one-time payment for the costs of adopting a child as well as for monthly subsidies to adoptive families for care of the child.
The Adoption Incentives program was enacted into law by the Adoption and Safe Families Act of 1997. The passage of this incentive program along with State, local and private initiatives focusing attention on the needs of children in foster care awaiting permanent adoptive families, are resulting in unprecedented increases in the number of children adopted from foster care.
|
Performance Measure |
Target |
Actual |
|
Increase the number of adoptions. |
FY 00: 46,000 |
FY 99: 46,000 |
.
Under the law, States may receive incentive funds for each adoption finalized in a fiscal year that exceeds the established baseline number of adoptions. ACF has undertaken a number of activities designed to improve overall performance in child welfare. On January 25, 2000, HHS published a final rule in the Federal Register to establish new approaches to monitoring State child welfare programs. The new rule plays an important role in improving services to, and outcomes for, abused and neglected children, children in foster care, and children awaiting adoptive families. It promotes increased safety for children who are maltreated; quicker movement to permanent homes and families for children in foster care; and enhanced well-being for families served by State agencies.
Performance Measures
ACF continues to make improvements in the performance measurement of its programs. For FY 2000, all ACF programs except the Social Services Block Grant program have performance measures. (The Assets for Independence Program was added in the FY 2001 plan.) As ACF continues to gain experience in performance measurement, measures are being refined, added, dropped and replaced. As of this submission, we are able to report FY 1999 data on forty-five of the forty-seven measures. As of March 2001, we are able to report on sixteen of the fifty-one FY 2000 targets. Most of the measures in our plan rely on State data systems; final data are available nine to twelve months after the end of the fiscal year. Missing FY 2000 data will be reported in subsequent performance reports as they become available.
Many FY 1999 measures have been replaced and targets adjusted in FY 2001 and FY 2002. In the individual program summary sections, there is a fuller explanation of the difference between targets and actual achievements. As more trend data are collected, ACF will be better able to evaluate program strategies and adjust future performance targets.
The FY 2002 performance plan has sixty-eight measures. The Individual Development Accounts program is the only program still lacking performance measures. Additionally, ACF has a number of new initiatives that will require further development and discussions with potential partners before measures or targets can be identified.
Part I: Agency Context For Performance Measurement
1.1 Agency mission and long term goals
The Administration for Children and Families (ACF) and its partners--other Federal agencies, State, Territorial local, and Tribal governments, and the private sector--provide national leadership and create opportunities for low-income, disadvantaged families and individuals to lead economically and socially productive lives, for children to develop into healthy adults, and for communities to become more prosperous and supportive of their members. ACF oversees and finances a broad range of programs for children and families, including Native Americans, persons with developmental disabilities, refugees, and legalized aliens, to help them develop and grow toward a more independent, self-reliant life. These programs carried out by State, Territorial, county, city, and Tribal governments, and public and private local agencies, are designed to promote stability, economic security, responsibility and self-sufficiency.
Some ACF programs assist families in financial crisis, emphasizing short-term financial assistance along with assistance in obtaining and maintaining employment. Programs for children and youth focus on those with special problems, including children of low-income families, abused and neglected children, those in institutions or requiring adoption or foster family services, runaway youth, children with disabilities, migrant children, and Native American children. ACF promotes the development of comprehensive, integrated community and home-based service delivery where possible. ACF advises the Secretary on issues pertaining to children and families, including Native Americans, people with developmental disabilities, refugees and legalized aliens.
ACF coordinates development and implementation of family-centered strategies, policies, and linkages among its programs with other programs serving children and families. Our efforts with partners enable families to avoid dependency or move from welfare to work through employment, education, training and quality child care services, coupled with short-term financial aid. ACF enforces child support and provides community development resources and other supports for low income-working families.
Investments in sound growth and development for children, particularly those in low-income families, are basic to productive adulthood and citizenship. Early Head Start, Head Start, and quality child care programs for low-income children are essential to good health, early development and school readiness; before and after-school child care provide high quality programming and support for working families; and youth development programs provide positive growth opportunities for young people.
Communities provide the context within which families may function well or poorly. ACF, along with numerous public and private partners, is committed to economic development, linking community development strategies with comprehensive "people development" strategies to strengthen communities as a positive factor in the lives of residents.
1.2 Organization, Programs, Operations, Strategies and Resources
The Administration for Children and Families is responsible for twenty-two legislative programs (which authorize more than sixty different programs) distributed among thirty-five budget activities. The FY 2002 plan combines these into fourteen major program areas. The Assets for Independence Demonstration program was first included in the FY 2001 plan. (The consolidation and aggregation scheme and the linkage to the Budget are described in Section A.6 of the Appendix.)
The operations of these programs are carried out through central office headquarters staff and through ten regional offices, organized into five major hubs. Providing nearly $45 billion in grants to governmental jurisdictions and nonprofit organizations and technical assistance and oversight delivered by approximately 1500 FTEs, ACF enables its partners to achieve results in the goals and strategies listed below. (Specific operational activities are discussed under each program’s performance planning section, which includes references to budget and other resource management documents.)
ACF’s GPRA performance plan addresses four major agency goals with ten strategic objectives. There has been a concerted effort to focus on program outcomes that have meaning at the State and local level. In many instances, programs have deliberately set performance targets high, encouraging both ACF employees and partners to strive for higher achievements. ACF has purposely moved away from developing a measurement system that includes products, services and processes (inputs and outputs) and has embraced a measurement system that emphasizes results. This shift has been central to creating a dynamic collaboration with our partners, fostering joint accountability and allowing for crosscutting coordination among programs to improve the lives of families and children.
Adopting a results orientation has allowed ACF to complete a cultural transformation in the way we think about program outcomes. Although ACF does not focus on process measures in the annual performance plan, there is a process in place which requires program managers to describe and report on operational strategies, activities, initiatives and management improvement efforts that will be undertaken to accomplish program results. Following is a description of sample strategies and major management improvement efforts that ACF has undertaken to improve overall performance of programs including activities that support the efforts of our partners--States, Tribes, and Territories, and local community organizations-- to achieve these goals and objectives. (Many of these strategies are repeated under the individual program sections.) Because the ability to achieve any and all results identified in this plan depends on the commitment and combined efforts of both ACF and our partners, these activities reflect a true and bold partnership.
Strategic Goal 1: Increase economic independence and productivity for families.
Examples of operational strategies and processes that are critical to reaching this goal include:
Working in partnership with States, ACF provides resources and tools to increase parental responsibility through the Child Support Enforcement program. Examples include:
Strategic Goal 2: Improve healthy development, safety and well being of children and youth.
In the area of child care, ACF is focusing on systems development (with particular emphasis on helping States meet requirements for reporting); consumer education; assisting States in developing inclusion initiatives (e.g., for children with disabilities); and providing guidance on building successful linkages between child care programs and programs such as health services, early childhood education and Head Start.
Examples of key strategies include:
ACF’s improvement efforts for the Head Start program include training and technical assistance to assist local projects in meeting the Head Start program performance standards and in maintaining and improving the quality of local programs; research, demonstration, and evaluation activities to test innovative program models and assess program effectiveness; and the conduct of required monitoring activities.
Examples of key strategies for maintaining and improving the program quality and increasing full-day, full-year Head Start services include:
ACF funds a number of programs that focus on preventing maltreatment of children in troubled families, protecting children from abuse, and finding permanent placements for those who cannot safely return to their homes. Examples of key strategies in support of "increasing safety, permanency, and well being of children and youth" include:
Strategic Goal 3: Increase the health and prosperity of communities and Tribes
Agency investments to meet this goal are focused on improving program performance and outcomes at the State, Tribal and local levels. Key resources designated for training, technical assistance, planning, evaluation and data collection will continue to be awarded to States, Tribes, Territories and localities to accomplish this objective.
Examples of strategies include:
Strategic Goal 4: Build a results-oriented organization
ACF has two key strategies in place for the next five years to (1) improve and expand our capacity to provide high quality, cost-effective and efficient services to meet customer needs and expectations and (2) use state-of-the-art information technology to improve management and data systems. Initiatives underway to accomplish these strategies include:
1.3 Partnerships and coordination
ACF’s programs are administered in a complex partnership environment in which varying Federal, State, local, non-profit and community-based funding sources and programs develop and carry out programs, deliver services and strive to attain goals. The relationships, funding mechanisms and degrees of autonomy vary from program to program. A primary challenge is to collaborate with partners in crafting effective policies and programs that satisfy mutually agreed-upon objectives. The broad goals of these diverse jurisdictions and organizations are similar to those of ACF, although State and local programs may differ on specific targets and outcomes relevant to the particular needs of the population groups and communities they serve.
States and Local Organizations: ACF programs have worked intensively with their partners and have made substantial progress in recent years towards a measurable results framework with performance measures and outcomes for operating programs. Results-oriented partnership agreements and targets have been negotiated with individual States. Each program has developed an individualized process for engaging partners in goal setting and definition of measures and targets that are meaningful and useful at the State and local community level. For example, the TANF program undertook a legislatively-mandated, partner-oriented process to develop the "high performance bonus." The child support program developed with States a national strategic plan, with indicators and targets. The refugee program involved both State refugee programs and community-based service organizations in the development of measures and targets. In some programs, such as child care, which were new but had no mandated process like TANF, a preliminary set of proxy measures was developed for the first GPRA planning years, while the program undertook a consensus-building process with the partnership constituencies.
Collaboration with Federal Partners: Across DHHS, a large number of programs share related objectives. Many DHHS programs also share related goals and responsibilities with other Federal agencies. Therefore, both internal and external coordination is necessary to administer programs effectively. Interagency consultation has taken place across programs within ACF, (e.g., child care and Head Start, child support and TANF) and within DHHS (e.g., between TANF and Medicaid) through seminars and forums convened by the Office of the Assistant Secretary for Management and Budget (ASMB) and the Office of the Assistant Secretary for Planning and Evaluation (ASPE). ACF programs provide outreach for the Child Health Insurance Program, which is administered by the Health Care Financing Administration (HCFA). Child care and Head Start coordinate with the Health Resources and Services Administration’s (HRSA) Maternal and Child Health program. Such coordination at the implementation and delivery level will produce significant results, even if strict measurements are not practical.
ACF has been an active participant in cross-program efforts to develop broader indicators of child well-being, e.g., Trends in the Well-being of America’s Children and Youth; America’s Children: Key National Indicators of Well-being; Healthy People 2010 and the Children’s Indicators Consortium study. ACF is committed to working collaboratively with its partners in the refinement of these broader performance measures and the identification of annual performance targets.
It has been challenging to identify cross-cutting performance measures within ACF. Program data systems are operated by a diversity of grantee partners serving distinct populations. However, ACF has created networks, workgroups, and collaborative initiatives and events that cut across program boundaries and make major contributions to GPRA planning. For example, ACF has measures that link child care and Head Start, and Head Start with health outcomes. Additionally, ACF’s Administration on Developmental Disabilities has GPRA measures that relate to housing, health services, employment and education. The Family Violence Prevention program has measures that focus on Tribes and the National Domestic Violence Hotline.
Given that ACF measures have been developed in collaboration with partners, the consultation process outside of ACF has been extensive, though more so with ACF’s program partners, such as States and grantees, than with other Federal agencies. ACF works closely with Federal Departments such as Labor, Treasury, Housing and Urban Development, Education and Transportation in implementing, operating and improving welfare reform, early child development, child care, child support, and other programs. Consultation with Federal agencies outside of DHHS on specific GPRA performance plan issues has not been a formal or rigid process. Program-specific data and measurement issues, as well as differing statutes and populations served, make identical performance measures impractical. However, ACF has found that intensive consultation and coordination on program design and objectives provide a climate for close alignment among programs with similar goals. Performance measurement issues are central to cross-agency discussions, e.g., identifying State unemployment records as a data source for TANF measures. There has been extensive programmatic collaboration, including TANF and welfare-to-work grants with the Department of Labor; child care and Head Start with the Department of Education; and child support enforcement with the Departments of Justice, Treasury and Defense. These collaborations have helped develop results-oriented strategies that contribute to the success of performance goals.
1.4 Summary FY 2000 performance report: accountability through performance measurement
ACF continues to make improvements in the performance measurement for its programs. For FY 2000, all ACF programs except the Social Services Block Grant program have performance measures. The number of measures and targets has increased from forty-seven measures in FY 1999 to fifty-three measures in FY 2000. As ACF continues to gain experience in performance measurement, measures are being refined, added, dropped and replaced. ACF reported preliminary data for 17% and final data for 32% of the FY 1999 measures in the FY 2001 Congressional Justification. As of this submission, we are able to report FY 1999 data on forty five of the forty-seven measures. (See Appendix A-4 for FY 1999 performance data available that were previously omitted in the FY 1999 report). We still lack data for two FY 1999 CSBG measures.
The table below illustrates ACF GPRA performance progress for FY 1999. This first year of our performance measurement program, ACF reported a substantial number of differences between targeted and actual performance. As we continue to work with our partners, many of our program measures and targets are being refined or revised.
STATUS OF ACF FY 1999 PERFORMANCE MEASURES
|
Program |
# of Measures |
99 Data Not Available |
# of measures where targets were achieved or exceeded |
# of measures where targets were not achieved |
|
TANF |
2 |
1 |
1 | |
|
DD |
6 |
3 |
3 | |
|
ORR |
6 |
3 |
3 | |
|
SSBG |
0 |
|||
|
OCSE |
5 |
2 |
3 | |
|
CHILDCARE |
0 |
|||
|
HEADSTART |
6 |
2 |
4 | |
|
CHILD WELFARE |
9 |
1 |
8 | |
|
YOUTH |
4 |
1 |
3 | |
|
CSBG |
2 |
2 |
||
|
DV |
1 |
1 |
||
|
LIHEAP |
2 |
2 | ||
|
ANA |
2 |
2 |
||
|
ADMIN |
2 |
1 |
1 | |
|
TOTAL |
47 |
2 |
17 |
28 |
The reader will note that many FY 1999 measures have been replaced and targets adjusted in more recently submitted performance plans, i.e., FY 2001 and FY 2002. The individual program summary sections explain the difference between targets and actual achievements. As more trend data are collected, ACF will be better able to evaluate program strategies and adjust future performance targets.
STATUS OF ACF FY 2000 PERFORMANCE MEASURES
|
Program |
# of Measures |
2000 Data Not Available |
# of measures where targets were achieved or exceeded |
# of measures where targets were not achieved |
|
TANF |
5 |
5 |
|
|
|
DD |
6 |
1 |
3 |
2 |
|
ORR |
6 |
6 |
|
|
|
SSBG |
0 |
0 |
|
|
|
OCSE |
5 |
5 |
|
|
|
CHILDCARE |
2 |
2 |
|
|
|
HEADSTART |
5 |
0 |
1 |
4 |
|
CHILD WELFARE |
9 |
8 |
1 |
|
|
YOUTH |
4 |
4 |
|
|
|
CSBG |
2 |
2 |
|
|
|
DV |
1 |
0 |
1 |
|
|
LIHEAP |
2 |
0 |
2 |
|
|
ANA |
2 |
2 |
|
|
|
ADMIN |
2 |
0 |
1 |
1 |
|
TOTAL |
51 |
35 |
9 |
7 |
As of March 2001, we are able to report on sixteen of the fifty-one FY 2000 targets. Most of the measures in our plan rely on State data systems; final data are available nine to twelve months after the end of the fiscal year. Missing FY 2000 data will be included in subsequent performance reports as they become available.
Performance Commitment: GPRA has become an integral part of the everyday operation of the agency. ACF has been managing toward results since the early 1990’s. In 1995, it instituted "Achieving Success: Trends and Targets," an annual report on a number of critical program measures which included goals for major programs, identified data sources and provided initial baselines and trend data later used with partners at the State and local community level in identifying achievable targets. This report, first released in FY 1996 and updated annually through FY 1998, was part of a continuing commitment to share progress with partners, stakeholders, customers and the general public. Although many of these measures and targets have changed as a result of recent legislation and the creation of new programs, this summary data proved useful in assessing past performance.
ACF’s leadership has made a commitment toward "stretch goals" to encourage programs towards measurably higher achievement, within realistic bounds. As this effort is still in its early stages across government, continued experience should improve the relationship between planned targets and actual results. In a few programs, such as TANF and child support, goal achievement is linked by program statute to incentives and sanctions. In these cases, the process has been driven by a concern for realistic measures. Where an incentives system is not a factor, programs have been encouraged to identify more ambitious targets with the understanding that shortfalls in achievement will be informative for assessing whether the target has been set too aggressively or what corrective actions should be taken.
Summary of Performance Success: ACF’s performance measures include incentives and increased expectations for single parents to gain employment; initiatives that ensure that children receive the support due from an absent parent; incentives to States to provide necessary supports to families to sustain their participation in the workforce and to provide quality child care; and efforts to find adoptive homes for children who need them. As a result, children and families are achieving greater family stability and economic security.
In 1997, seven priority results were selected from the performance plan to serve as a framework for articulating our mission-critical objectives across organizational boundaries and focusing work to achieve outcomes. These priority results included future-oriented, outcome-driven statements that challenged ACF staff to innovate and collaborate in seven areas: welfare reform, child support, child care, infants and toddlers, Head Start, child welfare and increasing our capacity to work with our partners. These priority results provided senior staff with targeted opportunities to collaborate on a number of selected mission-critical cross-cutting activities.
In FY 1999, ACF launched a performance-based work planning system that incorporated the collective and individual responsibilities of ACF's leadership team to track agency-wide results. This work planning system linked each senior executive's performance directly to the seven priority areas accomplished under the work plans. The Priority Work Plans (also called Results Maps) are based on the outcomes identified in the performance plan for each priority area. ACF executives met as a group and with their staffs to refine targets, strategies and activities and identified clear, distinct roles and responsibilities required for effective accomplishment of each priority result. The Priority Work Plans (Results Maps) have been an invaluable tool for linking operational plans more closely with specific strategies, outcomes and results. In October 2000, three additional priority areas (youth, Tribal programs and domestic violence) were identified.
Our focus on crosscutting program strategies with increased emphasis on performance has produced measurable improvements, such as:
Rewarding Performance: The recent legislative environment has supported a focus on results, in part through enactment of statutory bonus provisions based on performance. For example, the Child Support Performance and Incentive Act of 1998 put in place a performance-based incentive system that rewards States for their performance on five measures: paternity establishment, orders obtained, collection of current support, collection of past due support and cost effectiveness. In addition, the Adoption and Safe Families Act (ASFA) created the Adoption Incentive program, under which States receive incentive funds tied to their success in increasing the number of children adopted from the foster care system. The TANF statute contains a High Performance Bonus (HPB) provision which rewards States that are most successful in achieving the purposes of the TANF program. Further, the TANF statute rewards the five States with the largest decrease in their ratio of non-marital births to total births, provided that these States also show a decrease in their abortion rate relative to 1995.
Focus on Results: In FY 2000, ACF announced a number of awards to programs and partners which exemplify ACF’s focus on results and pursuit of excellence. In February 2000, the Office of Child Support Enforcement received the Hammer Award (given to government agencies that demonstrate innovation) for its success in collecting delinquent child support payments through the National Directory of New Hires. Federal and State child support enforcement programs set new records in nationwide collections in fiscal year 2000, reaching $17.9 billion, more than doubling the amount collected in 1992. The DHHS announced the third annual Adoption 2002 Excellence awards to individuals and organizations for giving abandoned, neglected, or abused children a loving family and a safe and nurturing home. These awards included unprecedented financial incentives to States to increase adoptions, put the safety of children first in placement decisions and set swifter time frames for permanent placement decisions. In December 2000, the TANF program awarded the second high performance bonuses totaling $200 million to the 28 States with the best records in moving parents on welfare into jobs and in sustaining their success in the workforce.
ACF selected four core measures as High Impact Agency goals to be achieved in FY 2000, part of a government-wide effort to focus on results. The establishment of these goals has more intensively focused our efforts with partners and has proven to be an incentive for improving State management and administrative data systems. These four measures included the following target information in the final status report:
For FY 1998, 46 states reported 1.3 million job entries, substantially exceeding the goal in only one year; and in FY 1999, 48 States and the District of Columbia reported 1.2 million job entries. (completed)
$17.9 billion in collections were received in total child support for FY 2000. (completed)
Adoptions increased from 28,000 in FY 1996 to 46,000 in FY 1999. (completed)
Thirty-seven systems were replaced by a single comprehensive system of electronic processing. (completed)
Summary of performance challenges: The diversity of programs, target populations, levels of government, and range of partners make efforts to establish and achieve goals and outcome measures extremely challenging. While ACF changed the way it measures the success of programs, it also implemented a major shift in the way it does business with partners. A changing role with States and grantees allowed ACF to re-examine the culture of the agency in ways that accelerated major reforms in many programs. In order to focus on results, ACF continues to work on correcting performance information and strengthening partnerships with States and grantees by developing agreed-upon goals, measures and targets. Creating a mature set of performance goals and data collection strategies is a high priority. It takes considerable time to bring partners to the table, develop shared priorities and goals, address weaknesses in data collection and determine an optimum set of measures.
Data Issues: ACF relies on State administrative data systems for performance reporting, because States and local community organizations administer most of our programs. For many programs, final reports are due ninety to 120 days after the fiscal year ends. In some cases, for example, in TANF where earnings gains are measured over a 9-month period after an individual obtains a job, the period is even longer. This time lag in receiving and validating data reports on actual achievements makes it difficult to provide a comprehensive summary of FY 2000 performance until late in FY 2001. The lack of readily available information and the restrictions on data collection inhibit performance measurement. Additionally, many of our programs rely on voluntary data reports, e.g., LIHEAP, Child Care, TANF, CSBG, and ADD. Fluctuations in the number of States and grantees reporting and the flexibility allowed in selecting measures continue to make the collection of consistent, reliable and verifiable data extremely challenging. Detailed information on program-specific data issues and requirements for data validation and verification are addressed in each of the fourteen program sections. ACF is currently working with the DHHS Data Council to assess unmet data needs for our major programs. ACF is committed to making additional investments in data collection and information systems.
PART II: PROGRAM PLANNING AND ASSESSMENT
ACF's program efforts are carried out through partnership with the State, Territorial, local and Tribal governments and non-profit/private sector grantees that implement its programs. Social research, demonstration and evaluation programs are directed at developing reliable knowledge to support program policies, learning about effects on children and families, identifying paths to program quality improvement, and discovering better ways to conduct technical assistance, disseminate information, and deliver effective services.
Performance goals have been stated under the program sections throughout the eight strategic program objectives and two management improvement objectives in this plan. This approach continues to provide a framework for individual programs and program activities to collaborate and direct their efforts to achieve ACF-wide crosscutting program goals. This framework enables ACF partners in State, Territorial, Tribal and local governments and nonprofit and private agencies to use the various program resources within ACF to focus on early childhood enrichment and economic and social well-being and productivity of families. "Data sources" under the various measures refer to OMB-approved program data collection instruments. The programs that support each of the goals and objectives are listed below:
Strategic Goal 1: Increase economic independence and productivity for families
Temporary Assistance for Needy Families
Developmental Disabilities:
Employment
Refugee Resettlement
Social Services Block
Grant
Developmental Disabilities: Housing
Assets for Independence
Child Support
Child Care: Affordability
Strategic Goal 2: Improve healthy development, safety and well-being of children and youth
Child Care: Quality
Head Start
Head Start: Health Status
Child Welfare
Developmental Disabilities: Education
Developmental
Disabilities: Health
Youth Programs
Strategic Goal 3: Increase the health and prosperity of communities and Tribes
Community Services Block Grant
Family Violence Prevention
Program
Low-Income Home Energy Assistance
Native Americans
Programs
Strategic Goal 4: Build a results-oriented organization
In most cases, baselines have been established in either FY 1998 or FY 1999 for the FY 2002 measures. Because of the time lag in receiving data from States and localities for some measures in the FY 2000 report, ACF has not completed its review and verification for a number of measures. In Section A.6 of the Appendix, a budget table has been provided in which performance goals and measures for each of the ten strategic objectives are included. The relationship between these goals and the mission of DHHS as reflected in the DHHS Strategic Plan is shown in the table in Section A.3 of the Appendix.
Program research and evaluations focus on measuring and understanding the impacts of ACF programs on children and families. They provide information to design and improve the results of those programs, and inform performance measurement methodologies. (A table listing selected evaluations is included in Section A.6 of the Appendix.)
Because ACF is interested in trends of improvement over time, measured against a carefully-chosen starting point, many (though not all) of the baselines in the following section are likely to remain the same in subsequent annual editions of this plan, rather than rolling forward to a new baseline year. Such baseline stability is important if, for example, the baseline year has been selected because it indicates with reliable data when a new program initiative, statute or rule begins to have a measurable effect.
|
INCREASE ECONOMIC INDEPENDENCE AND PRODUCTIVITY FOR FAMILIES |
Rationale
Economic independence and self-sufficiency are central to families being able to lead stable and productive lives. Achieving this goal requires assisting welfare-dependent individuals and recently-arrived refugees to obtain sustained employment through appropriate work requirements and time-limited assistance. Strategies to increase earnings and income, through activities such as child support enforcement, and to support work by providing essential services, such as affordable child care, are critical to assuring that children are not living in poverty and that they are adequately cared for while their parent(s) are working.
The job market, economic cycles, changing demographics, and the mores of family formation and child bearing (e.g., rates of divorce, which create the need for child support or the incidence of out-of-wedlock teen pregnancies, which increase the caseloads of hard-to-serve welfare recipients) influence outcomes under this goal. Such economic and social factors influence people's ability to find work, meet their families' needs and support obligations, and achieve self-sufficiency.
For nearly all the "economic independence" programs, State welfare reform decisions have had a significant impact on program directions and results. ACF is constantly in dialogue with its partners to learn their objectives and share knowledge about practices that improve results.
The FY 2002 budget includes a request for $64 million to fund a new initiative to promote responsible fatherhood. Of this request, $60 million would fund faith-based and community organizations that help fathers improve their job skills and establish positive relationships with their children and their children’s mothers and promote marriage among parents. The additional $4 million would fund programs through grants, contracts or cooperative agreements that focus on public education and awareness, the use of mass media campaign, development of best practices, research, and technical assistance.
The objectives and major program areas under this goal are:
1. Increase employment
Temporary Assistance for Needy Families
Developmental Disabilities: Employment
Refugee Resettlement
Social Services Block Grant (SSBG)
2. Increase independent living
Developmental Disabilities: Housing
Assets for Independence
3. Increase parental responsibility
Child Support
4. Increase affordable child care
Child Care
|
Approach for the Strategic Objective: Increase employment and economic independence by reducing reliance on public welfare programs, providing job training and encouraging job creation. Focus on the abilities and skills of individuals, enabling them to be more self-sufficient and to pursue jobs in their communities. |
TEMPORARY ASSISTANCE FOR NEEDY FAMILIES
Program Description, Context, Legislative Intent and Broad Program Goals
In 1996, "The Personal Responsibility and Work Opportunity Reconciliation Act of 1996," (PRWORA) was enacted--a comprehensive, bipartisan welfare reform plan that dramatically changed the nation's welfare system into one that requires work in exchange for time-limited assistance. The Temporary Assistance for Needy Families (TANF) program replaced the former Aid to Families with Dependent Children (AFDC) and Job Opportunities and Basic Skills Training (JOBS) programs, ending the Federal entitlement to assistance. In TANF, States and Territories operate programs, and Tribes have the option to run their own programs. States, territories, and Tribes each receive a block grant allocation with a requirement to maintain a historical level of State spending known as maintenance of effort. The block grant covers benefits, administrative expenses, and services. States, Territories, and Tribes determine eligibility and benefit levels and services provided to needy families.
ACF provides leadership to help State and Tribal governments as they design and implement their programs and move clients from welfare to work, while protecting the well-being of children through child care and other services. PRWORA gives States great flexibility to design their TANF programs in ways that promote work, responsibility, and self-sufficiency and strengthen families. Except as expressly provided under the statute, the Federal government may not regulate the conduct of States. States may use TANF funding in any manner "reasonably calculated to accomplish the purposes of TANF." These purposes are: to provide assistance to needy families so that children can be cared for in their own homes; to reduce dependency by promoting job preparation, work and marriage; to prevent out-of-wedlock pregnancies; and to encourage the formation and maintenance of two-parent families.
Changing welfare as we know it has not only meant changing the welfare rules, it has also meant changing the way ACF and State welfare agencies plan and do business. Just as the welfare objective has shifted from income maintenance to work and self-sufficiency, so the way we plan for the welfare program has shifted from oversight of States’ check-producing operations to establishing measures and targets for assessing ACF and our partners' success in achieving our strategic goals. The nation has an enormous stake in this new approach to public assistance. ACF is committed to working with States to promote work, personal responsibility, and self-sufficiency in ways that will strengthen families.
There are four steps that must be completed before we can claim success in reforming the welfare system. These are:
Program Activities, Strategies and Resources
A primary goal of the TANF legislation is to move recipients from welfare to work and self-sufficiency. In addition to providing States with flexibility in program design and funding, Congress established work participation performance standards and created a High Performance Bonus (HPB) incentive system to facilitate the achievement of this goal. PRWORA provides both financial rewards for high performance and significant improvement and also penalties for not meeting the work participation targets. The HPB legislation authorized awards for five years (FY 1999-FY 2003). ACF issued award specifications for FY 1999, FY 2000, and FY 2001 through guidance. The first three years focused only on work measures, i.e., rates of newly-employed recipients, retention rates and earnings gain rates of employed recipients and former recipients. Final rules were published in August 2000 to cover awards for FY 2002 and FY 2003. In addition to the work measures, new measures have been included that promote work and provide assistance to needy families, i.e., participation by low-income working families in the Food Stamp Program, participation in the Medicaid and the State Children’s Health Insurance program after leaving TANF, receipt of child care subsidies, as well as a family formation and stability measure. Although participation in HPB is voluntary, most States are participating. Forty-six States participated in the FY 1999 HPB and $200 million in awards were issued to 27 States. Forty-eight States and the District of Columbia competed for the FY 2000 HPB and $200 million in awards were issued to 28 States in December 2000.
Under PRWORA, $100 million in annual bonuses are to be awarded to as many as five States with the largest reduction in the proportion of out-of-wedlock births to total births. These bonuses are an incentive to advance parental responsibility and encourage the formation of two-parent families. ACF compiled the statistics reported by States and compared the proportion for the most recent two-year period to that for the preceding two-year period. For FY 1999, rankings were based on birth statistics from 1995 and 1996 compared to 1997 and 1998. In order to receive the bonuses, the five States must also show a decrease in their abortion rate between the most recent year and 1995. Awards of $20 million each were given to Alabama, Arizona, the District of Columbia, Illinois and Michigan in September 2000.
ACF selected outcomes that measure State investment and policy choices directed at providing support for individuals to work and succeed at work. Strategic activities were developed to meet these targets including issuing bonuses to reward States for high performance; an aggressive technical assistance approach using contracts and grants; aggressive outreach and collaboration with key Federal and non-Federal partners; review and analysis of State programs and fiscal data to identify emerging trends; promoting and disseminating research results; and publishing regulations. Attention is being given to removing barriers to work for welfare recipients who are victims of domestic violence or have developmental disabilities or serious personal or family problems, such as substance abuse or mental health problems that interfere with their ability to work.
ACF implements a wide range of projects to help States produce the desired outcomes. These projects include:
To accomplish these strategies, ACF is striving to improve its own performance by training our employees in marketing, negotiating, and consulting; using and improving automated technology, databases, and electronic communication; and by implementing team-based work procedures.
Program Coordination, Partnerships and Crosscutting Issues
Extensive coordination is underway throughout DHHS on initiatives concerning welfare and employment. ACF and the Office of the Assistant Secretary for Planning and Evaluation are co-lead agencies. Participating agencies include the Health Care Financing Administration, the Health Resources and Services Administration, the Administration on Aging, the Office of Public Health and Science, the Substance Abuse and Mental Health Administration, the Agency for Health Care Research and Quality, the Centers for Disease Control and Prevention, the National Institutes of Health, the Office for Civil Rights, the Office of the Assistant Secretary for Management and Budget, the Office of the Assistant Secretary for Public Affairs, the Office of Intergovernmental Affairs, and the Office of the Assistant Secretary for Legislation.
In addition to coordinating with DHHS initiatives, ACF will continue to coordinate its efforts with other complementary Federal and national efforts. For example, under the Welfare-to-Work program, jointly administered by DHHS and the Department of Labor (DOL), DOL awarded grants totaling $3 billion to State and local entities in 1998 and 1999. The program requires that at least 70 percent of the Welfare to Work funds be targeted to current and former long-term TANF recipients and their non-custodial equivalents. Up to 30 percent of the funds may be spent on persons at high risk for long-term dependency and may be used for job creation, wage subsidies, on-the-job training, and employment support and follow-up. Under the Consolidated Appropriations Act for FY 2000, the Department of Labor has sole responsibility for financial and participant reporting. The Welfare-to-Work Partnership is a non-partisan non-profit effort created to lead the business community's efforts to help move those on public assistance into jobs in the private sector. DHHS will coordinate these various initiatives in order to ensure the most effective use of resources for those in transition from welfare.
Program-wide Performance
With the primary responsibility for welfare reform lodged in the States, and in a number of cases in counties and cities, ACF’s ability to affect goal achievement is limited. ACF works in partnership with State and local governments toward achieving the goal of increased employment for TANF recipients.
While the overall health of the economy could have a major effect on achieving this goal, traditional business cycles have varying effects across geographic areas and sectors of the economy. Historically, some groups in the labor force (e.g., women who head families, minorities, and women without high school diplomas) are much more vulnerable to unemployment than the population as a whole. Unemployment rates among these groups remain two to three times the overall rate, even during periods of economic recovery.
Employment measures
ACF does not have any FY 2000 performance data to report at this time because States are given up to 11 months to provide data for some measures each quarter. Past performance is not comparable because the performance measures used to track progress in the AFDC program, which was replaced by the TANF program, are substantially different from those ACF established for the TANF program. For example, the JOBS "work participation" measures/standards only applied to about one-half of the AFDC caseload, the activities that counted toward participation were different and the performance standards were less rigorous. In FY 1995, almost all States met the 20 percent all family JOBS participation rate standard. States were less successful with the Unemployed Parent (UP) participation standards under JOBS. The UP participation standards were 50 percent in FY 1995 and 60 percent in FY 1996. Only 24 States met the standard in FY 1995 and 25 States met the UP standard in FY 1996. Since Congress allowed the States to phase in the implementation of the TANF program beginning in FY 1997, ACF does not have AFDC/JOBS performance data for all States for FY 1997.
Congress established the TANF work participation performance targets for FY 1999 through FY 2002. All States met the all-families work participation targets for FY 1998 achieving a national rate of 35 percent (the 1998 target was 30%) and in FY 1999, 38 percent (the 1999 target was 35%). ACF believes that States can continue to meet the higher all-families’ targets in the subsequent years. However, only 29 of 44 States with two-parent family programs met the FY 1998 two-parent target rate of 75 percent and only 28 States of the 36 States, District of Columbia and Guam with two-parent family programs met the FY 1999 two-parent target rate of 90 percent. States have the option to move their two-parent cases into a separate State program thus avoiding the two-parent work participation requirements. Several States exercised this option so there are fewer States with two-parent TANF programs in FY 1999. The statutory two-parent participation target of 90 percent remains a rigorous standard.
The TANF performance measures for job entry, employment retention and employment earnings gain rate were not measures collected under the AFDC program. The AFDC program did collect information on families with earnings. These data indicate an increasing percentage of AFDC/TANF families with earned income. The percentage of TANF families with earnings increased from 9 percent of the caseload in FY 1994 to 28 percent in FY 1999. In FY 1999, there was a 4.2 percentage point increase in the percent of adult TANF recipients who became newly employed (job entry); a decrease of 3.2 percentage points in the percent of adult TANF recipients employed in one quarter who continued to be employed in the subsequent quarter (employment retention) and a decrease of 2 percentage points in the percent rate of earnings gained between the base quarter and the second subsequent quarter (employment earnings gain rate).
We believe that the decline in the job retention and earnings gain rates is, in part, the result of the changing composition of the remaining TANF caseload. The caseload continued to decline between FY 1998 and FY 1999 and there is concern that the remaining TANF recipients are likely to have less job skills and more barriers to employment resulting in less employment stability. We project modest increases in employment targets for FY 2002 discussed in the section Performance Measures for FY 2002 and Final Measures for FY 2001.
One of ACF’s initiatives was to increase self-sufficiency for low-income families by moving one million welfare recipients into new employment by 2000. For FY 1998, 46 States reported 1.3 million job entries, substantially exceeding the goal in only one year. This HPB job entry data exceeded the new employment goal by almost 30 percent. In FY 1999, 49 States reported 1.2 million job entries. Some of these jobs entries may have been filled by individuals who had previously been employed in FY 1998, lost their job and acquired a new job in FY 1999.
Data Issues
There are three data sources for reporting on the proposed performance targets. The first is TANF administrative data. The statute directs the Secretary to collect aggregated data (caseload summaries) and disaggregated data (by individual and family) on the TANF program quarterly. ACF has developed an automated TANF data reporting system to collect this information. This system was modified to collect data under the TANF final rule effective October 1, 1999. The TANF work participation data is also collected through this system. The consistency and validity of this State-reported data is assessed through system edits and consistency checks, special data computation runs, and data trend analysis. Within limited resources, ACF will be assessing the source data for the information supplied by States.
With respect to the employment measures, States have been given the option for the first three years of the HPB to collect this information through their administrative records or State Unemployment Insurance agency wage records (UI) or both. All States are using UI information with some supplementation of administrative record data. ACF conducted a study using data from ten States to assess the viability of using UI wage data for the HPB performance measures. ACF concluded that this database has a high degree of consistency and reliability across States, the costs are reasonable, and there is sufficient technical support to facilitate the data matches.
Under the HPB final rules governing the FY 2002 and FY 2003 bonus awards, we have specified the National Directory of New Hires (NDNH) as the sole data source for the HPB work measures. The NDNH contains UI wage data for all States and Federal employment wage data. States will provide recipient identifying information that will be matched against the NDNH database to obtain employment measurement data.
Summary Table
|
Performance Measures |
Targets |
Actual |
Reference | ||
|
1.1a. All States meet the TANF all-families work participation
rates: |
|
|
| ||
|
1.1b. All States meet the TANF two parent families work participation
rates: |
|
|
Px M-33 | ||
|
1.1c. Maintain the increase (from the baseline year) in the percentage of adult TANF recipients who become newly employed. |
FY 02: 43% |
FY 02: |
Px M-33 | ||
|
1.1d. Maintain the increase (from the baseline year) in the percentage of adult TANF recipients/former recipients employed in one quarter of the year who continue to be employed in the next two consecutive quarters.** |
FY 02: 84% |
FY 02: |
Px M-34 | ||
|
1.1e. Maintain the increase (from the baseline year) in the percentage rate of earnings gained by employed adult TANF recipients/former recipients between a base quarter and the second subsequent quarter. |
FY 02: 28% |
FY 02: |
Px M-34 | ||
|
Ö FY 1999 data that was not available when the FY 1999 report was
submitted with the FY 2001 CJ. | |||||
|
Total Funding (dollars in millions) |
FY 02: $16697.8 |
Bx: budget just. section J | |||
Performance Measures for FY 2002 and Final Measures for FY 2001
ACF has consulted extensively with States and other customers/partners to develop regulations on work participation standards, the HPB, and the TANF data collection system. As noted in the section Program Activities, Strategies and Resources on page 28, a final rule, covering TANF work participation standards and data reporting requirements, was published on April 12, 1999. Final rules governing the FY 2002 and 2003 HPB awards were published August 30, 2000.
A primary goal of the TANF statute is to move recipients from welfare to work and self-sufficiency. These five measures taken together measure State success at achieving that goal. Full success requires not only getting recipients into jobs, but also keeping them in those jobs and increasing their earnings in order to reduce dependency and enable families to support themselves. The TANF data collection provisions limit our ability to require States to collect the longitudinal outcome data reflected in measures 1.1c-e. However, these measures reflect critical performance information necessary for States to effectively manage their programs. Many States were already collecting this kind of information before it was incorporated into the High Performance Bonus (HPB) system. The HPB provides an additional incentive for States to collect and report this information.
ACF views the work participation rates (measures 1.1a-b) as process measures and the other work measures as interim outcome measures. While we have performance data for FY 1998 and FY 1999, the projected performance targets remain somewhat speculative given the changing nature of the TANF population.
Achieving economic independence for many TANF families begins with either direct job search or eliminating barriers to employment, e.g., lack of basic skills, and progresses to acquiring job experiences, a private sector job, increased wages, and eventually self-sufficiency. ACF believes that there are three key elements in this process: getting a job, retaining the job, and increased earnings. Therefore, ACF selected the following measures and performance targets:
1.1a. FY 2001: All States meet the TANF all families work participation rates for FY 2001:
-- All families rate: 45%
FY 2002: All States meet the TANF all families work participation rates for FY 2002.
-- All families rate: 50%
1.1b FY 2001: All States meet the TANF two-parent families work participation rate of 90%.
FY 2002: All States meet the TANF two-parent families work participation rates of 90%.
The work participation rates, measures 1.1a-b, were established by Congress. The statute directs the Secretary to collect aggregated data (caseload summaries) and disaggregated data (by individual and family) on the TANF program quarterly.
1.1c. FY 2001: Increase (from the baseline year) to 43% the adult TANF recipients who become newly employed.
FY 2002: Maintain the increase (from the baseline year) in the percentage of adult TANF recipients who become newly employed.
1.1d. FY 2001: Increase (from the baseline year) to 84% the adult TANF recipients/former recipients employed in one quarter of the year who continue to be employed in the next two consecutive quarters.
FY 2002: Maintain the increase (from the baseline year) in the percentage of adult TANF recipients/former recipients employed in one quarter of the year who continue to be employed in the next two consecutive quarters.
1.1e. FY 2001: Increase (from the baseline year) to 28% the rate of earnings gained by employed adult TANF recipients/former recipients between a base quarter and the second subsequent quarter.
FY 2002: Maintain the increase (from the baseline year) in the percentage rate of earnings gained by employed adult TANF recipients/former recipients between a base quarter and the second subsequent quarter.
Data Sources: see discussion under "Data Issues"
Note: For this rate/measure we look at the earnings of those who are employed in each of the four quarters of the measurement year and determine if they are also employed in the second subsequent quarter. If they are employed in both quarters, we determine the gain in earnings (if any) between the initial quarter and the second subsequent quarter. The sum of these gains in earnings across the four quarters is the numerator. The denominator is the sum of the earnings in each of the four quarters in the measurement year.
The work performance measures 1.1c-e were developed after extensive consultation with the American Public Human Services Association, the National Governors Association, and States as specified in the HPB statute. In FY 1999, ACF modified the work performance goal specifications to reflect percentage increase in performance rather than numeric changes and established modest increases in target levels for FY 1999 through FY 2001 with the FY 2002 target remaining unchanged from the FY 2001 target. These actions were taken for the following reasons. The performance achieved by States in FY 1998 and FY 1999 under the job entry, retention, and earnings gain rate measures (measures 1.1c-e) reflect a major accomplishment. One factor that may explain the increase in job entry rates (measure 1.1c) over the FY 1998 levels is States may have had access to more complete data in the second year of operating TANF. In addition, because there is concern that the remaining TANF population has more barriers to employment, it is not clear that the projected modest increases in performance will be achievable.
DEVELOPMENTAL DISABILITIES (GENERAL)
Program Description, Context, Legislative Intent and Broad Program Goals
There are nearly four million Americans with developmental disabilities. Developmental disabilities are severe, chronic disabilities attributable to mental and/or physical impairment which manifest before age 22 and are likely to continue indefinitely. They result in substantial limitations in three or more of the following areas: self-care, receptive and expressive language, learning, mobility, self-direction, capacity for independent living, and economic self-sufficiency, as well as the continuous need for individually planned and coordinated services.
The major goal of the Developmental Disabilities program is to assist people with developmental disabilities to reach maximum potential through increased independence, productivity, and community integration. ACF’s partnerships with State governments, local communities, and the private sector are comprehensive: prevention, diagnosis, early intervention, therapy, education, training, employment, and community living and leisure opportunities.
In ACF, the Administration on Developmental Disabilities (ADD) and its partners in the developmental disability (DD) community have been participating in the development of the "Roadmap"--six program goals and four program-specific outcome measurement areas. The first goal (employment) is discussed in this section of the GPRA performance plan. Other goals appear in appropriate sections later in this plan.
ACF's DD grantee partners fall into four complementary groups. Each serves individuals with developmental disabilities and their families in a non-duplicating, unique, and interlocking way:
Program Activities, Strategies and Resources
To achieve desired outcomes and meet the Roadmap goals, DD programs and ACF will use approaches consistent with their complementary missions. Therefore, DDCs that assist in developing comprehensive and coordinated service delivery systems through systemic change, capacity building, and advocacy activities will employ strategies that include demonstration of new approaches, outreach training, public education, and informing policy makers. P&As will use strategies that protect the human and legal rights of individuals with developmental disabilities. These include legal, administrative, and other remedies, information and referral, investigating incidents of abuse and neglect, and educating policy makers. UAPs will provide interdisciplinary training for professional and direct care personnel, community services, technical assistance, and will disseminate information and research findings. The PNS program provides ACF with the opportunity to focus funds on emerging areas of concern for individuals with developmental disabilities, their families, the DD program components, and other interested public and private non-profit entities.
Program Coordination, Partnerships and Cross-cutting Issues
To improve and enhance services for children with developmental disabilities and their families, ACF coordinates closely with the Social Security Administration and the Department of Education. Collaboration within DHHS among HCFA, HRSA, and ACF is essential. Regarding employment for working age adults, the same internal partners coordinate with DoL and DoT. In both cases, participation by special committees, such as the President’s Committee on Mental Retardation and the President’s Committee on Employment of People with Disabilities, will enhance the effort. State Medicaid and human service agencies are essential partners, and the public schools and community services networks assist as well. Finally, the private sector has the potential to employ individuals with disabilities, to the ultimate advantage of both employees and employers.
Program-wide Performance
With the primary responsibility for developmental disabilities programs lodged in the States, ACF's ability to affect goal achievement is limited. ACF works in partnership with State-level program entities toward achieving the goals they set.
In FY 2000, all appropriated funding was made available to DD Councils and P&A systems in the States. UAPs are funded, both for core funding and also for Training Initiative Projects. Under the PNS, funding is provided under three priority areas. The three priorities are "Mobilizing for Change/Rapid Deployment of Good Ideas," "Bridging the Digital Divide: Building Content," and "Managing our Program Knowledge through Web Improvement." Additionally, projects were funded under the Family Support program. In FY 2000, ADD set a target to leverage $2.4 million from its Federal partners in support of positive outcomes for people with developmental disabilities in terms of employment, housing, education, health, and community support as a result of ADD intervention. To ensure the quality of programs, ADD has continued to provide technical assistance to its partners.
In FY 2000, the number of adults with developmental disabilities who obtained integrated jobs (measure 1.2a) was below the projected target. DD Councils in 45 States and Territories reported 3,788 integrated jobs as a consequence of their intervention, 60% below the target of 9,517. States, responding to technical assistance provided by ADD and by their peers, revised their methods of data collection resulting in the lower number. For this reason, the baseline year has been revised from FY 1999 to FY 2000. Interventions by DD Councils include promoting job fairs, training job coaches, advocacy to employers to hire more people with developmental disabilities, and creating State-level entities that continue this work on an ongoing basis.
The number of businesses/employers that employ and support people with developmental disabilities (measure 1.2b) missed the target level by a significant margin (similar to the achievement of FY 1999). DD Councils in 37 States and Territories reported 1,324 employers/businesses employing and supporting people with developmental disabilities, less than the target of 4,353. State DD Council interventions included educating employers on the benefits of hiring and issues needed to ensure successful employment. Employers were encouraged to hold job fairs targeted to people with developmental disabilities.
Performance for the dollars leveraged from ADD's Federal partners (measure 1.2c) was met ($2.4 million).
Data Issues
ACF and its DD partners worked together in a consensus-building process to develop a wide range of measures, grouped within agreed-upon categories, that all partners could accept as representative, when taken as a whole, for their programmatic interventions. These numerous measures were incorporated into program reporting instruments to permit national aggregation of future-year targets and past-year actual performance for DD's State-based programs. A few programmatically significant measures were selected for reporting in this performance plan. DD partners in the States are continuing to develop experience with projecting future-year targets and collecting accurate data for past-year performance.
Partners generate both performance targets and data reports. The targets generated by P&As (measure 7.2a) and UAPs (measure 7.3a) are developed in their annual planning process. The targets generated by DDCs (measures 1.2a-b, and 2.1a) are developed for a three-year period and updated annually. The targets for the next triennial report, FY 2001 to 2003, are included in this plan. Data on actual performance for a particular fiscal year are reported in annual program performance reports (PPRs), submitted in January of the following fiscal year. University Affiliated Programs reporting is delayed due to the offset fiscal year for universities.
During the year, ADD achieved a breakthrough in data collection by electronically soliciting annual reports with outcome data from its partners regarding their FY 1999 performance and FY 2000 targets. This greatly facilitated submission and analysis of performance measure data by ADD's geographically dispersed partners. The Electronic Data Submission (EDS) system is now in place and will continue to be used through FY 2002. The system consists of an extranet, using Internet-based technology and password protection. The grantees of ADD submit their reports annually by accessing the Internet, at the following URL: https://extranet.acf.dhhs.gov; where they enter a "Grants Extranet ID" and a password to access their portion of the extranet that contains the necessary data entry forms for their reports. These forms include all the necessary fields for submitting complete reports. Forms completed by a grantee become accessible to reviewers in ADD. When grantees’ reports are approved, they are locked into the ADD Management Information System (MIS). The data in the ADD MIS about ADD grantees and programs is now available to ADD staff through report-generating software and the extranet. Because grantee submissions can be analyzed quickly and accurately, and readily compared with target data, these automated systems enable ADD to more effectively track data and identify anomalies requiring correction by grantees.
States, State and local school systems and the network of related services providers must be able to sustain their commitment if State targets are to be achieved. For example, to meet employment goals (measures 1.2a-b) for working-age adults with developmental disabilities, jobs will need to be available for those who are qualified. This will depend, in large part, on economic conditions in States and localities. (Similar outside influences and constraints apply to health, housing, community support, and education.) Each State is responsible for selecting the performance goals that it will target for a particular year. Therefore, the number of States that project targets and report on performance varies from year to year.
Verification and validation of data will occur through ongoing review and analysis of annual electronic reports, technical assistance site visits, and input from individuals with developmental disabilities, their families and other partners. Interagency agreements and memoranda of understanding will provide the data for the last set of measures, (measure 1.2c) "dollars leveraged".
Various data sources are used to report on program targets and program outcomes, such as annual program performance reports, planning reports, and administrative records. These sources will be tracked through the EDS system. The ADD MIS system based on the results from the EDS will be used to compare targets and actual performance of ADD partners. When anomalies and variations from expected targets occur, ADD will work with individual partners to improve the outcomes reported and gain insight into the reason for an anomaly, both directly and with help from technical assistance contractors. Partners are encouraged to pursue corrective actions to ensure that data are valid.
DEVELOPMENTAL DISABILITIES (EMPLOYMENT)
The DD employment goal is: "Increase entry into and retention of employment for people with developmental disabilities consistent with their interests, abilities, and needs." This goal includes the following outcomes: "Students with developmental disabilities have vocational supports while in school and on the job, receive assistance in identifying and planning careers, and have access to employment and other work experiences including post-secondary opportunities that accommodate students with disabilities. Adults with developmental disabilities have job choices and career opportunities that are integrated, accessible, equitable, and supported. Employers are well informed of the capabilities of individuals with disabilities and about support practices and accommodations."
Summary Table
|
Performance Measures |
Targets |
Actual |
Reference | ||
|
Program Goal: Increase entry into, and retention of, employment for
people with developmental disabilities consistent with their interests,
abilities, and needs. |
|
|
| ||
|
1.2b. Increase the number of businesses/ employers that employ and support people with developmental disabilities as a result of DD program intervention. |
FY 02:1,400 |
FY 02: |
Px M-39 | ||
|
1.2c. Increase from the FY 1999 baseline the dollars leveraged from ADD's Federal partners to support positive outcomes for people with developmental disabilities in terms of employment, housing, education, health, and community support as a result of ADD intervention (dollars in millions). |
FY 02: $2.4 |
FY 02: |
Px M-40 | ||
|
ÖFY
1999 data that was not available when the FY 1999 report was submitted
with the FY 2001 CJ. | |||||
|
Total Funding includes all ADD programs (dollars in
millions) |
FY 02: $133.3 |
Bx: budget just. section H | |||
Performance Measures for FY 2002 and Final Measures for FY 2001
The achievement of the performance targets for measures 1.2a-c is affected by a number of factors, e.g., the impact of the economy on hiring and the perceived cost of implementing accommodations in the workplace; the impact of social attitudes regarding the desirability and potential for competitive work for people with developmental disabilities; the business and cultural attitudes regarding the desirability of employing persons with developmental disabilities and State allocation of resources to these efforts. Technical assistance provided by ACF to State programs has helped improve data stability and programmatic outcomes; nevertheless the lack of resources for data collection and the difficulties of data collection and interpretation continue to create instability in the data. Projections for FY 2002 are based on the assumption that there will be limited increases in employment or that performance will remain stable.
PROGRAM GOAL: Increase entry into, and retention of, employment for people with developmental disabilities consistent with their interests, abilities, and needs.
Objective: Increase employment of persons with developmental disabilities
1.2a. FY 2001: Increase to 3,800 from the FY 2000 baseline of 3,788 the number of adults with developmental disabilities who obtain integrated jobs as a result of DD program intervention.
FY 2002: Increase to 3,850 from the FY 2000 baseline of 3,788 the number of adults with developmental disabilities who obtain integrated jobs as a result of DD program intervention.
Data source: DDC annual Program Performance Report (PPR)
This measure focuses on employing persons with developmental disabilities. Because waiting lists for employment related services in many States are huge and perceived costs of overcoming the barriers that create those waiting lists are significant, it is difficult to project performance. Still, we hope to achieve gradual improvement over time.
The programs in the States work through three different approaches. The Council on Developmental Disabilities (CDD) works to create systems change within the employment service systems. Simultaneously public and business opinions and attitudes concerning employment of persons with disabilities are improved through educational efforts, involving both the Council and the Centers for Excellence/University Affiliated Programs. Protection and Advocacy Programs have worked to ensure that the rights of workers with developmental disabilities are not reduced.
Objective: Increase number of businesses/employers that employ persons with developmental disabilities
1.2b. FY 2001: Increase to 1,350 from the FY 1999 baseline of 1,113 the number of businesses/employers that employ and support people with developmental disabilities as a result of DD program intervention.
FY 2002: Increase to 1,400 from the FY 1999 baseline of 1,113 the number of businesses/employers that employ and support people with developmental disabilities as a result of DD program intervention.
Data source: DDC annual Program Performance Report (PPR)
This measure focuses on the willingness of employers to hire and support the work of persons with developmental disabilities. The DD employment goal is: "Increase entry into and retention of employment for people with developmental disabilities consistent with their interests, abilities, and needs." Meeting this goal requires that employers are well informed of the capabilities of individuals with disabilities and about support practices and accommodations. Public and private employment organizations vary in size, and the perceived costs of providing accessibility by eliminating physical and structural barriers and accommodations (such as hearing and visual impairment aids) in a volatile economy militate against an employer hiring persons with developmental disabilities. While it is difficult to project large increases in performance, we anticipate gradual improvement over time.
Three program approaches combined create a comprehensive approach to dealing with this issue. The Council on Developmental Disabilities (CDD) works to create systems change in providing better support for workers and ensuring that support is available to employers. Public and business opinions on employing persons with disabilities are improved through educational efforts, involving both the Council and the Centers for Excellence/University Affiliated Programs. The Centers for Excellence and the Councils are involved in researching improved models of support. Protection and Advocacy Programs work to ensure that employers are aware of the rights of workers with developmental disabilities.
Objective: Maintain the Federal dollars leveraged across the spectrum of Federal programs to benefit persons with developmental disabilities
1.2c. FY 2001: Increase to $2.4 million from the FY 1999 baseline the dollars leveraged from ADD's Federal partners to support positive outcomes for people with developmental disabilities in terms of employment, housing, education, health, and community support as a result of ADD intervention.
FY 2002: Maintain at $2.4 million the dollars leveraged from ADD's Federal partners to support positive outcomes for people with developmental disabilities in terms of employment, housing, education, health, and community support as a result of ADD intervention.
Data source: ADD administrative records
This measure focuses on engaging numerous programs within the Federal government to collaborate with ACF to ensure that persons with developmental disabilities receive the support they need. This support includes helping individuals to live lives that are independent, productive, and integrated in their communities. ACF promotes increasing the number of formal agreements with other Federal programs to meet this goal. Maintaining the target level at $2.4 million will require ongoing effort by ACF to develop new formal agreements to replace those that are ending.
ACF staff continue their efforts to develop and maintain contacts with other Federal programs which impact on persons with developmental disabilities. Memoranda of Understanding are developed, which often include the co-funding of projects. The need to meet programmatic and legislative requirements makes increasing these collaborative efforts challenging.
Program Description, Context, Legislative Intent and Broad Program Goals
ACF provides assistance and services to persons admitted to the United States as refugees, asylees, Cuban or Haitian entrants and Amerasian immigrants. The major program goals are to provide resources and technical assistance to States and other grantees in order to help refugees achieve economic self-sufficiency and social adjustment within the shortest time possible following their arrival in the U.S.
Federal resettlement assistance to refugees is provided primarily through a State-administered refugee resettlement program. States provide transitional cash and medical assistance and social services to refugees, and maintain legal responsibility for the care of unaccompanied refugee children.
The Office of Refugee Resettlement (ORR) provides funding for a broad range of social services to refugees, both through States and through direct service grants, to help refugees obtain employment and achieve economic self-sufficiency and social adjustment as quickly as possible. After deducting set-asides mandated by Congress, ORR, as in previous fiscal years, allocated 85 percent of the social service funds on a formula basis. The requested increase of $7.121 million will provide transitional and medical services for additional persons that receive asylum status each year. The request for $10 million (an increase of $5 million over the FY 2001 current estimate) will ensure continued administration of a national network for identification, tracking and certification of trafficking victims. There may be as many as 50,000 such victims of trafficking in the U.S. today.
In June of FY 2000, ORR changed its policy regarding the start date for eligibility of asylees for ORR benefits and services. This policy change added approximately 19,000 asylees to the ORR caseload eligible to receive cash and services. Adding the asylees to the anticipated refugee ceiling (85,000) and entrant arrivals (20,000) increases our total caseload to 124,000.
State Administered Program
Since FY 1995 the Office of Refugee Resettlement (ORR) has been working in partnership with States to implement the requirements of the Government Performance and Results Act (GPRA) into our State-administered program. Our joint efforts have moved the State-administered program to a focus on results through the process of setting and reporting of annual outcome goals.
The State-administered program outcome measure definitions are:
Entered employments (job placements) -- entered employment is defined as the entry of an active participant in employment services into unsubsidized employment for at least one day during any quarter of the Federal fiscal year.
Cash assistance terminations due to earnings -- a cash assistance termination (grant termination) is defined as the closing of a cash assistance case due to earned income in an amount that is predicted to exceed the State’s payment standard for the case based on family size, thereby rendering the case ineligible for cash assistance.
Cash assistance reductions due to earnings -- a cash assistance reduction (grant reduction) is defined as a reduction in the amount of cash assistance that a case receives as a result of earned income from employment.
Average hourly wage at placement -- average hourly wage at placement (employment entry) is calculated as the sum of the hourly wages for the unduplicated number of full-time placements in employment during the fiscal year divided by the total unduplicated number of individuals placed in full-time employment. (This outcome measure is not included in this plan.)
Ninety-day employment retentions -- this is a measure of continued participation in the labor market, not retention of a specific job. Employed means working for wages on the ninetieth day from placement at any unsubsidized job. Where there have been multiple placements for the same individual within the same Federal fiscal year, the date of the first employment entry is the start date for calculating the 90-day follow-up. An individual who is on strike on the ninetieth day is considered employed. An individual who has been laid off and does not anticipate returning to the same employment within 30 days is considered unemployed, unless the individual has obtained other employment.
Entered employments with health benefits available -- entered employments with health benefits available reflects the availability of health benefits (either at placement, or at any time within 6 months of placement) for those individuals who entered full-time employment. This is not a measure of how many individuals elect to enroll in health benefits, but rather how many jobs offer this option. Benefits should be considered available if self-only coverage is available to the employee, even if coverage is not extended to the employee’s family members. Benefits are considered available without regard to whether the employee must contribute to the premium or whether the employee must wait for coverage.
States may include a narrative explanation of local conditions that may have affected performance during the year, such as labor market conditions, or other factors that had an impact on a State’s ability to achieve its goals, such as an unanticipated reduction in refugee arrivals. Four of the above six measures are included in the State Administered program and two are included in the Matching Grants program.
Matching Grant Program
The Matching Grant program provides an alternative approach to the State-administered resettlement assistance. It provides voluntary agencies the opportunity to use focused intensive employment services, financial incentives, and the flexibility to experiment with creative solutions to the special employment problems of refugees in order to achieve early placements. The program’s goal is to help refugees attain self-sufficiency within four months after arrival, without access to public cash assistance. This program provides more comprehensive supports during intake and is targeted to families with at least one member deemed employable. Both of these features contribute to the higher success rate for the CY 1999 performance in this program.
The definition for economic self-sufficiency (an integral component of the Matching Grant Program)-- is earnings/income for the total family at a level that enables a family unit to support itself without receipt of cash assistance.
Program Activities, Strategies and Resources
ORR conducts on-site monitoring of selected States and other grantees to help them achieve improved client employment and self-sufficiency outcomes. ORR targets States that have large refugee populations and that receive significant ACF refugee program funding for monitoring. In monitoring, ORR assists States and grantees to identify strategies to improve outcomes on ORR performance measures and provides technical assistance on implementing program improvements.
The Refugee Program is affected by foreign policy decisions and crises. Its ability to quickly resettle new arrivals depends not only on local job markets but also on the rate of influx and refugees' special needs, educational levels, and English proficiency.
Program Coordination, Partnerships and Crosscutting Issues
ACF refugee resettlement policies and activities are coordinated with the U.S. Department of State, State and community agencies, the Immigration and Naturalization Service, the Social Security Administration, the U.S. Department of Agriculture’s Food and Consumer Service, as well as with TANF, Medicaid and other programs within DHHS.
Program-wide Performance
Refugee arrivals in FY 1999 totaled 106,098. ACF experienced a larger than usual bulge in refugee arrivals during the spring and early summer months of FY 1999 due to the Kosovo crisis. Approximately 14,000 Kosovar refugees were brought to the United States and given the right to remain here permanently. The Kosovo situation strained program capability and resources due to the large number of arrivals within a short time. In addition, many of the Kosovars required special services in mental health due to the experiences of torture and persecution.
The Kosovo situation changed dramatically in June and early July of last year. It was announced that if the Kosovar refugees who came to the U.S. by July 31, 1999, decided at a later date that they wished to return to Kosovo, the United States would finance their travel home. The deadline for registration for the funded return home was May 1, 2000. Approximately 11,200 of the 14,000 Kosovar refugees were eligible for the funded return. Approximately 4,000 have registered for the funded return and 3,350 of them have already returned. ACF has no way of knowing how many people have gone back on their own. We assume there have been some and there will likely be others who return to Kosovo on their own.
Outcomes for summer refugee arrivals were not reported until December 1999. ACF is confident that our partners made every effort to meet the established targets, however, at the time that targets were established, our partners were uncertain how many Kosovo refugees would elect to return to Kosovo and how many would stay in the U.S. to participate in our employment programs and services. In addition, our partners were providing services to a group of refugees with compelling special needs, many who were not employment-ready due to trauma. FY 1999 presented a unique set of circumstances and challenges for States with significant numbers of Kosovar refugees. This situation was without precedent in the refugee resettlement program. It was impossible to anticipate the impact that this unique set of circumstances would have when the States were establishing FY 1999 performance targets.
FY 1999 PERFORMANCE IN THE STATE-ADMINISTERED PROGRAM:
ORR tracked State and county performance throughout the year. The FY 1999 performance was as follows:
Entered Employments The goal for measure 3.1a was 51,597. The actual totaled 50,208 a 4 percent decline from the number recorded in FY 1998 (52,298).
Terminations due to Earnings The goal for measure 1.3c was 16,480. The actual totaled 16,445, a 3 percent decline from FY 1998 (16,978).
Employment Retentions The goal for measure 1.3d was 37,936. The actual totaled 36,055, a 5 percent decline from FY 1998 (38,040).
Entered Employments with Health Benefits The goal for measure 1.3b was 27,767. The actual totaled 28,425, a 5 percent increase from FY 1998 (27,124)
CY 1999 PERFORMANCE IN THE MATCHING GRANT VOLUNTARY AGENCY PROGRAM:
The Matching Grant Program emphasizes family self-sufficiency (independence from cash assistance) and is characterized by a strong emphasis on early employment and intensive services during the first four months after arrival. The performance measures are focused on the two most critical program goals: entered employments and the proportion of cases that are self-sufficient at four months after arrival in the U.S.
Entered Employments The goal for measure 1.3e was 8,620. The actual totaled 9,713, a 17 percent increase from the number recorded in CY 1998 (8,049).
Self-sufficiency at 120 days The goal for measure 1.3f was 5,710. The actual totaled 6,497 cases a 20 percent increase from CY 1998 (5,194).
National numbers do not tell the whole story. Many States significantly increased their performance.
Entered employment: The number of job placements decreased by 4 percent in FY 1999, largely due to the unique set of circumstances caused by the arrival of the Kosovar refugees. Twenty-seven States and two California counties exceeded their placements from last year. Six States placed more than 90% of their caseload. Thirty States increased their FY 2000 target by 5% or more than their FY 1999 performance. Thirteen States met or exceeded the FY 1999 target they established; four States missed their target by 5% or less.
Cash Assistance Terminations: The number of cash assistance terminations increased by 2% in FY 1999. Twenty-seven States and four California counties increased the number of cash assistance terminations over the previous year. Fourteen States met or exceeded the FY 1999 target they established; only one State missed their target by 5% or less. Twenty-eight States increased their FY 2000 target by 5% or more of their FY 1999 performance.
Retentions: Seventy-two percent of refugees who found employment retained their employment for ninety days, consistent with 73% in FY 1998. Twenty-eight States and four California counties improved the job retention rate over the previous year. In 32 States, more than 75% of job placements were retained for 90 days or more. Eighteen States met or exceeded the FY 1999 target they established and only two States missed their target by 5% or less. Thirty-five States increased their FY 2000 target by 5% or more of their FY 1999 performance.
Entered Employment with Health Benefits: Sixty-six percent of full-time placements offered health insurance compared with 57% the year before. Thirty-one States and two California counties increased their rates of health benefit availability over FY 1998. Seventeen States met or exceeded the FY 1999 target they established; only four States missed their target by 5% or less. Thirty-nine States increased their FY 2000 target by 5% or more of their FY 1999 performance.
FY 1999 showed significant improvement in the quality of jobs found for refugees. Forty States and nine California counties reported higher wages at placement than in FY 1998. Twenty-seven other States reported average wage at placement of $7.00 or above, compared with twenty the year before. Refugees found employment not only at higher wages, but also with more benefits. Average wage at placement in the State-Administered program $7.20, a 4% rise from FY 1998 ($6.90). Average wage at placement in the matching grant program was $7.42, an 11% rise from CY 1998 ($6.58).
Data Issues
Data are submitted quarterly by all States participating in the State-administered program via the quarterly performance report (Form ORR-6). Data for the Matching Grant are submitted to ACF three times per year on the Matching Grant Progress Report form. Baseline data for all measures in the State-administered program are derived from FY 1997 annual unduplicated outcome data as reported on the annual Outcome Goal Plans. Baseline data for the Matching Grant program are derived from the Calendar Year 1997 Report. Matching Grant unduplicated annual performance data are submitted to ACF in February of each year.
Desk monitoring and tracking of quarterly performance report data occur quarterly in the State-administered program and 3 times per year in the Matching Grant program. Data are validated by periodic on-site monitoring, in which refugee cases are randomly selected and reviewed. Outcomes reported by service providers are verified with both employers and refugees to ensure accurate reporting of job placements, wages and retentions.
Summary Table
|
Performance Measures |
Targets |
Actual |
Reference | ||
|
1.3a. Increase the number of refugees entering employment through ACF-funded refugee employment services by at least 5% annually from FY 1997 actual performance. |
FY 02: 59,730 |
FY 02: |
Px M-46 | ||
|
1.3b. Increase the number of entered employments with health benefits available as a subset of full-time job placements by 5% annually from the FY 1997 actual performance. |
FY 02: 32,144 |
FY 02: |
Px M-46 | ||
|
1.3c. Increase the number of refugee cash assistance cases closed due to employment by at least 5% annually as a subset of all entered employments from the FY 1997 actual performance. |
FY 02: 19,077 |
FY 02: |
Px M-47 | ||
|
1.3d. Increase the number of 90-day job retentions as a subset of all entered employments by at least 5% annually from the FY 1997 actual performance. |
FY 02: 43,915 |
FY 02: |
Px M-47 | ||
|
1.3e. Increase the number of refugees who enter employment through the Matching Grant (MG) program as a subset of all MG employable adults by at least 5% annually from the calendar year 1997 actual performance. |
CY 02: 9,979 |
CY 02: |
Px | ||
|
1.3f. Increase the number of refugee families (cases) that are self-sufficient (not dependent on any cash assistance) within the first 4 months after arrival by at least 4% annually from the calendar year 1997 actual performance. |
CY 02: 6,423 |
CY 02: |
Px | ||
|
FY 2000 Data Availability: Annual, unduplicated FY 2000 data is due from States 45 days after
end of year, circa November 15. Because individual State reports may be
missing and time is needed to validate and verify the data, final State
data will be available in April 2001, final MG data in May
2001. | |||||
|
Total Funding (dollars in millions) |
FY 02: $446.2 |
*Bx: budget just. section I | |||
Performance Measures for FY 2002 and Final Measures for FY 2001
Background for the selection of performance measures: The Office of Refugee Resettlement (ORR) convened a workgroup comprised of State Refugee Coordinators and ORR staff in November 1994 to establish performance measures and annual outcome goals. The workgroup agreed the selection of performance measures would be based on the following criteria: measures must be results-oriented, quantifiable, based on reliable data, stated in terms of positive change in social or economic conditions for the refugees using the services and they must measure program effectiveness. The targets would measure achievements in a given period of time.
The workgroup also recommended that States be required to establish annual outcome targets aimed at continuous improvement of performance for each of the selected program measures. All the performance measures are aimed at increasing refugee early employment and self-sufficiency. The workgroup recommended the following six program measures as most representative and manageable for reporting purposes. Five of the six measures have been incorporated in the ACF annual performance plan.
Entered employments (job placements)
Cash assistance terminations due to earnings
Cash assistance reductions due to earnings
Average hourly wage at placement
90-day employment retentions
Entered employments with health benefits available
STATE-ADMINISTERED PROGRAM
Specific program goals to be achieved in FY 2002 have been set on the four most critical of the six outcome measures. For the FY 1999 - 2002 targets, a common baseline year of 1997 (the earliest year with a complete data set) was established for both programs serving refugees, replacing the baselines used previously. Baselines for the State-administered program were established using fiscal year data.
1.3a. FY 2001: Increase the number of refugees entering employment through ACF-funded refugee employment services by at least 5% annually from the FY 1997 actual performance of 46,800 to 56,885.
FY 2002: Increase the number of refugees entering employment through ACF-funded refugee employment services by at least 5% annually from FY 1997 actual performance of 46,800 to 59,730.
1.3b. FY 2001: Increase the number of entered employments with health benefits available as a subset of full-time job placements by 5% annually rom the FY 1997 actual performance of 25,186 to 30,613.
FY 2002: Increase the number of entered employments with health benefits available as a subset of full-time job placements by 5% annually from the FY 1997 actual performance of 25,186 to 32,144.
1.3c. FY 2001: Increase the number of refugee cash assistance cases closed due to employment by at least 5% annually as a subset of all entered employments from the FY 1997 actual performance of 14,948 to 18,169.
FY 2002: Increase the number of refugee cash assistance cases closed due to employment by at least 5% annually as a subset of all entered employments from the FY 1997 actual performance of 14,948 to 19,078.
1.3d. FY 2001: Increase the number of 90-day job retentions as a subset of all entered employments by at least 5% annually from the FY 1997 actual performance of 34,409 to 41,824.
FY 2002: Increase the number of 90-day job retentions as a subset of all entered employments by at least 5% annually from the FY 1997 actual performance of 34,409 to 43,915.
Data sources: ORR-6.
Beginning with FY 1996, States (and California counties) submit an end-of-year report to ORR comparing projected annual targets with actual targets achieved for each of the six measures. States may include a narrative to explain increases or decreases in performance due to local conditions that may have affected performance during the year, such as labor market conditions or other factors, such as unanticipated reduction in refugee arrivals.
When setting targets for each measure, States are asked to establish targets aimed at improving the previous year’s actual performance. While there are no national performance requirements or formal-comparison of States, each State’s actual annual performance is compared to that State’s projected targets to calculate the level of achievement and to ensure that States strive for continuous improvement in their goal-setting process from year to year. States that reach a high employment and self-sufficiency rate of 90% among employable refugees may choose to maintain their target levels rather than increase them. Although there are no monetary punishments or rewards, data on each State’s or county’s annual targets and actual performance for the six measures are published in the Annual Report to Congress. The publicity serves as an incentive for improved performance.
MATCHING GRANT VOLUNTARY AGENCY PROGRAM
ACF requires nonprofit agencies participating in the Matching Grant Voluntary Agency Program to set outcome goals each year on five outcome measures negotiated with the Matching Grant agencies. Only the first two outcome measures are included in this annual performance plan and report.
The Matching Grant program baselines use the calendar year to reflect the matching grant program period. The two sets of measures that follow track progress for this program.
1.3e. FY 2001: Increase the number of refugees who enter employment through the Matching Grant program as a subset of all MG employable adults by at least 5% annually from the calendar year 1997 actual performance of 7,819 to 9,504 persons in calendar year 2001.
FY 2002: Increase the number of refugees who enter employment through the Matching Grant program as a subset of all MG employable adults by at least 5% annually from the calendar year 1997 actual performance of 7,819 to 9,979 persons in calendar year 2002.
1.3f. FY 2001: Increase the number of MG refugee families (cases) that are self-sufficient (not dependent on any cash assistance) within the first 4 months after arrival by at least 4% annually from the calendar year 1997 actual performance of 5,279 cases to 6,176 cases in calendar year 2001.
FY 2002: Increase the number of MG refugee families (cases) that are self-sufficient (not dependent on any cash assistance) within the first 4 months after arrival by at least 4% annually from the calendar year 1997 actual performance of 5,279 cases to 6,423 cases in calendar year 2002.
Data source: Matching Grant Progress Report
ORR has implemented a number of strategies aimed at challenging States to improve performance for targets that were not achieved. ORR publishes State and Matching Grant performance results in the Annual Report to Congress; certificates of commendation are presented to States with increased performance at the annual ORR national conference; and ORR staff negotiate the targets and provide technical assistance and monitoring to the States and Matching Grant Program grantees to achieve mutually acceptable goals.
Ability to predict future performance: ORR continues to focus on performance and encourages grantees to be courageous in setting goals. ORR negotiates annual goals with each of its grantees and stresses continuous improvement. The extent to which ORR can predict future performance is limited, because of the emergency humanitarian nature of the refugee resettlement program. Response to international mass migrations of persecuted persons, such as the Kosovars, places additional demands on our domestic resettlement partners by dramatically increasing the numbers of refugees receiving ORR services. However, the robust economy has enabled our service network to place additional refugees in jobs each year.
Program Description, Context, Legislative Intent and Broad Program Goals
The Social Services Block Grant (SSBG) provides funding to States for a broad array of services. The SSBG is based on two fundamental principles: (1) State and local governments and communities are best able to determine the needs of individuals to help them achieve self sufficiency; and (2) social and economic needs are interrelated and must be met simultaneously.
Due to the nature of the program, SSBG has minimal reporting requirements. However, SSBG funds support outcomes across the human service spectrum and these outcomes are associated with strategic goals and objectives elsewhere in this plan, e.g., employment, child care, child welfare, adoptions, and youth services. A block grant by definition frees its recipients, in this case, States, to invest the funds flexibly and generally carries limited oversight and reporting requirements.
SSBG funds are used for direct services listed in the charts below. SSBG funds also help States improve and integrate services, create community-based partnerships, and stimulate innovations. In effect, they help hold the human services delivery system together. SSBG grants are made directly to the 50 States, the District of Columbia and Puerto Rico, Guam, the Virgin Islands, American Samoa, and the Commonwealth of the Northern Mariana Islands to fund social services tailored to meet the needs of individuals and families residing within the jurisdiction. Grants are determined by a statutory formula based on each State’s population. States are fully responsible for determining the use of their funds.
Program-wide Performance
The following chart shows FY 1999 expenditures for Federal dollars in various SSBG service areas as reported by States. The data represent reports from 50 States and the District of Columbia.
|
SSBG Expenditures 1999 | |||
|
SSBG SERVICE CATEGORIES |
1999 SSBG EXPENDITURES |
SSBG SERVICE CATEGORIES |
1999 SSBG EXPENDITURES |
|
Adoption services |
$ 27,068,798 |
Independent/transitional living |
$ 20,610,925 |
|
Case management |
$132,908,772 |
Information and referral |
$ 33,198,634 |
|
Congregate meals |
$ 3,128,588 |
Legal services |
$ 13,257,282 |
|
Counseling services |
$ 44,044,719 |
Pregnancy and parenting |
$ 9,356,380 |
|
Day care-adults |
$ 14,201,956 |
Prevention/intervention |
$278 673,733 |
|
Day care-children |
$396,584,900 |
Protective services--adult |
$111,314,875 |
|
Education/training services |
$ 9,189,814 |
Protective services--child |
$269,305,785 |
|
Employment services |
$ 56,365,891 |
Recreation services |
$ 1,087,531 |
|
Family planning service |
$ 49,777,461 |
Residential treatment |
$ 83,492,341 |
|
Foster care services--adult |
$ 8,411,802 |
Special services--youth at risk |
$ 78,748,868 |
|
Foster care services--child |
$315,198,587 |
Special services--disabled |
$234,646,054 |
|
Health related services |
$ 20 452,552 |
Substance abuse services |
$ 13,859,456 |
|
Home based services |
$208,251,875 |
Transportation |
$ 25,460,287 |
|
Home delivered meals |
$ 17,358,222 |
Other services |
$159,469,855 |
|
Housing services |
$ 17,226,143 |
Administrative Costs |
$234,601,526 |
|
*SSBG expenditures include funds transferred from TANF. Only 4 States (MI, MN, NJ and UT) were unable to report how funds transferred from TANF were spent by category of service. |
Uncategorized TANF transfer expenditures* |
$169,160,349 | |
|
Total SSBG Expenditures1 |
$3,056,413,963 | ||
Data Issues
SSBG data contain multi-year information and some of the dollars spent on services in FY 1999 may have been transferred from previous years or other programs.
States report both total expenditures and SSBG expenditures. Total expenditures include all other Federal, State and local funds for each service that received SSBG funds. The complexity of many States' financial systems makes it difficult for them to provide accurate data on other sources of funds being applied to each of these services. The SSBG report in FY 1998 included data from 50 States and the District of Columbia. Although all States submitted post-expenditure reports, many States were unable to provide information on total expenditures in their post-expenditure reports, so including this item would have excluded many more States from the analyses.
During this year, the Office of Community Services (OCS) assisted States to improve performance in this area. Post-expenditure data received from States are regularly validated. Problems arising through validation are discussed with States and technical assistance is provided where practical. While several problems exist, considerable improvement has been made to assist more States to report and continuous progress is being made to increase validation rates and make the data more usable. OCS will continue to coordinate with other agencies and organizations to review and assess shifts in funding priorities in order to project accomplishment of performance targets. The five SSBG performance measures that are in the summary table that follows were first included in the FY 2001 submission of the Performance Plan.
Summary Table
|
Performance Measures |
Targets |
Actual Performance |
Reference |
|
1.4a. Maintain the number of child recipients of day care services funded wholly or in part by SSBG funds at the FY 1998 baseline. |
FY 02: 2,399,827 |
FY 02: |
Px M-51 |
|
1.4b. Maintain the number of adult recipients of home based services funded wholly or in part by SSBG funds at the FY 1998 baseline. |
FY 02: 339,253 |
FY 02: |
Px M-51 |
|
1.4c. Increase the number of adult recipients of special services for the disabled funded wholly or in part by SSBG funds by 5% annually from the FY 1998 baseline. |
FY 02: 328,729 |
FY 02: |
Px M-51 |
|
1.4d. Maintain the number of recipients of child protective services funded wholly or in part by SSBG funds at the FY 1998 baseline. |
FY 02: 1,302,895 |
FY 02: |
Px M-52 |
|
1.4e. Increase the number of recipients of information and referral services funded wholly or in part by SSBG funds by 2% annually from the FY 1998 baseline. |
FY 02: 1,348,171 |
FY 02: |
Px M-52 |
|
Total Funding (dollars in millions) |
FY 02: $1700.0 |
Bx: budget just. section D | |
Performance Measures for FY 2002 and Final Measures for FY 2001
Congress intended that SSBG (initially Title XX) funding be directed at one or more of five legislated national goals. These goals are closely aligned with the key priority goals identified in the ACF annual performance plan. The first goal is to achieve or maintain economic self-support to prevent, reduce, or eliminate dependency. One of the primary needs of parents who previously relied on welfare support in entering the workforce is affordable child care. States can apply funding from SSBG to child day care wholly or in part.
1.4a. FY 2001: Maintain the number of child recipients of day care services funded wholly or in part by SSBG funds at the FY 1998 baseline of 2,399,827.
FY 2002: Maintain the number of child recipients of day care services funded wholly or in part by SSBG funds at the FY 1998 baseline of 2,399,827.
A second national goal is to prevent or reduce inappropriate institutional care by providing for community-based care, home-based care or other forms of less intensive care. Several services to which SSBG funding can be applied are intended to increase independent living among disabled or low-income individuals. Such services increase opportunities for individuals to maintain successful and healthy lives within the community, and reduce the need for placement in more restricted environments. These services include independent living services, home-based services, home-delivered meals, housing services, and special services for individuals with disabilities. Data indicates an increasing demand for special services to individuals with disabilities.
1.4b. FY 2001: Maintain the number of adult recipients of home based services funded wholly or in part by SSBG funds at the FY 1998 baseline of 339,253.
FY 2002: Maintain the number of adult recipients of home based services funded wholly or in part by SSBG funds at the FY 1998 baseline of 339,253.
1.4c. FY 2001: Increase the number of adult recipients of special services for the disabled funded wholly or in part by SSBG funds by 5% annually from the FY 1998 baseline of 298,167.
FY 2002: Increase the number of adult recipients of special services for the disabled funded wholly or in part by SSBG funds by 5% annually from the FY 1998 baseline of 298,167.
NOTE: Increases are anticipated due to the recent (1999) Supreme Court Decision (Olmstead ) which essentially asserts the right of persons with disabilities to live in less restricted settings. Secondly, as State TANF programs reach out to more hard-to-serve populations, both demand for child care from mothers who have children with special disabilities and the demand for job readiness preparation for persons with mild retardation are expected to increase. A program such as SSBG might be anticipated to help respond to this demand.
A third national goal is to prevent or remedy neglect, abuse or exploitation of children and adults unable to protect their own interests and preserve, rehabilitate or reunite families. SSBG funds can be applied to a range of child welfare services and are a valuable source to States of funding for this critical area. These services include child protective services, child foster care services, and adoption services. In addition, prevention and intervention services, special services for individuals with disabilities and special services for youth at risk are very important to the child welfare population. It is anticipated that this critical service will be maintained at the baseline level.
1.4d. FY 2001: Maintain the number of recipients of child protective services funded wholly or in part by SSBG funds at the FY 1998 baseline of 1,302,895.
FY 2002: Maintain the number of recipients of child protective services funded wholly or in part by SSBG funds at the FY 1998 baseline of 1,302,895.
It is anticipated that as SSBG funds are reduced in other services, I & R services will increase.
1.4e. FY 2001: Increase the number of recipients of information and referral services funded wholly or in part by SSBG funds by 2% annually from the FY 1998 baseline of 1,295,820.
FY 2002: Increase the number of recipients of information and referral services funded wholly or in part by SSBG funds by 2% annually from the FY 1998 baseline of 1,295,820.
Data source for measures1.4a-e: SSBG post-expenditure reports from the States.
(Note: Objective 2 does not refer to the "Independent Living Program" for youth aging out of foster care, which is discussed under Objective 7.)
DEVELOPMENTAL DISABILITIES (HOUSING)
The DD housing goal: "Increase the opportunities of adults with developmental disabilities to choose where and with whom they live and to have the services they need to support these choices" includes the following outcomes: "Individuals with developmental disabilities have opportunities and information needed to make choices about where to live. People with developmental disabilities have the ability to own their own homes. Living in the community is affordable, accessible, and equitable."
(See information on DD partnership process, performance goals, data, and resources under Strategic Objective 1, above.)
|
Performance Measures |
Targets |
Actual |
Reference | |
|
Program Goal: Increase the opportunities of adults with developmental disabilities to choose where and with whom they live and to have the services they need to support these choices. 2.1a. Increase the number of people with developmental disabilities owning or renting their own homes as a result of DD program intervention. |
|
|
| |
|
Ö This represents FY 1999 data that was not available when the FY
1999 report was submitted with the FY 2001 CJ. |
Program-wide Performance
The number of people with developmental disabilities owning or renting their own homes (measure 2.1a) significantly exceeded the FY 2000 target but fell short of previous years’ performance. DD Councils in 35 States and territories reported 7,308 people with developmental disabilities owning or renting their own homes, as a consequence of DD Council intervention, which included educating mortgage lenders, training potential homeowners, and funding projects to demonstrate cutting edge practices to achieve improved outcomes. The targets for FY 1999 and 2000 were significantly underestimated. More conservative reporting of data accounts for the decrease in number of adults who own or rent their own homes.
Summary Table
Performance Measures for FY 2002 and Final Measures for FY 2001
PROGRAM GOAL: Increase the opportunities of adults with developmental disabilities to choose where and with whom they live and to have the services they need to support these choices.
Objective: Increase the number of people with developmental disabilities owning or renting their own homes.
2.1a. FY 2001: Increase to 7,500 from the FY 2000 baseline of 7,308 the number of people with developmental disabilities owning or renting their own homes as a result of DD program intervention.
FY 2002: Increase to 8,000 from the FY 2000 baseline of 7,308 the number of people with developmental disabilities owning or renting their own homes as a result of DD program intervention.
Data source: DDC annual Program Performance Report (PPR)
The achievement of the performance target is significantly affected by a number of factors, e.g. the impact of the economy on the cost of buying or renting housing, the perceived cost of making such housing accessible to people with disabilities, and the impact of social attitudes regarding the desirability and potential for people with developmental disabilities to live in the community. Additionally, the negative attitudes of businesses and banks regarding making loans, selling housing, or renting housing to persons with developmental disabilities limit the ability of social services programs to promote choice of living in a community for persons with developmental disabilities.
Technical assistance is provided by ACF to State programs to help with improving data stability and programmatic outcomes. The above issues combined with data collection and interpretation difficulties continue to create instability in performance data.
ADD funds three different approaches in the States that contribute to the accomplishment of this objective. The Council on Developmental Disabilities (CDD) works to create systems change within the housing and community-based service systems. Educational efforts to improve public and business opinions on financing and housing for persons with disabilities, involving both the Council and the Centers for Excellence/University Affiliated Programs. Protection and Advocacy Programs work to ensure that the housing and financing rights of people with developmental disabilities are protected.
ASSETS FOR INDEPENDENCE (Individual Development Accounts)
Program Description, Context, Legislative Intent and Broad Program Goals
The Assets for Independence Demonstration Program was established by the Assets for Independence Act (AFI Act), under title IV of the Community Opportunities, Accountability and Training and Educational Services Human Services Reauthorization Act of 1998, P.L. 105-285 (also known as Individual Development Accounts or IDA).
The Assets for Independence Demonstration Program is a directed, matched savings/investment program for lower-income individuals and families. Participants enter into a Savings Plan Agreement with the project grantee which establishes a schedule and goal of savings from earned income, to be matched at an agreed rate which can be from one dollar to eight dollars for each dollar saved. Matching contributions are made by the grantee at least quarterly from equal parts of Federal grant funds and non-Federal share contributions to the project. Matched savings may be expended for either (1) the purchase of a principal residence by a first-time homebuyer, (2) the capitalization of a business, or (3) expenses of post-secondary education.
The major goals of the program are to design demonstration projects that will determine: (1) the social, civic, psychological, and economic effects of providing to individuals and families with limited means an incentive to accumulate assets by saving a portion of their earned income; (2) the extent to which an asset-based policy that promotes saving for post-secondary education, homeownership and small business capitalization may be used to enable individuals and families with limited means to increase their economic self-sufficiency; and (3) the extent to which an asset-based policy stabilizes and improves families and the community in which the families live.
Eligible applicants are private, not-for-profit 501(c)(3) organizations, or State and local governmental agencies or Tribal governments applying jointly with eligible not-for-profit organizations, Credit Unions that have been designated as Low Income Credit Unions by the National Credit Union Administration, and Community Development Financial Institutions (CDFI), so designated by the Treasury Department or the CDFI Fund. Grantees are selected competitively on the basis of applications using the following criteria: the background and capabilities of the applicant; the description of the target population; project theory, design, and plan; the plan for providing information needed for program evaluation; additional resources available to support project participants; and the description of the results and benefits expected to result from the project. Applications must include a commitment for a cash non-Federal share equal to the amount of the Federal grant.
The Program Announcement encourages all applicants to agree to use MIS IDA software or a comparable Asset Development Information System that OCS expects to provide to grantees to track participant and account characteristics and experience. Section 412 of the AFIA requires annual reporting by grantees on the basis of this data. The statute requires that at least 2 percent of grant funds be used for data collection. Section 414 requires an annual report to the Congress based on these grantee reports, and calls for an overall evaluation of the program over the five-year duration of the AFIA and its impact on a variety of factors listed in that section, including potential financial returns to the Federal Government and other investors in IDA over a 5-year and 10-year period. Pursuant to these provisions, ACF awarded a contract to Abt Associates, Inc. of Cambridge, MA to evaluate the funded IDA projects and the overall program; the evaluation plan they developed has been approved by the agency.
Program Activities, Strategies and Resources
This program is entering its third year. A first round of forty (40) demonstration grants was funded in August and September 1999 for 5-year demonstration programs. In FY 2000, OCS received another $10 million appropriation with which it made twenty-five (25) new competitive grants to new applicants and seventeen (17) supplementary grants to FY 1999 grantees. These supplementary grants were made to grantees that demonstrated their ability to raise additional non-Federal share dollars, to document successful operation of their project so far, and identify unmet need that could only be met with supplemental funding.
Each of these grantees will produce yearly progress reports within 60 days of completion of the program year. The Secretary will submit an interim progress report to Congress using the information in these reports.
A process for developing impact measures based on the three overall goals for the program is part of the evaluation plan developed under a one-year Task Order issued by DHHS. In August 2000, the evaluation contractor submitted the evaluation plan that includes a conceptual framework along with an evaluation design. The research data collection strategies for the impact measures include an interview questionnaire for use with professional staff during on-site visits with selected grantees for the process study. A participant questionnaire for telephone interviews with randomly selected IDA holders will be used as a comparison with non-treatment respondents to the "Assets and Liabilities" module of the Survey of Income and Program Participant instrument administered by the U.S. Bureau of the Census in the non-experimental impact analysis component of the evaluation.
Amendments to the AFIA, which took effect December 21, 2000 have made a number of changes to the original program, including:
Under special "transitional" provisions in the 2000 amendments to the AFIA, each of the FY 1999 grantees will produce initial progress reports within 90 days of the effective date of the amendments, or by March 21, 2001, and thereafter within 60 days of the end of each program year. The Secretary will submit a first interim progress report to Congress using the information in these progress reports. Under the 2000 IDA Amendments, the reporting date for first the Interim Report to Congress has also been extended to March 21, 2001.
Section 412 of the AFIA requires that the following information be reported annually by all program grantees:
The annual reports will provide ACF with information critical to the development of performance measures and targets. The matched savings/investment program requires lengthy start-up time for the grantees to establish the program, identify prospective participants, establish matched savings plan accounts and then at least two years are required for investments to mature.
Currently ACF is considering the following areas for performance measures:
Section 414 of the AFIA requires that the Secretary enter into a contract with an independent research organization to evaluate the demonstration projects conducted pursuant to the act, individually and as a group, and lists the following factors to be addressed:
|
Total Funding, Assets for Independence (dollars in millions) See detailed Budget Linkage Table in Appendix 6 for line items included in funding totals. |
FY 02: $25.0 |
Bx: budget just. section H |
The AFIA authorizes annual appropriations of $25 million for the program. $10 million was appropriated for each of the first two years, FY 1999 and FY 2000. For FY 2001 the Congress appropriated $25 million on the basis of growing support for the program among practitioners, States, and the financial community which felt that as the program gained experience and momentum in the field, the demand for funding would increase. At the same time, OCS has devoted increased resources to technical assistance, both to existing grantees and to prospective applicants. We also believe that this added assistance, along with the increased funding will enlarge the scope of the evaluation and result in a larger and deeper source of data that will yield more valuable findings.
Program Coordination, Partnerships and Crosscutting Issues
ACF continues to work in partnership with selected States and local grantees toward achieving the goals of this program. We have found that a key to successful project implementation is the development of effective, mutually supportive relationships between grantees and their partnering Financial Institutions, and OCS technical assistance efforts are focusing on strengthening these relationships. Some of the other external variables that will continue to influence the achievement of program goals include the health of the local economy and the availability of jobs; systemic barriers to low income employment such as availability of transportation and affordable day care; support of the banking, business, and foundation communities in providing non-Federal matching contributions; and the availability of support structures that will enhance job retention and advancement of IDA program participants.
Data Issues
Each grantee must provide a plan for collecting, validating and providing relevant, accurate and complete data for internal management information, statutory reporting and project evaluation purposes; and clear expression of a commitment to cooperation with the statutorily mandated evaluation of the national Assets for Independence Demonstration Program. Under the AFI Act as amended project grantees are required to use at least 2%, but not more than 15%, of grant funds to provide the research organization evaluating the demonstration project with such information as may be required for the evaluation of the demonstration project.
The Assets for Independence Act allocates a portion of the appropriated funds to support an evaluation of the overall demonstration program in addition to the funds grantees are required to expend on data collection. The agency requires the grantee to provide a well thought-out plan for collecting, validating and reporting the necessary data in a timely fashion. The grantee is also encouraged to identify the kinds of data it believes would facilitate the management information, reporting, and evaluation purposes. The grantee also agrees to cooperate with the evaluation of the national program. Grantees are urged to carry out an ongoing assessment of the data and information collected as an effective management/feedback tool in implementing their project. OCS, through its technical assistance contractor, expects shortly to provide all AFIA grantees with a new Asset Development Information System that will greatly facilitate maintenance, collection, validation, and transmission of project data essential to the program evaluation.
|
3. Increase parental responsibility Approach for the Strategic Objective: Establish paternities for children born out-of-wedlock and ensure that parents support their children. |
Program Description, Context, Legislative Intent and Broad Program Goals
The mission of ACF’s Child Support Enforcement (CSE) program is to assure that assistance in obtaining support is available to children by locating parents, establishing paternity and support obligations, and modifying and enforcing those obligations. The performance targets in this plan are consistent with the DHHS goal of self-sufficiency for low-income families through employment and child support collections. The Office of Child Support Enforcement (OCSE) works in cooperation with State agencies to achieve these goals.
The CSE Program is federally funded, i.e., the Federal government pays 66% of State administrative costs, 90% of paternity laboratory costs, and (subject to a cap and other limitations) 80% of approved automation costs, but it is administered by State and local governments. The Federal role is to provide direction, guidance, technical assistance, oversight, and some critical services to States' CSE Programs for activities mandated under title IV-D of the Social Security Act. The request for an increase of $200 million for State Child Support includes funding Tribal child support programs at 90% and up to $.5 million in start up costs over two years, administrative costs and Federal incentive payments to States for several initiatives to strengthen the child support enforcement program. These proposals reflect investing in families while at the same time addressing existing financing structure and other administrative complexities.
The CSE Program was selected as a GPRA pilot for FY 1995 and FY 1996. As a result, a consensus National Child Support Enforcement Strategic Plan (FY 1995 - 1999) was completed in February 1995, by State and Federal partners. Performance measures for each goal and objective in the Plan followed in July 1996. The goals, objectives and performance measures in this Performance Plan are aligned with those in the strategic plan. Previous GPRA performance plans reported on paternities established and dollars collected while State and Federal partners jointly developed the CSE program’s performance measures. The FY 1999 data are available; the FY 2000 data on the five performance plan measures of paternity establishment, order establishment, collections of current support, collections on past-due support, and cost-effectiveness, which are audited for completeness and reliability, will be available in late spring 2001. State, Federal, local and tribal partners completed the Strategic Plan for FY 2000-2004 in June 2000. The goals, objectives and performance measures in this Performance Plan are aligned with those in the FY 2000-2004 Strategic Plan.
Welfare Reform: The Personal Responsibility and Work Opportunity Reconciliation Act of 1996 (PRWORA) is having a dramatic impact on the child support program. The new law adds major new responsibilities and increases workloads for both State and Federal staff. As described below, the Child Support Enforcement program has been greatly strengthened by the welfare reform law.
The Child Support Enforcement program broke new records in nationwide collections in FY 2000, reaching $17.9 billion. The government collected a record $1.4 billion in overdue child support from Federal income tax refunds for tax year 2000. More than 1.42 million families benefited from these collections. In addition, a program to match delinquent parents with financial records found more than one million accounts belonging to more than 690,000 delinquent non-custodial parents nationwide with a value in excess of $3 billion. The number of paternities established or acknowledged reached a record 1.6 million in FY 1999. Of these, over 754,000 were established through in-hospital acknowledgement programs. An additional 845,000 paternities were established through the Child Support Enforcement program.
PRWORA provided new tools to the Child Support Enforcement program to secure emotional and financial support for many of our nation's children. Some of the new support enforcement tools are the National Directory of New Hires, the Federal Case Registry, Financial Institution Data Matches, State Disbursement Units, activities in Paternity Establishment, and the Passport Denial program. PRWORA included significant enhancements of State and Federal data systems. States are now required to have a State Directory of New Hires and a State Case Registry for Child Support Enforcement. Together, the NDNH and the FCR give States the ability to track non-custodial parents across State lines using a complete and automated system. These various tools provided by the welfare reform law generate direct collections and also ancillary benefits. Some States are beginning to use matches provided by the system to locate custodial parents to distribute child support payments. The landscape of child support enforcement is changing because of the speed, efficiency, and effectiveness of this new system.
Incentive funding: The CSE program includes an incentive funding system with a formula based in statute. PRWORA required the Secretary of Health and Human Services to develop a new revenue-neutral, performance-based incentive funding formula in consultation with States. This incentive funding system, which pays rewards to States based on cost effectiveness, will remain in effect until FY 2001, while a new system, enacted by the Child Support Performance and Incentive Act of 1998 (CSPIA), is being phased in beginning in FY 2000. The formula will be instrumental in driving the CSE program toward achievement of the performance targets in this plan. This performance plan employs the same five performance measures enacted by CSPIA:
· Statewide paternity establishment percentage (PEP)
Number of Children in State with Paternity Established or Acknowledged during
the FY
Number of Children in State Born Out-of-Wedlock in the Preceding FY
· Percentage of IV-D cases with support orders:
Number of IV-D Cases with Support Orders
Number of IV-D Cases
· IV-D collection rate for current support:
Collections on Current Support in IV-D Cases
Current Support Amount Owed in IV-D Cases
· IV-D arrearage cases paying:
Number of IV-D Cases Paying Toward
Arrears
Number of IV-D Cases with Arrears
Due
· Total dollars collected per $1 of expenditures:
Total of IV-D Dollars Collected
Total of IV-D Dollars Expended
In order to implement the new incentive system, OCSE has been providing training to States on the incentive measures, the formula for calculating payments and revised data reporting. OCSE’s auditors are closely monitoring the ability of States to report reliable data and are also assessing the validity of State-reported data.
During FY 2002, ACF will be measuring the CSE Program's success using these outcome measures which are part of the new incentive system to gauge the achievement of the goals and objectives of the National CSE Strategic Plan.
Program Activities, Strategies and Resources
ACF will aggressively implement the child support provisions of the law through technical assistance, tracking parents, and helping collect court-ordered support payments. This strategy will be achieved through a variety of means, including implementing Federal policy, technical assistance, training, information dissemination, a more performance-based incentive funding structure, and Federal oversight and assistance with State-based quality assurance.
The Federal Parent Locator Service will be expanded to facilitate location of non-custodial parents, their employers and their assets in order to promote the establishment and enforcement of child support orders. The National Directory of New Hires and Federal Case Registry have been implemented and are locating absent parents across State lines. The FCR contains 15.5 million child support cases (6% are non-IV-D) involving 31.7 million unduplicated case participants. As of January 31, 2001, 52 States and Territories (note: Guam and VI are missing) and 146 Federal agencies are reporting data to the NDNH. From Oct. 1, 2000 through Jan. 31, 2001, information was sent to States on more than 3.5 million non-custodial parents or putative fathers who live or work in another State than the one in which their child(ren) reside.
ACF works with the Department of State to deny passports to non-custodial parents who are not fulfilling their child support obligations. As many as 60 passports are denied every business day. Since the program's inception in June 1998, more than $6.5 million in lump sum payments have been collected by the States through the program. This amount does not include collections made through payment plans into which NCPs enter upon denial of their passport.
ACF operates the Multi-State Financial Institution Data Match (MSFIDM) with financial institutions and works with State partners to implement the In-State Financial Institution Data Match that assists in the identification of non-custodial parent assets. From October 1, 2000 through December 31, 2000, about 696,000 matches have been returned from the multi-state financial institutions based on matching social security numbers. States are using arrangements including in-house, consortia, and outsourcing to implement the in-state financial institution data match with local financial institutions.
ACF will continue efforts to broaden parental responsibility, especially the involvement of fathers in the lives of their children, through several means. First, by focusing attention on the positive role fathers have in improving their children’s well-being. Second, by ensuring that the DHHS research agendas pay adequate attention to the role of fathers in families and the effects of fathering on children’s well-being. Third, by using positive messages and language regarding fathers and fatherhood in publications and announcements; and finally, by ensuring that DHHS’ own workforce policies encourage and enable fathers to balance work and family life responsibilities.
Working in partnership with States, ACF will use the following resources and tools to achieve the FY 2002 performance goals:
Program Coordination, Partnerships and Crosscutting Issues
ACF has instituted several mechanisms for ensuring internal and external coordination. Child Support reforms are being coordinated at several levels. The Office of Child Support Enforcement was a GPRA pilot and many of the PRWORA reforms have been integrated into the GPRA project activities. The GPRA process involves extensive consultation and collaboration with the CSE State partners. Additionally, there are child support implementation working groups for all the major reform activities under PRWORA. These groups are composed of Federal, State and local agency staff and also involve consultation with advocacy groups and national organizations.
DHHS has coordinated efforts to increase parental responsibility through promoting and encouraging father involvement through a Fathers’ Initiative that has representatives from all DHHS agencies. Meeting regularly to foster coordination and collaboration across DHHS, this group has developed working relationships with many non-governmental groups working to promote more father involvement in the lives of children. The faith-based community has been contacted to help in spreading the word on parental responsibility and child support services.
OCSE has partnered extensively with a range of Federal agencies/programs and State and local entities. The Expanded Federal Parent Locator Service employs data from the Social Security Administration and the Department of Labor in implementing the National Directory of New Hires and Federal Case Registry. Treasury’s Financial Management Service is a partner in the IRS Tax Refund Offset and the Administrative Payment Offset programs. The State Department is a partner in denying and revoking passports of individuals who meet certain delinquency criteria. OCSE has coordinated with numerous multi-state and in-state financial institutions to identify assets of non-custodial parents. OCSE has also collaborated with foundations, community-based organizations and State and local child support programs to launch demonstration projects in 10 sites to promote responsible fatherhood. These three year "fragile family" demonstrations, beginning in March 2000, will total $15 million including $10 million in Federal funding. Final evaluations will be completed one or two years after the demonstrations end.
In order to bring more resources toward holding non-custodial parents responsible, OCSE's Project Save Our Children (PSOC) has partnered with the Department of Justice, U.S. Attorneys, the FBI, the DHHS Inspector General, and numerous State and local law enforcement agencies. OCSE has reached out to the Department of Labor’s Welfare to Work program in order to secure funds to benefit non-custodial parent job training. OCSE has enlisted other ACF programs including Head Start, Foster Care and Child Care to educate clients about child support services. OCSE has collaborated with the domestic violence community to inform service providers of the importance of child support and to ensure the safety of victims seeking child support services.
Program-wide Performance
The OCSE Audit Office has completed all FY 1999 data reliability audits and issued final reports for all States except one where they issued an interim report. As of February 2001, all States have reported all or partial data on their FY 2000 performance. Data are currently being reviewed.
Collections (measure 3.1c): The total amount of child support distributed as current support in FY 1999 was $11.8 billion. The total amount of current support due in FY 1999 was $22.5 billion.
Expenditures (measure 3.1e): In FY 1999, total administrative expenditures were up 15.9 percent to $4.0 billion. Comparison to total collections of $15.8 billion yields a cost-effectiveness ratio of $3.92, a decrease of 2.0 percent from FY 1998. This is due to increased automated data processing expenditures that are expected to continue to increase.
OCSE has re-evaluated the projections for performance measures. The following circumstances warranted replacing the FY 1996 baseline (with the exception of the cost-effectiveness ratio) and establishing a new baseline using FY 1999 data.
Changes to Reporting System: OCSE recently made significant revisions to its statistical and financial reporting forms to reflect the goals and objectives of the strategic plan and the performance-based incentive funding system enacted by the Child Support Performance and Incentive Act of 1998 (CSPIA). The new forms added new data elements and revised definitions. In addition, Federal auditors have begun to assess the completeness and reliability of State-reported data. Specifically, auditors will review all statistical data used to calculate the measures that gauge State performance in paternities established, orders established, current support collections, and past-due collections. The only performance measure and data elements remaining largely unchanged during the transition from old to new reporting and incentive systems is the cost-effectiveness ratio. In addition, new statewide automated systems in over 44 States now report new data requirements more reliably with fewer errors and duplicated counts. Of the remaining States, Nebraska, Nevada and Ohio have indicated that they are compliant with ADP requirements but OCSE has not yet reviewed the documentation. California, Michigan, and South Carolina are not certified. It will be another two years before Michigan’s system will be completed. California and South Carolina should have their systems operational statewide in FY 2005 or 2006.
Statutory Evolution of the Program: The child support program has never been in a steady state. Significant legislation with new requirements and new collection tools has been enacted every few years through the 29-year history of the program. The capabilities and responsibilities of the program in 2002 are far greater than in 1995, prior to enactment of welfare reform. We believe comparison of past performance on these measures is not possible and would result in a comparison of "apples and oranges". Data definitions for FY 1999 - 2002 differ significantly from the past and have been prescribed by statute. For example, for incentive purposes, States may now exclude cases where they have no jurisdiction, such as those involving foreign countries and Indian tribes. In addition, the Child Support Performance and Incentive Act of 1998 divides collections into three new categories (current assistance, former assistance, and never assistance) which are integral to the incentive calculation and dramatically alter reporting systems. While the majority of the measures are new, the cost effectiveness ratio has been a traditional measure of the program. State-reported child support collections and program expenditures have been reported consistently and reliably for many years.
The FY 1999 - 2000 performance targets were very ambitious reflecting anticipation of results from a range of new collection tools and program improvements such as new hire reporting and increasing statewide automation. The strong economy augured well for collecting support from more employed non-custodial parents. But because these new collection tools had not been fully implemented, States failed to realize as large an increase in collections as expected, although collections of $17.9 billion were significant. Therefore, the FY 2001 and 2002 targets for measures 3.1b-c and 3.1e for have been adjusted downward from earlier projections based on the actual FY 1999 performance (data were not complete until December 2000).
Data Issues
State Automated Systems. States currently maintain information on the necessary data elements for the five program measures. Most States use an automated system to maintain this data, while a few maintain the data manually. All States were required to have a comprehensive, statewide, automated CSE system in place by October 1, 1997. 44 States currently meet this requirement. Continuing implementation of these systems, in conjunction with cleanup of case data, will improve the accuracy and consistency of reporting.
Data Completeness and Reliability. As part of OCSE’s certification of automated systems, their ability to produce valid data will be reviewed. Data reliability audits are conducted on an annual basis. Self-evaluation by States and OCSE audits will provide an on-going review of the validity of data input and the ability of automated systems to produce accurate data. There is a substantial time lag in data availability. The Audit Office has completed all FY 1999 audits and issued final reports for all States except for one State where they issued an interim report. As of February 2001, all States have reported all or partial data on their FY 2000 performance. The Audit Office has begun the FY 2000 audits and these should be completed during the summer of 2001. A Final Rule was published December 27, 2000 covering the requirements for the new performance-based incentive funding system, performance penalties, and standards for certain types of audits.
Summary Table
|
Performance Measures |
Targets |
Actual |
Reference | |
|
Program Goal: All children have parentage established Objective: Increase the number of paternities established, particularly those established within one year of birth. 3.1a. Increase the paternity establishment percentage (PEP) among children born out of wedlock. |
|
|
| |
|
*This percentage (106%) represents not only current paternity established cases but also includes completion of backlogs of older IV-D cases. | ||||
|
Program Goal: All children in IV-D cases have financial and medical support orders. Objective: Increase the percentage of IV-D cases with orders for financial support. 3.1b. Increase from the FY 99 baseline the percentage of IV-D cases having support orders. |
|
|
| |
|
Program Goal: All children in IV-D cases receive financial and medical support from both parents. Objective: Increase the collection rate. 3.1c. Increase from the FY 99 baseline the IV-D collection rate for current support. |
|
|
| |
|
Objective: Increase paying cases. 3.1d. Increase the percentage of paying cases among IV-D arrearage cases. |
|
|
| |
|
Objective: Make the process more efficient and responsive. 3.1e. Increase the cost-effectiveness ratio (total dollars collected
per $1 of expenditures). |
|
|
| |
|
Please refer to discussion "Changes in Reporting System"
providing the rationale for the use of FY 1999 as the baseline year for
these measures. | ||||
|
Total Funding (dollars in millions) See detailed Budget Linkage Table in Appendix 6 for line items included in funding totals. |
FY 02: $3933.8 |
Bx: budget just. sections B & L | ||
Performance Measures for FY 2002 and Final Measures for FY 2001.
The achievement of the performance targets will be significantly affected by a number of factors interacting with the CSE program in ways that help or hinder achievement of performance goals including: (1) the effect of State Temporary Assistance to Needy Families program structures and policies; (2) the 5-year time limit on TANF benefits which leaves child support as the linchpin for family self-sufficiency; (3) the health of the economy; (4) wage and unemployment rates; and (5) demographic and social trends such as divorce and non-marital birth rates. These, and other external factors, impact State agency caseloads, paternity establishment workloads, and ability to collect support payments.
States have organized their enforcement systems and infrastructures differently. Through its considerable national and regional technical assistance initiatives, many of which incorporate State self-assessment and peer technology transfers, ACF is customizing its efforts to individual State needs. Additionally, the new performance-based incentive process will add impetus to those States that may need to assign a higher priority to their child support programs.
The program objective statements listed below are part of the Office of Child Support’s multi-year Strategic Plan aimed at increasing overall performance. Annual measures are stated in terms consistent with the expected amount of increased or maintained performance. Performance projections for FY 2002 indicate that all five measures will remain relatively stable. One reason is continuing development of State automated systems, especially in States with large caseloads. ACF is unsure of the effect of certified automated systems operating in all 54 jurisdictions. While systems will allow for more effective child support enforcement in most performance areas, they are also likely to result in improved data reporting, which can alter current estimates of performance up or down. In addition, Data Reliability Audits will greatly assist in determining actual performance levels.
We are anticipating that performance will improve over time due to the phased-in implementation of incentives legislation which began in FY 2000. States’ performance should improve as a result of the incentives and the use of more reliable data systems. Almost all States are using automated systems; a few States may be developing their own systems. It is assumed that all States will be using the majority of enforcement tools resulting from enactment of the Personal Responsibility and Work Opportunity Reconciliation Act.
PROGRAM GOAL: All children have parentage established.
Objective: Increase the number of paternities established, particularly those established within one year of birth.
3.1a. FY 2001: Increase to 96.5% the paternity establishment percentage (PEP) among children born out of wedlock.
FY 2002: Increase to 97% the paternity establishment percentage (PEP) among children born out of wedlock.
Data source: The OCSE Form 157 is the source of data needed to calculate this measure.
This measure directly indicates achievement of the performance target by comparing paternities established during the fiscal year with the number of non-marital births during the preceding fiscal year. The statute allows States to use the IV-D PEP or a Statewide PEP. The Statewide PEP was selected because most States have indicated they will use the Statewide PEP as well. The rates above include paternities established by the IV-D program and paternities established by hospital-based programs. Maintaining the target rate in FY 2002 requires States to keep up with establishing paternities on out-of-wedlock births while continuing to handle backlogs of older IV-D cases needing paternity established.
Early interventions will be sought through expanding in-hospital based paternity establishment programs and partnering with birth record agencies, pre-natal clinics and other entities and encouraging voluntary acknowledgments, in accordance with the requirements of PRWORA. Partners will work together and with customers to help both parents understand their parental responsibilities and to promote establishing paternity in a non-adversarial manner wherever possible. In collaboration with partners and stakeholders, ACF will explore a variety of activities to help individuals better understand their parental responsibilities, including contributing to direct education programs in high schools, counseling, public awareness campaigns, public service announcements, and brochures about the CSE program. Technical assistance, training and education activities will be increased.
PROGRAM GOAL: All children in IV-D cases have financial and medical support orders.
Objective: Increase the percentage of IV-D cases with orders for financial support.
3.1b. FY 2001: Increase to 62% from the FY 1999 baseline the percentage of IV-D cases having support orders.
FY 2002: Increase to 64% from the FY 1999 baseline the percentage of IV-D cases having support orders.
Data source: The OCSE Form 157 is the source of data needed to calculate this measure.
A support order is needed to collect child support. This measure directly indicates achievement of the performance target by comparing the number of IV-D cases with support orders with the total number of IV-D cases. The FY 2001 target has been adjusted downward based on the actual performance in FY 1999 of 60%. We are projecting a slight increase in the target rate for FY 2002. This will require more effort as new child support cases are added to State workloads each year, increasing the overall caseload needing services.
PRWORA also gives States new tools to establish an order more quickly, such as administrative authority to require genetic testing, subpoena financial and other information, and to access a wide array of records. More States are voluntarily shifting from court-based to agency-based order establishment procedures. PRWORA requires expedited administrative procedures for the establishment of orders. PRWORA expands paternity acknowledgment programs to birth record agencies, which would set the stage for order establishment. PRWORA requires that all States enact the Uniform Interstate Family Support Act which grants States expansive long-arm jurisdiction allowing them to establish support orders against non-residents, thus avoiding the lengthy two-State process.
The Child Support Performance and Incentive Act of 1998 requires the Secretary of HHS to recommend a medical support indicator for inclusion in the new incentive system. The Secretary’s report to Congress in June 1999 recommended postponement of the development of an indicator until June 2001. OCSE is currently working with States to develop the medical support indicator.
PROGRAM GOAL: All children in IV-D cases receive financial and medical support from both parents.
Objective: Increase the collection rate.
3.1c. FY 2001: Increase to 54% from the FY 1999 baseline the IV-D collection rate for current support.
FY 2002: Increase to 55% from the FY 1999 baseline the IV-D collection rate for current support.
Data source: The OCSE Form 157 is the source of data needed to calculate this measure.
This measure, a proxy for the regular and timely payment of support, directly indicates achievement of the performance target by comparing total dollars collected for current support in IV-D cases with total dollars owed for current support in IV-D cases. The FY 2001 target rate has been adjusted downward based on the actual performance in FY 1999. We are projecting a slight increase in the target rate for FY 2002. This represents an increase in effort because State caseloads generally increase every year.
Focus will be placed on improved enforcement techniques emphasizing automated mechanisms for enforcement, collections and payments to families. ACF will emphasize improvement of numerous processes that result in the support of children. These improvements include: (1) simplifying the payment process; (2) reducing barriers to non-custodial parents providing support payments; (3) increasing the number of cases handled using automated systems; (4) using alternative disposition strategies such as consensual agreements and other non-judicial agreements; (5) improving interstate case processing; (6) increasing coordination and integration of services with other agencies; and (7) increasing access to services.
PRWORA gives States new tools to increase collection of support, such as license revocation, new hire reporting, centralized collection and disbursement, enhancement of wage withholding procedures, and uniform procedures for interstate cases.
Objective: Increase paying cases.
3.1d. FY 2001: Increase to 54.5% the percentage of paying cases among IV-D arrearage cases.
FY 2002: Increase to 55% the percentage of paying cases among IV-D arrearage cases.
Data source: The OCSE Form 157 is the source of data needed to calculate this measure.
This measure directly indicates achievement of the performance target by comparing the total number of IV-D cases paying any amount toward arrears with the total number of IV-D cases with arrears due. More direct measurement of a national arrearage collection rate was not possible because States have laws that count arrears in widely varying ways. Some new cases enter the caseload with arrearages already accrued before the State can take any action. This measure, developed by the State/Federal Incentive Formula effort, has been incorporated into the revised FY 2000-2004 Strategic Plan.
Obtaining payment of arrears is often difficult. States must collect both current support and any accrued arrearages. Non-custodial parents often cannot keep up with both current support and arrears, hence arrears payments suffer. Focus will be placed on improved enforcement techniques emphasizing automated mechanisms for enforcement, collections and payments to families. ACF will emphasize improvement of numerous other processes that result in the support of children, including (1) simplifying the payment process; (2) reducing barriers to non-custodial parents providing support payments; (3) increasing the number of cases handled using automated systems; (4) using alternative disposition strategies such as consensual agreements and other non-judicial agreements; (5) improving interstate case processing; (6) increasing coordination and integration of services with other agencies; and (7) increasing access to services. PRWORA gives States new tools to increase collection of support such as license revocation, new hire reporting, centralized collection and disbursement, and uniform procedures for interstate cases. Other collection techniques aimed at arrears include administrative offset and seizing assets held in financial institutions.
Objective: Make the process more efficient and responsive.
3.1e. FY 2001: Maintain the cost-effectiveness ratio (total dollars collected per $1 of expenditures) from the FY 1999 baseline at $4.00.
FY 2002: Increase the cost-effectiveness ratio (total dollars collected per $1 of expenditures) to $4.20.
Data sources: The OCSE Form 34A and 396A are the source of data needed to calculate this measure.
This measure directly indicates achievement of the performance target by comparing total IV-D dollars collected by States with total IV-D dollars expended by States. Maintaining the target rate for FY 2002 requires more work because State caseloads and the total amount of child support owed increase each year.
Under current law, cost effectiveness is being phased out as the sole determinant for incentive payments. It is important to monitor the allowable costs of the program in relation to the amount collected. Focus will be placed on increased efficiency of State programs through automated systems of case management, enforcement, collection and disbursement, staffing, administrative processes and increased collections resulting from approaches described previously under current collections and arrears cases paying. Federal audits will focus on administrative costs to ensure States do not shift costs from block grants to matching programs.
OCSE is continuing an internal tactical planning process to align Federal operations with the National Strategic Plan. OCSE has collaborated with State partners to revise and update the National Child Support Enforcement Strategic Plan for FY 2000-2004. OCSE has employed a partnership approach in all major services it provides to States. For example, the development of the new hire reporting system, incentive funding proposal, and technical assistance and training plans have all been developed collaboratively with State partners through State/Federal work groups.
|
4. Increase affordable child care Approach for the Strategic Objective: Increase access to affordable, quality child care for low income, working families. |
Program Description, Context, Legislative Intent, and Broad Program Goals
The Child Care and Development Fund (CCDF) was established under the Personal Responsibility and Work Opportunity Reconciliation Act (PRWORA) of 1996 to help working low-income families achieve and maintain economic self-sufficiency and to improve the overall quality of child care. PRWORA repealed the three title IV-A child care programs and replaced them with new funding administered under the revised Child Care and Development Block Grant (CCDBG) rules and regulations (Section 418 of the Social Security Act).
CCDF is comprised of three funding streams: the mandatory, matching, and discretionary funds. The mandatory and matching funds are appropriated for fiscal years 1997 through 2002 under section 418 of the Social Security Act. A State's share of the mandatory funds is tied to its spending under the now-repealed AFDC-related child care programs. To receive its share of the matching funds, a State must match the matching funds at the current Medicaid rate, demonstrate maintenance of effort (MOE), and obligate its mandatory funds. The discretionary fund, also referred to as the Child Care and Development Block Grant, is appropriated annually by Congress. Discretionary funds are allotted to States based on a formula that takes into account the proportion of children under age five, children who receive free or reduced price school lunches, and per capita income. The FY 2002 request for the Child Care and Development Block Grant includes a request for $200 million increase in CCDBG funds and a new $400 million set aside in the appropriation for use by the States to provide certificates for low-income parents to help defray the costs of after school programs with an education focus. Combined, these funds will provide child care for an estimated 2.6 million low-income children.
States are required to spend at least four percent of their CCDF funds on activities to improve the quality and availability of child care. In addition, Congress has earmarked small amounts of the discretionary fund to be used by States for school-age care and resource and referral services, improved quality, and expanding the availability of quality infant and toddler care. The funds are provided in formula grants to States which have the authority to make many of the decisions about priorities, policies, and expenditures in achieving goals related to improved family access to quality child care within the parameters of the Federal statute and regulations. Since there is now a single Federal child care program operating under one set of rules, States have the flexibility to serve all families through a single, integrated child care system.
Under the statute governing CCDF, eligible children are defined as those whose parents are working or in education or training, or who are in need of protective services. Children must be under age 13 and reside with a family whose income does not exceed 85 percent of the State's median income (SMI) for that size family. States may serve children age 13 and over who are under court supervision or are mentally or physically incapable of self care. States must spend 70 percent of their CCDF monies to provide child care services for families on or transitioning off Temporary Assistance for Needy Families (TANF) or at-risk of welfare dependency. States are also required to give priority to children with special needs and to children from very low-income families.
In their biennial plans to ACF, States must provide information concerning policy issues such as family eligibility limits, sliding fee scales, provider reimbursement rates, provider health and safety requirements, and activities to improve the quality and availability of care.
Access to quality, affordable child care is critical to achieving self-sufficiency by welfare clients. Child care subsidies also help the working poor remain self-sufficient. In Child Care: Child Care Subsidies Increase the Likelihood that Low-Income Mothers Will Work, GAO analyzed the trade-offs low-income mothers confront when they want to work but face high child care costs. According to that study, child care subsidies are often a strong factor in a parent’s ability to work, and reducing child care costs increases the likelihood that poor and near-poor mothers will be able to work. The GAO observed that affordable child care is a decisive factor that encourages low-income mothers to seek and maintain employment.
ACF will continue to promote expansion of child care services as a key element in its strategy for helping families achieve economic independence. Doing so will involve working with our partners to increase the supply of child care, to develop measures and supports for child care quality, and to provide information to help parents make sound choices about child care.
In addition, partnerships among child care providers, Head Start, public and private early childhood education, health, nutrition, mental health, and parental employment preparation are essential to meeting the needs of young children and their families. To this end, ACF continues to encourage collaboration at the Federal, State, and individual program levels.
Program Activities, Strategies, and Resources
Child care funding available to States has increased in recent years. In FY 1999, $3.2 billion was available through CCDF. In addition in FY 1999, States transferred a cumulative total of $2.44 billion of Federal funds from the TANF program to the Child Care and Development Fund, more than triple the $802 million transferred in FY 1998. Also in FY 1999, State spending through the TANF program on child care services totaled $1.99 billion, including $1.38 billion maintenance of effort funds and $604 million Federal funds.
Despite increased funding, existing resources are inadequate to meet the growing need for child care assistance. On October 19, 1999, DHHS released a report stating that nationally, in an average month in 1998, only 1.5 million of the 9.9 million low and moderate-income children eligible for CCDF assistance actually received help through the program--just 15 percent of children eligible under State criteria. The gap between eligibility and receipt of services would have been even greater if States had chosen to define the eligible population to include all of the low and moderate-income working families potentially eligible under Federal law. If States had set their eligibility at 85 percent of the SMI, the maximum allowed under Federal law, an estimated 14.7 million children would have been eligible for subsidies in 1999. Of that number, only 1.76 million children (12 percent) eligible under Federal law in FY 1999 were served. A continuing challenge is to reach the remaining 13 million children (88%) who are eligible for child care subsidies under Federal rules.
The recent National Study of Child Care for Low-Income Families, State and Community Substudy, confirmed that even when additional State funds are included, many children still go unserved. The study also reported that, with the strong economy and more parents working, States were spending significantly more on child care, with a median increase of 78 percent from 1997 to 1999 in the States studied. Yet, a survey of 17 States showed that those States were only able to serve 15 to 20 percent of federally eligible children in 1999. The study, prepared by Abt Associates, Inc. for DHHS, also reported waiting lists in 12 of the 17 States.
Confronted with great unmet need and finite resources, many States are forced to make policy choices that focus assistance on certain families while excluding other parents who may be struggling to hold onto a modest job without turning to welfare for help. Many States report that due to limited subsidy resources, thousands of low-income working families are on waiting lists for child care subsidies. Only nine States and Territories set their eligibility limits at the maximum allowed under Federal law, while another nine set maximum eligibility below 50 percent of the SMI. As a result, a family of three earning as little as $17,332 a year, may have too much income to be eligible for child care assistance. States also stretch dollars by establishing low payment rates to providers, which can limit families’ ability to access quality care, or by setting high family co-payment rates that may be difficult for families to afford. Almost half of the States allow providers to charge additional out-of-pocket costs to parents to make up for low reimbursement rates.
Since the passage of PRWORA, ACF has spent over $7 million per year in technical assistance to improve grantees' ability to increase the accessibility, affordability, and quality of child care. This includes targeted technical assistance and support to States in systems development, with particular emphasis on helping States meet requirements for Federal reporting and consumer education.
Methods of technical assistance related to systems development include software utilities for data providers, computer-based training, and site visits to "trouble-shoot" systems problems. Other methods include a web site and a toll free hotline, training workshops at regional meetings, and national child care data quality meetings. The Bureau's goal is to support States’ efforts to collect, report, and manage child care data to improve its quality. Despite these intensive technical assistance efforts, States and Territories continue to experience CCDF data reporting problems.
Other technical assistance includes assisting States to develop inclusion initiatives for children with disabilities, building partnerships with the private sector, and establishing successful linkages between child care programs and programs such as health services, early childhood education, and Head Start.
ACF’s Child Care Bureau (CCB) employs a variety of methods and processes to support State efforts including: consultation, peer consultation, training opportunities, development of written materials, State child care administrator meetings and leadership forums, conference calls, on-site technical assistance, and distributing information memoranda. In FY 2000, separate leadership forums have focused on child care issues faced by rural communities and Hispanic families. Memoranda have provided information to States on models for child care, Head Start, pre-kindergarten partnerships, eligibility periods for child care subsidies, and options for expenditure of quality and earmarked funds.
Through a listserv established by the CCB, State child care administrators communicate with each other, providing peer consultation on emerging child care policy issues. There are presently 162 members on the listserv including child care administrators and Federal staff. From April 3 -- February 6, 2001, they exchanged 365 messages. Among topics discussed were: eligibility rates, use of social security numbers, immigrants, special needs children, licensing, interactive websites for subsidy applications, employer contributions and child care subsidies, advance payments to child care providers, slot-based contracts, payment policies related to child absences, State administrative structures, mobile training for providers, and the use of TANF monies for child care.
ACF's Regional Offices support State efforts in developing their child care programs. In connection with its regional child care administrator's meeting, Region III developed a "Back-to-Basics" notebook. The notebook included regional State profiles, CCB information, CCDF Program Instructions and Information Memoranda, policy interpretations, data tables and charts from State annual reports, and a matrix that summarized State policies and practices. Region VIII recently developed a research notebook and distributed it to its six State child care administrators. The notebook includes copies of recent journal and professional articles. Region VIII established a Regional Early Childhood Council (RECC) consisting of approximately 40 child care, Head Start, and other early childhood representatives from the six States. The Council meets quarterly to develop and implement strategies to address issues relevant to Region VIII States. The RECC used ACF's performance outcome measures and the CCB's Results Map (an internal management tool used to guide work and direct resources) to plan its recent regional conference. The Results Map served as a framework to articulate the Bureau's mission-critical objectives and to focus work to achieve outcomes. Included in the Results Map were future-oriented, outcome-driven statements that challenged the Bureau toward innovation and collaboration across organizational boundaries.
All of the ACF Regional Offices sponsor multiple child care meetings throughout each fiscal year. Planning for these meetings involves State child care administrators and CCB regional liaisons and technical assistance specialists. To respond to the emerging needs of States, the focus of regional conferences varies. The Region VI Mid-Winter Leadership Conference included a full day devoted exclusively to State child care administrators who identified and discussed ways to enhance child care quality and quantity. The two primary issues that were discussed were public-private partnerships and providing child care in rural areas.
With the FY 2000 CCDF set-aside of $10 million for child care research, the CCB awarded a 30-month contract to develop the National Child Care Research Collaboration and Archive in September 2000. The archive will help improve the quality of child care research, make data more accessible to researchers for analysis, and assist key constituencies to make better use of research findings. The Bureau is also participating in an interagency collaboration with the National Institutes of Child Health and Human Development and other Federal partners. This collaboration, referred to as the Science and Ecology of Early Development, brings together interdisciplinary approaches and multiple partners to better understand the earliest years of life.
Through its Child Care Policy Research Consortium, the CCB provides support to research partnerships composed of State administrators, researchers, and practitioners. The Consortium conducts child care research relating to the many policy decisions States must consider on a daily basis. In FY 2000, the CCB added four new research partnerships to the Consortium, increasing the membership from 13 to 22 States. Studies in progress are examining the duration of subsidies and child care arrangements across eight States, the comparison between child outcomes and parent and expert assessments of quality child care, and the effects of welfare reform on child care supply, parental choices, and economic self-sufficiency of low-income families.
The Bureau also awarded twelve grants to conduct field initiated child care research. This research will provide the CCB with critically needed information on child care and its effects on child development and family well-being, and will help to develop innovative strategies to meet the needs of low-income families struggling to afford quality child care for their children. The broad topics of this research include: quality issues, child outcomes, parental choice, cost, welfare and work issues, subsidy use, child care workforce factors, cultural issues, special populations such as infants and toddlers and children with special needs, kith and kin care, family child care, and administrative issues. In addition, the CCB awarded five grants to individual doctoral students to complete their dissertation research in child care and funded one research fellowship through the Society for Research in Child Development.
Congress included a $10 million earmark for child care research in its FY 2001 appropriations. The CCB plans to continue projects initiated in FY 2000 and is exploring the possibility of launching several new projects. These include a national study of child care demand and supply, child care policy demonstrations to examine how State policies are evolving to meet the changing needs of families under welfare reform.
Program Coordination, Partnerships, and Crosscutting Issues
Quality early childhood programs provide a crucial linkage for comprehensive, healthy child development to prepare children to be successful in school and later in life. Quality programs also provide needed supports to parents who are moving toward self-sufficiency through training and work. Recognizing the importance of comprehensive services, ACF encourages its State partners to create linkages between child care and health, family support, early childhood education, and other services at the State and community levels.
ACF continues to collaborate at the Federal level to facilitate community-level coordination. This includes coordination within ACF among the CCB, TANF, Head Start, Office of Child Support Enforcement, Office of Refugee Resettlement, and the Administration on Developmental Disabilities. For example, the Child Care and Head Start Bureaus jointly sponsor the QUILT (Quality in Linking Together) project that provides assistance to Head Start and child care grantees on successful ways to form program partnerships. In addition, the Child Care and Head Start Bureaus worked with the Department of Education to sponsor the first-ever national leadership forum on child care, Head Start, and pre-kindergarten. The forum, designed to promote State and local collaboration among early childhood programs toward full-day, full-year services for children and families, involved teams from 21 States and the District of Columbia.
Within DHHS, CCB participates with the Maternal and Child Health Bureau to sponsor the Healthy Child Care America Campaign, aimed at improving health and safety in child care by creating strong linkages between the child care and health communities. Externally, ACF continues to partner with the Department of Labor’s Welfare-to-Work grants program, States (both individually and through national associations such as the American Public Human Services Association and the National Governors’ Association), various national child care associations, and with the research community (e.g., the Child Care Research Consortium, funded by DHHS). Special efforts are underway to foster partnerships between the private and the public sector. The CCB-sponsored Partnerships Project has provided technical assistance to States and local communities in building coalitions and designing funding strategies involving both public and private entities.
Program-wide Performance
The number of children served through the Child Care and Development Fund will have grown from 1.51 million in FY 1998 to a projected target of 1.92 million in FY 2000 (measure 4.1a). In FY 1999, one-half of the 1.76 million children served were preschoolers between two and six years, 15 percent were infants and toddlers, and 35 percent were school age. Seventy-three percent of the children served were in care regulated under State or local law and 27 percent were in care operating legally without regulation. Relatives cared for 63% of the children in non-regulated care. CCDF regulations require all providers, except certain relatives, to meet basic health and safety standards.
CCDF grantees were to submit final program data reports for FY 1999 by December 31, 1999. While the CCB expected that performance data for FY 1999 would be available by April 30, 2000, two States and three Territories have not yet submitted complete FY 1999 data as of February 2001. California, which receives 11 percent of the CCDF monies and serves an estimated 13 percent of the children served through CCDF, has submitted only three months of FY 1999 data. For purposes of this report, FY 1999 child and family counts for that State have been extrapolated from financial data provided on the ACF-696 reporting form.
The final FY 2000 program data reports were due from the CCDF grantees on December 31, 2000. April 30, 2001 is the Bureau's forecasted date for the availability of the FY 2000 performance data. However, as of February 5, 2001, the CCB has not received final data reports from nine States and five Territories. One of these States, cited above, has not submitted any FY 2000 data. In addition, work is underway to verify the accuracy of the performance data from several other States. For the reasons listed, aggregate FY 2000 data from the CCDF grantees would be unreliable and incomplete.
CCDF grantees have many efforts underway to improve access to child care for low-income families. As work continues in partnership with States to improve data collection, a number of indicators, including informal feedback from grantees, indicate that access to child care for low-income children served by CCDF is increasing. For example, because some States have reduced the level of parent co-payments or have set lower co-payment amounts for the very lowest income families, more families can afford to participate in the program (measure 4.1c). In their FY 2000-2001 State Plans, 43 States and Territories (86 percent) reported waiving co-pays for some or all families at or below the poverty level. Twelve States said that all families with income at or below the poverty level are exempt from co-pays. An additional 31 States indicated that only some families at or below the poverty level must pay a fee.
In developing early childhood programs, States and communities together craft resources from a variety of sources, including the Child Care and Development Fund, TANF, Head Start, Early Head Start, Social Services Block Grant, Title I, Even Start, the USDA Child and Adult Care Food Program, State funded pre-kindergarten programs, other State and local funding sources, foundations, charities, and businesses. Collaboration builds on the strengths of each program and blends them together in a coordinated fashion to benefit both children and their families. Collaboration benefits children by promoting continuity in services from infancy through school-age and benefits the parents by ensuring that early childhood programs support work.
In the FY 2000 -- 2001 State Plans, 28 States and territories reported that their Lead Agency works in partnership with the entity responsible for administering State TANF funds. Eleven States indicated that they have developed a single, "seamless" system for administering child care subsidies to all families without regard to their eligibility category. Seventeen States said they have developed initiatives to promote "one-stop shopping" in which TANF recipients can receive child care and other benefits at a single location or to ensure effective referrals or linkages among the agencies that administer child care and TANF cash benefits.
Twenty-five States report collaborating with the State Education Department or another public or private entity to expand services for school-age children. Thirty-seven States work collaboratively with their State Health Department. In an increasing number of States, collaboration involves outreach on health and safety issues to child care providers and efforts to inform low-income families about the availability of subsidized health care. In their plans, 46 States described collaborative efforts with Head Start and 25 reported joint efforts to promote early intervention for children with developmental disabilities. Twenty-six State Lead Agencies reported active collaborations with tribal communities to improve service delivery to dually eligible children.
As demonstrated in the discussion of child care quality under Strategic Goal 2, Objective 5, States have an exciting array of initiatives in progress to improve the quality of child care. States report a range of activities including comprehensive consumer education for parents, grants and loans to expand the supply and quality of child care, efforts to support the professional development and compensation of child care workers, and partnerships with business, health, and education to enhance the availability of quality child care.
Data Issues
The Federal Child Care Information System (FCCIS) collects all aggregate and case-level data from the 50 States, the District of Columbia, Puerto Rico and the Territories of American Samoa, the Commonwealth of the Northern Mariana Islands, Guam, and the Virgin Islands as required in the statute for the Child Care and Development Fund program. States are responsible for compiling aggregate data at the State level and transmitting it electronically via the Internet to the FCCIS. (For the majority of States this is done through an automated child care information system).
All data received by the FCCIS are stored in a national data set. Data standards have been set and training and technical assistance has been provided to all States and Territories on reporting requirements and submission procedures. Upon receiving child care data, the FCCIS notifies States that their transmission was successful. It also performs a series of checks to determine whether the data meet data quality standards. A data quality assessment is provided to give feedback on missing, out-of-range, and internally inconsistent data. Data failing to meet quality standards are marked as either suspect or unacceptable and listed in detailed data quality reports sent to States and personnel within ACF. Data marked as unacceptable are cleaned or eliminated from analysis.
Throughout FY 2001, the CCB will continue to expand technical assistance designed to improve data submission and data quality. These activities include: on-site technical assistance visits; distribution of technical assistance documents; enhancements to the TA Tracker software; training workshops; and software to assist Tribes with data collection and administering their subsidy programs.
The Child Care Automation Resource Center (CCARC) is the "user interface" for the Bureau’s CCIS Technical Assistance Project (CCISTAP). States may access the CCARC through a hotline or its website, to obtain assistance such as fixing reporting problems, and locating documents, software, or other materials produced by the Center. All requests for technical assistance are logged and tracked until issues are resolved.
States continuing to experience difficulties collecting and transmitting required data will receive additional on-site technical assistance. State reporting performance will be monitored with the use of historical information. Factors to be examined include: electronic transmission anomalies; timeliness of submissions; data quality reports; adequacy of sample size and sample bias; correspondence between the values reported in the monthly ACF-801 and annual ACF-800 reports, spurious values (e.g., all records report a single value for a given data element); and month-to-month trend data to identify any sudden or significant changes in data characteristics. Candidates for site visits will be selected from States based on need. ACF Regional Offices will actively participate throughout the process. Available financial resources will support on-site technical assistance visits to 10 States.
In FY 2001, enhancements to the existing TA Tracker Software support the transmission of data files. The planned improvements will automate the existing process with results being posted to the CCARC website. States are able to review the results of their data submission at the website to determine whether any transmission difficulties occurred. The TA Tracker automatically generates a message to the CCARC when problems occur with a data file. Technical assistance specialists then investigate the problem and work with the States to solve the transmission problem.
CCB will also sponsor approximately 20 workshops and training sessions for States throughout FY 2001. Presentations will focus on major reporting issues and system problems. In addition, a maximum of five technical papers on data quality, sampling procedures, performance measures, optional data elements, and reporting issues will be written in FY 2001. Five technical briefs will also be written to assist States with automation issues.
While CCB uses data from sources other than its grantees, the majority of the data it collects are from States. CCB faces various data challenges, both internal and external, that include, but are not limited to: late submission of data; incomplete data submissions; systems problems; quality controls; and technological delays. In addition, statutory authority limits the type of data the Bureau is able to collect from States. State flexibility under the statute has led to great variation in State regulations, policies, and standards resulting in challenges for the CCB to produce complete, accurate, and consistent aggregate data. These challenges affect not only the comprehensiveness of the data available for reporting but also the reliability and validity of the data.
Demands for child care subsidies have limited the ability of States to commit funds for systems development. Twenty States have not used any CCDF monies for information systems development. Several States have experienced systems problems that have affected their data submission. Some of these States have experienced total system "crashes" while others are converting to new systems. Other States lack a single integrated system, and, therefore, must collect and aggregate data from several information systems. Some States have no State system and rely solely on local data systems. States with systems problems such as these are often unable to monitor or correct data errors. In addition, due to Y2K priorities, a few States were unable to modify their systems to collect the required CCDF data elements. As stated earlier, CCB continues actively to facilitate States’ compliance with CCDF reporting requirements.
Summary Table
In the performance plan submitted in previous years, ACF identified proxy performance measures addressing the three goals of the CCDF--affordability, availability, and quality of child care. The process of developing actual measures was completed in September 1999 and the current measures listed below replace the proxy measures used as placeholders in earlier reports. Working in partnership with the States, the CCB provided FY 1999 baseline data for these performance measures in December 2000.
|
Performance Measures |
Targets |
Actual |
Reference | |
|
Program Goal: Increase the number of children of low income working families and families in training and education who have access to affordable child care. 4.1a. Increase the number of children served by CCDF subsidies from the 1998 baseline average. (Revised: formerly "receiving subsidized child care") (target number expressed in millions) |
|
|
| |
|
4.1b. Increase the percentage of potentially eligible children who receive CCDF subsidies from the FY 1998 baseline. |
FY 02: 13% |
FY 02: |
Px M-78 | |
|
4.1c. Reduce the average percentage of family income spent in assessed child care co-payments among families receiving CCDF subsidies to the FY 1998 level and maintain at that level. |
FY 02: 5.8% |
FY 02: |
Px M-78 | |
|
4.1d. Increase the number of slots in State regulated child care settings from the FY 2000 baseline. (Developmental--NOTE: This measure is not limited to subsidized child care slots.) |
FY 02: |
FY 02: |
Px M-79 | |
|
4.1e. Increase the number of families working and/or pursuing training/education with support of CCDF subsidies from the FY 1998 baseline. (target number expressed in millions) |
FY 02: 1.2 |
FY 02: |
Px M-79 | |
|
Availability of Data for FY 2000 Performance
Report: FY 2000 Data is due from States December
31, 2000. FY 2000 Actual Performance should be available April 30,
2001. | ||||
|
Total Funding for Child Care Programs (dollars in millions) See detailed Budget Linkage Table in Appendix 6 for line items included in funding totals. |
FY 02: $4916.9 |
Bx: budget just. sections G & K Px: page # performance plan | ||
Performance Measures for FY 2002 and Final Measures for FY 2001
Child Care and Development Fund (CCDF) final regulations were released in July of 1998. ACF began developing child care performance goals and performance outcome, output, and process measures shortly after the final regulations were released and continued to refine the measures in FY 1999. The Child Care Bureau discussed the goals and measures at two national conferences, via 10 telephone conferences, written communications, and in other meetings with its partners in the States, Territories, and Tribes over the past year. The current set of appropriate, achievable program goals and measures was developed through this consensus-building process that incorporated significant opportunities for input from stakeholders. Data for many measures are available through existing reports that State grantees are required to submit on an on-going basis.
With regard to specific performance measures, while the number and percentage of potentially eligible children receiving subsidized child care (measure 4.1a) are outputs of the number of budget dollars invested (inputs), these quantities are results-oriented because the availability of child care subsidies directly supports self-sufficiency programs. An adequate supply of child care is an important intermediate stage to improving family economic independence and a continuing necessity for sustaining such independence. ACF has also worked to develop outcome measures for both the affordability and the supply of care. One is the co-payment measure (measure 4.1c) reflecting State efforts to support families gradually becoming more self-reliant by assuring that child care costs do not consume an excessive share of family income. Measure 4.1d is an indicator of the general supply of regulated child care available in the market.
PROGRAM GOAL: Increase the number of low income working families and families in training and education who have access to affordable child care.
Objective: Increase the use of subsidies for child care services for low-income working families
4.1a. FY 2001: Increase the number of children to 2.1 million served by CCDF subsidies from the FY 1998 baseline of average 1.51 million children served per month.
FY 2002: Increase the number of children to 2.6 million served by CCDF subsidies from the FY 1998 baseline of average 1.51 million children served per month.
4.1b. FY 2001: Increase the percentage of potentially eligible children who receive CCDF subsidies to 12.5 percent from the 1998 baseline of 10%.
FY 2002: Increase the percentage of potentially eligible children who receive CCDF subsidies to 13 percent from the 1998 baseline of 10%
Data sources: Annual Aggregate Report, ACF-800, Child Care Quarterly Case-Level Report, ACF-801.
The performance measure 4.1a is the average number of children receiving services each month. The number of children served is directly related to the funding provided to the State grantees. The FY 2001 target reflects the increased discretionary funding ($817 million) provided by Congress for FY 2001; the projected increase in the FY 2002 target reflects requested increases in matching, mandatory and discretionary funding. Measure 4.1b indicates the number of children served through CCDF as a percentage of those potentially eligible for services based on family income, child’s age, and parent employment status.
Measure 4.1b is inter-related with measures 4.1c-e that track the amount of co-pay charged to parents and other State-determined policies such as eligibility criteria and provider payments. It is also related to quality measures 5.1a-c under Strategic Objective 5 since costs associated with increased quality have the potential to reduce the number of children receiving services.
PROGRAM GOAL: Improve access to affordable quality child care
Objective: Improve the affordability of quality child care for families through family co-pays that are reasonable.
4.1c. FY 2001: Reduce the average percentage of family income spent in assessed child care co-payments among families receiving CCDF subsidies to the FY 1998 level of 5.8 percent and maintain that level.
FY 2002: Maintain at 5.8 percent the average percentage of family income spent in assessed child care co-payments among families receiving CCDF subsidies.
Data sources: Child Care Quarterly Case-Level Report, ACF-801
The above performance measure calculates the affordability of child care for families served by expressing the out-of-pocket cost as a percentage of family income. While the goal is not the total elimination of family co-payments for child care services for families receiving CCDF subsidies, it is to ensure that co-payments are affordable for families. The desired outcome is to reduce the average child care co-payment to the FY 1998 level and then to maintain it at that level. Maintaining the amount of family income spent in child care co-payments at 5.8 percent in an environment of increasing child-care costs is an ambitious target.
PROGRAM GOAL: Improve the availability of child care facilities.
Objective: Increase the availability of regulated child care.
4.1d. FY 2001: Increase the number of slots in state regulated child care setting. (Developmental--Note: This measure is not limited to subsidized child care slots.)
FY 2002: Increase the number of slots in state regulated child care setting. (Developmental--Note: This measure is not limited to subsidized child care slots.)
Data source: Under development. The number of regulated child care slots is included as an optional data element for the annual aggregate ACF-800 data collection. States were asked to provide this information on a voluntary basis in the aggregate reports that were due December 31, 2000. Data should be available April 2001 for this measure.
In addition to the issues of whether low-income families can afford child care services, the presence of child care services in the open market is a basic but important indicator of accessibility of services. Performance measure 4.1d addresses the availability of regulated child care slots in the market.
PROGRAM GOAL: Improve parental ability to work or attend training/education leading to greater economic productivity.
Objective: Increase the use of child care subsidies to assist working families.
4.1e. FY 2001: Increase the number of families working and/or pursuing training/education with support of CCDF subsidies to 1.1 million from the FY 1998 baseline of 802,000.
FY 2002: Increase the number of families working and/or pursuing training/education with support of CCDF subsidies to 1.2 million from the FY 1998 baseline of 802,000.
Data source: Child Care Quarterly Case Level Report, ACF 801, Item #6, Response 1, 2, or 3.
A primary goal of CCDF is to assist low-income families in accessing child care to enable parents to work or attend training/education enabling them to become independent from public assistance. This performance measure is targeted toward increasing the numbers of families served.
|
IMPROVE HEALTHY DEVELOPMENT, SAFETY AND WELL-BEING OF CHILDREN AND YOUTH |
Rationale
The future of the Nation--its democracy, the economy, and the social fabric--depends upon how America protects and nurtures its children. Critical indicators of child well being include health status, educational attainment, economic status, family structure, quality of early childhood development experiences, safety, and stability. Head Start, child care, child welfare, and youth programs together provide a broad range of services that contribute to the economic and emotional security, health, safety, and stability of home environments while providing stimulating learning experiences for children and youth. In addition to working to ensure safety and security for children served by the child welfare system, ACF will continue to provide leadership and support for public and private nonprofit programs across the Nation that shelter runaway and homeless youth, reuniting them with their families whenever possible, and assisting them to make satisfactory transitions to independence when necessary. ACF is committed to helping these "older children" effectively meet the challenges of adolescence and development into adulthood.
Increases in foster care placements or the need for child abuse interventions may be associated with increased stresses on families from economic hard times. Certain measures may be affected by national policy and practice debates such as whether family reunification or termination of parental rights is in the best interest of an at-risk child. The ability of families to provide good parenting may also be affected by the availability of resources outside of ACF's purview, such as housing, mental health, or substance abuse services. ACF and its partners depend on other programs to provide ancillary services for low-income families and youth in crisis, but these services are often limited or unavailable.
The objectives and major program areas under this goal are:
5. Increase the quality of child care to promote childhood development
Child Care: Quality
Head Start
6. Improve the health status of children
Head Start: Health Status
7. Increase safety, permanency, and well being of children and youth
Child Welfare
Developmental Disabilities: Education
Developmental Disabilities: Health
Youth Programs
Program Description, Context, Legislative Intent and Broad Program Goals
In our efforts to break the cycle of poverty and dependency, it is essential to focus both on parents and the next generation. Parents are more likely to succeed in employment and self-sufficiency if they have confidence in their child care arrangements. Beyond issues of health and safety, child care impacts the cognitive, emotional, and social development of children.
Research has begun to document the most important early influences on children’s development and factors which contribute to the quality of early child care. For example, the National Institute for Child Health and Human Development (NICHD) study of early child care, When Child-Care Classrooms Meet Recommended Guidelines for Quality (1998), shows that children attending centers meeting professional standards for quality score higher on school-readiness and language tests and have fewer behavioral problems than their peers in centers not meeting such standards. The study found that children fared better when child-staff ratios were lower and teachers had more training and education. Similarly, a four-year follow-up of children studied in the 1995 Cost, Quality, and Child Outcomes Study, as well as the Carolina Abecedarian Program Study, show positive long-range effects of quality early childhood services.
ACF works with State administrators, professional groups, service providers, and others to identify elements of quality and appropriate measures; to inform States, professional organizations, and parents about the constituents of child care quality; to influence the training and credentialing of child care workers and accreditation of child care facilities; to improve linkages with health care services and with Head Start; and to take steps to improve the quality of child care nationally.
(See also information under Strategic Goal 1, Child Care Affordability.)
Program Activities, Strategies and Resources
Infants and toddlers have been specifically designated as a priority for special attention in all ACF programs. The CCB will work to expand partnerships with States and among early childhood programs to improve quality in early care and education. Close cooperation with Early Head Start is underway to address these populations and to increase the number of infants and toddlers being served by quality early childhood programs. Other activities will focus on building capacity in the field and among Federal staff. In addition, the results of new research grants awarded by the CCB will be used to improve services for infants and toddlers and to demonstrate the impact of quality early care.
At present, States are required to spend at least four percent of CCDF funds to improve the quality of child care and offer additional services to parents, such as resource and referral counseling on selecting appropriate child care providers to meet their child's needs. In addition to the four percent, earmarks for infant and toddler care, quality improvements, school-age care, and resource and referral, must be used by States in targeted ways to improve quality and access.
As described under Strategic Goal 1, Child Care Affordability, the CCB actively provides technical assistance and support to grantees in implementing CCDF. Directly, and through its technical assistance contractors, the CCB provides information to States about successful programs and models, offers on-site consultation, facilitates exchanges among peers, and sponsors meetings, conference calls, and conferences designed to offer training and peer linkages. In partnership with DHHS’ Maternal and Child Health Bureau, the CCB sponsors the Healthy Child Care America campaign to develop and strengthen linkages between child care providers, health professionals, and families, and ultimately to improve the health and safety of children in child care settings. In addition, the Bureau has sponsored national forums on using technology to support improved quality in child care, collaboration among early childhood programs, building public/private partnerships, and other related topics.
Program Coordination, Partnerships, and Crosscutting Issues
One key strategy for improving the quality of care, as well as its affordability and availability, is to create linkages between CCDF, early childhood programs, and other agencies that provide crucial services to children and families. The CCB has worked to promote collaboration through policy and technical assistance. In their biennial CCDF Plans, States are required to discuss the coordination and collaboration that occurred in developing their plans, as well as the results of that collaboration. The CCB will monitor State progress toward the goal of collaboration through the State reports.
In addition, the CCB coordinates with partners in ACF, DHHS, and other departments to address barriers that may impede States’ efforts to provide quality services to children and families. This coordination includes initiatives to encourage grantees to provide high quality full-day, full-year early childhood services by linking CCDF monies with those of Head Start and State pre-kindergarten programs. It also includes working with the Federal Interagency Coordinating Council and others to ensure that children with special needs who are eligible for CCDF services also receive assessments and early intervention services.
Through the Bureau’s "Map to Inclusive Child Care" project, 31 States developed strategic plans for improving child care access and quality for children with special needs by linking CCDF and existing systems. Similarly, the CCB’s Partnerships Project provides technical assistance to States and local communities in fostering partnerships with public and private entities. In this effort, the Partnerships Project disseminated written materials including a tool kit for States and a publication on developing results-based coalitions. It has also developed a short video-tape which, against the back-drop of children in care, features Dr. T. Berry Brazelton and others making the case for partnerships toward improving child care quality.
In addition to the partnerships mentioned previously, ACF is working with DHHS health agencies, including Maternal and Child Health, Community Health Centers, the Substance Abuse and Mental Health Services Administration, and the Health Care Financing Administration, and their constituencies, to achieve health targets.
Program-wide Performance
States continue to expand the innovative ways in which they use CCDF quality improvement funds to assure more children are cared for in environments that support their developmental needs. In their FY 2000-2001 CCDF State Plans, States indicated that they are using quality funds to: educate parents about making good child care choices; provide grants and loans to expand the number and quality of child care slots; increase child care provider wages, benefits, and training; and monitor the safety and quality of care.
Close to 20 States now report offering higher subsidy reimbursement rates to providers demonstrating that they provide high quality care. Most States indicated they are working toward a system of professional development for child care providers and workers. Nearly a dozen States have implemented the North Carolina TEACH model combining professional development and training with salary enhancements. State-funded pre-kindergarten programs now exist in 42 States and nearly all States reported efforts to link child care, Head Start, and pre-kindergarten programs more closely together.
With their infant and toddler earmarks, States are recruiting additional caregivers; providing health outreach including training and consultation; offering incentives for provider accreditation and training; and sponsoring specialized training for infant and toddler caregivers. A number of States have implemented initiatives to improve the supply and quality of infant and toddler care--some through partnerships with Early Head Start. Other States have offered grants targeted at increasing the supply of quality care for young children in low-income communities. In at least one instance, State and CCDF monies are being used in partnership with Early Head Start to fund a collaboration involving a variety of existing programs including child care, Parents as Teachers, Healthy Families, the Part C Interagency Coordinating Council, and other agencies assisting young at-risk families. In other States, infant and toddler funds are supporting health insurance for providers who care for very young children; an Infant/Toddler Specialist Healthline that provides expert consultation to providers related to health and developmental issues for children under age three; and incentives for accrediting and certifying providers caring for infants and toddlers.
The CCB will be working with States as they improve the availability of quality infant and toddler care with the increased infant toddler earmark provided in the FY 2001 appropriation. With CCDF monies, including funds earmarked for school-age care and resource and referral, States reported efforts to improve both the supply and quality of school-age care. These efforts include incentives for providers seeking accreditation, specialized curriculum development, grants to programs seeking to improve the quality of their services, and development of specialized licensing standards for school-age programs. In many States, efforts to improve the quality and supply of school-age care target low-income neighborhoods and non-English speaking populations.
A GAO study completed in January 2000 entitled, Child Care: State Efforts to Enforce Safety and Health Requirements, found that States have increased the resources for regulation and monitoring in recent years and are more likely to report regular monitoring visits to child care centers and homes. In their plans, States indicated that they use CCDF monies to enhance licensing and monitoring activities. One State used CCDF funds to sponsor a one-day pre-licensing workshop for more than 800 prospective child care providers. The workshop gave an introduction to State child care regulations and key aspects of operating a child care program. Several other States have implemented, or are implementing, programs of tiered licensing that differentiate child care programs based on quality. Such programs are intended to assist parents in making good child care choices and provide an incentive for improved quality of care.
As stated earlier, States are developing a wide variety of approaches to program coordination, creative partnering, and ways to address crosscutting issues. For example, one State has implemented new State school readiness legislation to ensure that children are emotionally, physically, socially, and intellectually ready to enter school while recognizing that parents are a child's first teachers. The initiative, a collaborative effort between a State council, the Department of Education, and the Department of Health, is administered through local school readiness coalitions toward the goals of blended funding and school readiness programming.
The data needed for reporting performance on the two measures related to child care quality, i.e., accreditation of facilities (measure 5.1a) and the awarding of credentials to child care providers and staff (measure 5.1b) are provided by independent national bodies. These organizations are a credible source of information about provider accreditation and certification. The baseline for measure 5.1a was established with CY 2000 data from the National Association for Family Child Care, the National Association for the Education of Young Children, and the National School-Age Care Alliance. Based on their combined data, there were 9,535 accredited child care facilities nationwide in CY 2000.
It continues to be difficult to provide an accurate count for the total number of child care facilities. For that reason, the language for measure 5.1a has been revised to measure the number of regulated child care centers and homes, information which is available from the organizations listed above. In February 2000, the Children's Foundation issued a report entitled The 2000 Child Care Center Licensing Study which contains the results of a survey of the regulatory offices of the 50 States, the District of Columbia, Puerto Rico, and the Virgin Islands. Data results in this report, collected during the months of October 1999 through January 2000, indicate there are 106,246 regulated child care centers. The National Association for the Education of Young Children (NAEYC), one of several accrediting organizations, reported 6,830 NAEYC accredited child care facilities in 1999 and 8,332 in 2000. According to the National School-Age Care Alliance (NSACA), 211 of its member child care facilities were accredited in 2000. Therefore, of an estimated 106,246 regulated child care centers, 8,543 were accredited in 2000 through NAEYC and NSACA. In addition, of the 290,667 regulated family and group child care homes reported by the Children’s Foundation, 992 were accredited through the National Association for Family Child Care in 2000.
There is a similar problem in providing an accurate count for the total number of child care workers. No reliable estimate of the number of workers providing child care services exists and the ability to provide the total number of child care workers is hampered by several factors, e.g. is no common definition exists for the term "child care worker." The Bureau of Labor Statistics' National Industry-Occupation Employment Matrix includes at least three employee categories that are applicable to child care workers.
The Council for Early Childhood Professional Recognition is the organization that awards Child Development Associate (CDA) credentials to individual child care workers (measure 5.1b). In calendar year (CY) 1999, the Academy reported 112,130 individuals with CDA credentials and 127,893 in CY 2000, an increase of 12,277 or 14.06 percent.
FY 2000 data for the third measure, increasing the number of States conducting routine unannounced inspections of regulated child care providers (measure 5.1c), should be available April 2001. When the baseline data become available, a target percentage increase will be projected. Although these three performance measures represent outputs or intermediate outcomes, they represent critical strategies to measure our ability to assess quality improvements.
Data Issues
As discussed in Strategic Goal 1, Child Care Affordability, the CCB has worked with States and Territories for several years to develop appropriate and achievable program goals and measures. The goals and measures in this document reflect the consensus-building and participatory process.
In some instances, these child care quality performance measures require new reporting and/or data gathering methods, including obtaining information from national organizations. The CCB intends to address these data issues in several ways. Some information relevant to measures is already included in State Plans and will be used to help tell the performance story. The Bureau is working with OMB to amend the State Plan Preprint submitted biennially by States to include additional items related to performance measures. The annual aggregate data report (ACF-800) submitted by States has been revised to include questions to assist in providing baseline and ongoing data on performance.
Summary Table
|
Performance Measures |
Targets |
Actual |
Reference |
|
Program Goal: The quality of child care services will improve over time. 5.1a. Increase by 1% (95) the number of regulated child care centers and homes nationwide accredited by a nationally recognized early childhood development professional organization from the CY 2000 baseline.* |
|
|
|
|
5.1b. Increase by 8% over the previous year the number of Child Development Associate credentials awarded nationwide. |
CY 02: 149,175 |
CY 02: |
Px M-86 |
|
5.1c. Increase the number of States conducting routine unannounced inspections of regulated providers from the FY 2000 baseline. (Developmental) |
FY 02: |
FY 02: |
Px M-86 |
|
Availability of FY 2000 Data:
Data for measure 5.1c is not currently available as it is not included in
the required State Plan; the baseline will be established using FY 2000
data from States on the revised ACF-800. | |||
Performance Measures for FY 2002 and Final Measures for FY 2001
PROGRAM GOAL: Improve the quality of child care services
Objective: Increase the number of accredited child care facilities
5.1a. FY 2001: Increase by an additional 1% the number of regulated child care centers and homes nationwide accredited by nationally recognized early childhood development professional organizations and accrediting entities from the CY 2000 baseline.
FY 2002: Increase by an additional 1% the number of regulated child care centers and homes nationwide accredited by nationally recognized early childhood development professional organizations and accrediting entities from the CY 2000 baseline.
Data source: National Association for Family Child Care, the National Association for the Education of Young Children, and the National School-Age Care Alliance.
The above performance goal is an indicator of quality improvement. Accreditation of Child care facilities has been linked to better outcomes for children and is growing in acceptance as a marker of good quality care. Several States use CCDF quality improvement funds in a variety of ways to support accreditation for child care centers and homes.
Through intense efforts with program stakeholders to explore alternative ways to measure progress toward improving the quality of child care services, the following performance goals have been developed. These goals address the levels of safety necessary to support children’s development in child care settings and the higher levels of quality reflected by facilities in which staff have achieved nationally recognized educational credentials.
Objective: Increase the professional capacity of child care workers
5.1b. FY 2001: Increase by 8% over the previous year to 138,125 the number of Child Development Associate credentials awarded nationwide.
FY 2002: Increase by 8% over the previous year to 149,175 the number of Child Development Associate credentials awarded nationwide from the CY 1999 baseline.
Data source: Child Care State Plans and the Council for Early Childhood Professional Recognition.
5.1c. FY 2001: Increase the number of States conducting routine unannounced inspections of regulated providers from the FY 2000 baseline.
FY 2002: Increase the number of States conducting routine unannounced inspections of regulated providers from the FY 2000 baseline.
Data source. The number of States conducting routine unannounced inspections has been approved by OMB as an optional data element for the annual aggregate ACF-800 data collection. The first collection of this data was due December 31, 2000. We anticipate that aggregate State data will be available by April 30, 2001.
The Bureau will continue to support CCDF Grantees in using the quality set-aside funds for training of child care workers, developing incentive programs for child care facilities to achieve accreditation, and in encouraging providers to obtain CDA credentials. Such efforts will be accomplished through technical assistance services provided through the Bureau's Child Care Technical Assistance Network, national and regional meetings and leadership forums, and information dissemination including best practices and research findings.
Program Description, Context, Legislative Intent and Broad Program Goals
Head Start is a national program that provides comprehensive developmental education, health, mental health, nutrition and social services for America's low-income, preschool children ages three to five and their families. The basic philosophy undergirding the Head Start program is that children benefit from quality early childhood experiences and that effective intervention can be accomplished through high quality comprehensive services for children, along with family and community involvement. Head Start provides diverse services to meet the goals of three major content areas: early childhood development and health services; family and community partnerships; and program design and management. Approximately 1,525 community-based organizations develop unique and innovative programs to meet specific needs, following the guidelines of Program Performance Standards, last updated in January 1998. In 2000, there were 18,000 centers and 45,000 classrooms, in which 857,664 children were served. Of the families served, 34.5 percent are African-American; 30.4 percent are White; 28.7 percent are Hispanic; 3.3 percent are American Indian; and 2.0 percent are Asian.
Head Start programs endeavor to meet the needs of diverse communities and cultures in America. Sixty-four percent of all Head Start programs enrolled children from more than one dominant language, and 20 percent enrolled children from four or more dominant language groups. Head Start programs teach an appreciation of the cultures of all enrolled children and provide culturally relevant classroom and other activities. Besides staffing Head Start centers with staff speaking the same language as the children enrolled, Head Start provides special programs for special populations. In FY 2000, Head Start served more than 115,646 children with disabilities, 13 percent of the total enrollment. Disabilities included visual, hearing, speech, and health impairments, mental retardation, serious emotional disturbances, specific learning disabilities, and developmental delays. In FY 2000, 93 percent of these children had Individualized Education Plans (IEPs).
Head Start is requesting an increase of $125 million to serve a total of 917,000 children including approximately 55,000 children under age three. This increase will be used to maintain current service and enrollment levels and continue quality improvements.
Grants are awarded to local public or private non-profit agencies; the 1998 Head Start Reauthorization made profit-making agencies eligible as well. The community must contribute twenty percent of the total cost of a Head Start program. Head Start programs operate in all 50 States, the District of Columbia, and the U.S. Territories.
The 1994 Head Start Reauthorization established a new program, Early Head Start, for low-income pregnant women and families with infants and toddlers. The program was designed with the advice of the Advisory Committee on Services to Families with Infants and Toddlers, established by the Secretary of DHHS. The program focuses on four cornerstones essential to quality programs: child development, family development, community building, and staff development. The program is accompanied by a major research effort to identify, develop, and apply measures of quality and outcomes for children and families. In 2000, Early Head Start served approximate 45,000 children in 625 programs around the country.
The primary goal of Head Start is to promote the social competence and school readiness of low-income children. The program embraces the comprehensive view of school readiness recommended by the National Education Goals Panel (Kagan, Moore & Bredekamp, 1995). This view encompasses five developmental domains key to school readiness: physical well being and motor development; social and emotional development; approaches to learning; language development and emerging literacy; and cognition and general knowledge. To carry out its primary goal, the Head Start Program Performance Measures are organized around five program goals:
Each program goal represents a cornerstone of the Head Start program. The child and family-oriented program goals represent outcomes or results the program is designed to produce. The last three program goals contain the process measures that are key to attaining the first two.
For the first time, Head Start is collecting its own data on child and family outcomes, in addition to the process data long available through program reports and monitoring. The Family and Child Experiences Survey (FACES) is a longitudinal study of a nationally representative sample of 3,200 children and families in 40 Head Start programs. OMB granted approval in July 1997, following a field test of 2,400 children in spring 1997. Full implementation began in fall 1997 and includes assessment of the same children before and after their Head Start experience (whether one or two years), as well as in the spring of kindergarten and the spring of first grade. Data sources include parent interviews, staff interviews, teacher questionnaires, classroom observations, and direct child assessments. FACES, designed as a periodic, longitudinal data collection activity, is currently yielding baseline data for 1999. Because of the need to collect longitudinal data, including pre- and post-test and follow-up data on child performance to assess progress, it is not feasible to provide FACES data on an annual basis. However, regular, periodic data collection of both program quality and outcome measures will ensure that the Head Start program provides a regular, national picture of program quality. Current plans project a three-year cycle of data collection with new, nationally-representative samples of Head Start programs. A new cohort of FACES, including a new nationally representative sample of 43 programs, has received OMB approval; data collection began in fall 2000, following children and families for one or two years of program attendance, with a kindergarten follow-up. Administrative and process data will continue to be collected annually through the Program Information Report.
Program Activities, Strategies and Resources
Most of the Head Start program's appropriation funds local Head Start projects. The remainder is used for: training and technical assistance to help local projects meet the Head Start program performance standards and maintain and improve the quality of local programs; research, demonstration, and evaluation activities to test innovative program models and to assess program effectiveness; and required monitoring activities.
Head Start program monitoring: Head Start's legislation requires a team led by a Federal representative to examine Head Start program compliance at least every three years for each program. ACF regional office and central office staff conduct more than 500 on-site reviews each year.
Other information and management systems: All local programs receiving Head Start funds are required to submit an annual Program Information Report tracking program participation statistics such as the age of children, the kind of education program they receive, and the medical, dental and mental health services the children receive. Annual one-time questions capture information about children's families and the kind of support services required such as job training, education, housing, counseling and other community based services. Head Start's new application includes a component which tracks costs hourly, daily and annually across service components and allows judgements to be made by Federal officials about the reasonableness of a Head Start grantee’s proposed costs.
Head Start training and technical assistance network and quality improvement centers: Head Start makes a substantial annual investment to support regional and sub-regional Head Start quality improvement centers. There is a national Early Head Start Resource Center for leadership and support in training and technical assistance for programs enrolling infant, toddlers and pregnant women. All training and technical assistance services foster collaboration between community agencies, governments, academic institutions and Head Start programs.
Program Coordination, Partnerships and Crosscutting Issues
Extensive input on future directions for the Head Start Program was obtained in 1993 by the Advisory Committee on Head Start Quality and Expansion. In addition, input specifically about developing Early Head Start was sought through the Advisory Committee on Services for Families with Infants and Toddlers. Public comment on revised performance standards for the Head Start programs was solicited through focus groups and then through the rulemaking process. In operating local programs, revised Head Start regulations require grantees to coordinate activities on the transition of Head Start children to school and to encourage cooperation between Head Start staff and their counterparts in other preschool and child care programs, particularly those operated through title I funding and Even Start.
Extensive consultation and partnership opportunities have continued in the research domain. For example, an Advisory Committee on Head Start Research and Evaluation was chartered in 1999 in response to the reauthorization of the Head Start Act, in order to make recommendations to the Secretary on Head Start research. Major interagency partnerships in research include the ACYF/NIMH Head Start Mental Health Research Consortium, begun in 1997; the Head Start sub-study of the NICHD Study of Early Child Care, and the ACYF/NICHD/ASPE/Ford Foundation study of low-income fathers of infants and toddlers. In addition, Head Start is closely involved with the Department of Education's Early Childhood Longitudinal Study, both the Kindergarten and Birth cohorts.
Head Start and Department of Education staff have developed strategies to support the attainment of the first Department of Education Goals 2000 Educate America objective that "all children in America will start school ready to learn," and have collaborated on issues arising from the transition of children from Head Start to school programs. Over the past several years, Head Start has increased the attention paid to promoting early language and literacy skills among children enrolled in Head Start and to tracking results in this and other areas of program quality and outcomes.
In 1996, ACF issued revised Performance Standards to guide the delivery of comprehensive Head Start services, including strengthened standards in key areas of curriculum, expectations for programs to foster cognitive development, literacy, numeracy, reasoning, and language development, and highlighted the importance of collaboration between Head Start programs and public schools. The 1998 reauthorization of the Head Start Act further strengthened the focus on children's literacy and language development by mandating more specific performance standards to strengthen classroom practices that support children’s early language and literacy. The National Head Start Child Development Institute, convened in December 2000, provided 3500 local Head Start Education Coordinators cutting edge training on outcomes-based instructional practices in literacy, language development, mathematics, science and social development. Head Start recently awarded a $3 million grant to the National Center for Family Literacy to enhance Head Start family literacy services, including new efforts to encourage parents to read with their children. A "Ready*Set*Read" Early Childhood Learning Kit was developed with America Reads and the Department of Education and disseminated to every Head Start agency to assure that children are read to daily and have access to books and literacy experiences. In addition, National Training Guides on Child and Family Literacy, Assessment, and Transition to School were developed to provide consistent staff training in core areas of education services. These efforts, combined with ongoing research, program improvement, and staff development initiatives, demonstrate Head Start's commitment to improving the school readiness of low-income children.
Early Head Start is pivotal to the ACF "Infants and Toddlers" priority, which requires ACF programs to coordinate efforts on behalf of this priority. A close working relationship has been established with the child care programs of ACF, NICHD, early childhood researchers at the Department of Education, and others.
Program-wide Performance
The FACES study of a nationally representative sample of Head Start children, families and programs, launched in 1997, has yielded encouraging results. First, Head Start classroom quality is good on average, with approximately 75 percent of over 500 observed classrooms rated good quality or higher on the Early Childhood Environment Rating Scale. No classrooms scored below a minimal level of quality, unlike many studies of other preschool and child care settings. In addition, Head Start classroom quality is linked to child outcomes. For example, children score higher on early literacy measures when they experience richer teacher-child interaction, more language learning opportunities, and a classroom well equipped with learning resources.
Head Start children have been found to be ready for school, having many of the cognitive and social skills that indicate readiness to learn more in kindergarten. FACES uses measures of child performance for which national norms are available, such as the Peabody Picture Vocabulary Test -- III and subtests of the Woodcock-Johnson Psychoeducational Battery-Revised. Note that national mean scores are the average scores achieved by children at all levels of income. Head Start works to narrow the gap between disadvantaged children and all children in school readiness skills during the program year. For example, the proportion of Head Start children scoring close to or above the national mean on an assessment of word knowledge (measure 5.2a) increased from only one in four (24%) when they began Head Start in the fall of 1997 to one in three (34%) in the spring of 1998 -- nearly a 40% increase. During the Head Start year, children made significant gains in some areas (i.e., vocabulary and social skills, measures 5.2a and 5.2e), while showing a need for improvement in other areas (i.e., letter recognition, measure 5.2c), suggesting that programs could be doing more. By the end of kindergarten, Head Start children show significant gains in knowing letters, writing letters, and writing their names compared to nationally normed data; in other words, their scores improved more than those of the typical kindergartner. Grantees have maintained a high level of employing parents in the Head Start program (measure 5.2h); nearly 31% of present Head Start employees are parents of Head Start children.
The target for FY 2000 established in the legislation for qualified teaching staff (measure 5.2i) was 100%; the actual was 94%. This shortfall is due to a combination of staff turnover and/or limited access to training and credentialing opportunities in certain areas of the country. In partnership with institutions of higher education, Head Start is working to ensure that a majority of teachers obtain associate’s or bachelor’s degrees in early childhood education over the next few years. More than $80 million in annual funding has been earmarked to pay for teacher training and to continue to increase staff compensation. Grantees were required to develop plans for using their allocation from the $80 million to increase the numbers of teachers with degrees. Head Start additionally provided $3 million in funding to 24 higher education training partnership projects, largely to provide training towards degrees at Historical Black Colleges and Universities (HCBU), Hispanic-serving Institutions of Higher Education (HIHE), and Indian-controlled land grant colleges and universities. We also have initiated a new 5-year project at $1 million per year with Wheelock College for higher education faculty development. Teacher’s education level is correlated with classroom quality (classrooms have higher-quality language activities, offer more creative activities to children and have higher overall quality as rated by the Early Childhood Environment Rating Scale (ECERS).
Head Start parents demonstrated remarkable involvement and satisfaction with the program. During 2000, the American Customer Satisfaction Index, an independent study, with follow-up of customer satisfaction among Head Start parents, yielded high ratings of Head Start among programs in the Federal Government. Findings from the Head Start FACES study (see chart on page 95), based on a national probability sample of parents, confirm these findings. For example, parents in both studies demonstrate a high degree of satisfaction with Head Start's support of their child's growth and development, preparation for kindergarten, and provision of health and other services. They also indicate Head Start's openness to their own cultural backgrounds, ideas, and participation, as well as its fostering their role in the wider community. Taken together, the findings of these two studies amply demonstrate that Head Start's customers are highly satisfied with the quality of the program they receive, and support the continued provision of these important benefits to children and families.
Data Issues
The FACES data collection effort requires a data collection site manager, trained field interviewers and child assessment specialists, and, therefore, includes resources for training data collection specialists. On-site quality control visits by trainers occur regularly to maintain reliability of observational assessments. As currently configured, FACES will not provide annual data. ACF anticipates drawing new samples every three years. The initial round of FACES data collection began in the 1997-98 program year, with follow-up for the second program year, 1998-99. This information was used as the baseline data for FY 1999. The next round of FACES data collection began in the fall of 2000 for the FY 2001-2002 reporting period. OMB approval has been granted for this cohort.
Data collection for FACES includes carefully defined collection procedures and methods for maximizing response rates. The methodology includes selecting a nationally representative sample of data collection sites with probability proportional to size; a random selection of a nationally representative sample of Head Start children and families across the country; and a central study processing point for data cleansing, entry and verification. These procedures are specifically noted in Head Start's OMB-approved study design.
For performance measures which are supported, in part, by the Head Start Program Information Report, automated edit checks of most fields are used to ensure accuracy. These data are collected at all sites and there is a 100 percent annual response rate.
Summary Table
The indicators below refer to numerical measures of gain in word knowledge (vocabulary), mathematical skills, letter identification, fine motor skills (e.g., writing, copying designs), and social skills (e.g., classroom social behavior such as following instructions, turntaking, attention).
|
Performance Measures |
Targets |
Actual |
Reference | |||
|
Program Goal: Enhance Children’s Growth and Development: Objectives: (1) Children demonstrate improved emergent literacy, numeracy and language skills. (2) Children demonstrate improved general cognitive skills. 5.2a. Maintain at the FY 1999 baseline the average gain in word knowledge. (New in FY 2001) 5.2b. Maintain at the FY 1999 baseline the average gain in mathematical skills. (New in FY 2001) 5.2c. Increase from the FY 1999 baseline the average gain in letter identification. (New in FY 2001) |
|
|
| |||
|
(3) Children demonstrate improved gross and fine motor skills. 5.2d. Increase from the FY 1999 baseline the average gain in fine motor skills. (New in FY 2001) |
|
|
| |||
|
(4) Children demonstrate improved positive attitudes toward learning. (5) Children demonstrate improved social behavior and emotional well being. 5.2e. Maintain at the FY 1999 baseline the average gain in social skills. (New in FY 2001) |
|
|
| |||
|
(6) Children demonstrate improved physical health. 5.2f. Increase from the FY 1999 baseline the percentage of children rated by parent as being in excellent or very good health. (New in FY 2001) |
|
|
| |||
|
Program Goal: Strengthen Families Objective: (1) Head Start parents demonstrate improved parenting skills. 5.2g: Increase from the FY 1999 baseline the percentage of parents who read to child three times per week or more. (New in FY 2001) Maintain the percentage of children who are taken to the library at least once a month. (Measure dropped in FY 2000.) |
|
|
| |||
|
Data for the seven measures listed above are selected from the Family and Child Experiences Survey (FACES) which provides information over a two-year period for each cohort. The baseline was established in FY 1999 for the PY 1997-1998 cohort. The next cohort covers PY 2000-2001, with a kindergarten follow-up in 2002 and program year data will be available in 2002. FACES will not provide annual data, because it is a longitudinal survey following children from entry into program, exit from program (after one or two years), and kindergarten follow-up. Scale points represent the amount of change expected during the Head Start year (standardized with regard to nationally normed data based on children at all income levels, with a mean score of 100 and a standard deviation of 15 points). * This percentage is based on the most recent FACES survey information. | ||||||
|
(2) Parents improve their self-concept and emotional well being. (3) Parents make progress toward their educational, literacy and employment goals. 5.2h. Maintain at the FY 1999 baseline the number of Head Start parents who are employed as Head Start staff. |
|
|
| |||
|
*Among the 176,890 Head Start employees, 54,570 are present or former Head Start parents representing 30.9 percent of the total staff. | ||||||
|
Program Goal: Children receive educational services. Objective: (1) Programs provide developmentally appropriate educational environments. 5.2i. Increase the number of classroom teachers with a degree in early childhood education (ECE), a child development associate credential, a State-awarded preschool certificate, a degree in a field related to ECE plus a State-awarded certificate or who are in CDA training and have been given a 180-day waiver, consistent with the provisions of Section 648A(a)(1) of the Head Start Act. |
|
|
| |||
|
(2) Staff interact with children in a skilled and sensitive manner. 5.2j. Maintain at the FY 1999 baseline the average lead teacher score on an observational measure of teacher-child interaction. (New) |
|
|
| |||
|
Data for the above measure are from the Family and Child Experiences Survey (FACES) which provides information over a two-year period for each cohort. The baseline was established in FY 1999 for the PY 1997-1998 cohort. The next cohort covers PY 2000-2001, and data will be available in 2002. FACES will not provide annual data, because it is a longitudinal survey following children from entry into program, exit from program (after one or two years), and kindergarten follow-up. Availability of FY 2000 Data: Current FACES data for the 1999/2000 cohort are available and included in the chart. | ||||||
|
Total Funding for All Head Start Programs (dollars in millions) See detailed Budget Linkage Table in Appendix 6 for line items included in funding totals. |
FY 02: $6324.8 |
Bx: budget just. Section H | ||||
Performance Measures for FY 2002 and Final Measures for FY 2001
PROGRAM GOAL: Enhance children's growth and development.
Head Start's educational program is designed to meet the needs of each child, and the community served, with attention to ethnic and cultural characteristics. Every child receives a variety of learning experiences to foster intellectual, social, and emotional growth.
Head Start children are likely to face various conditions that put them at risk. On entry into the program in the fall of 1997, only 43 percent lived with both parents, and changes in family configuration were common over the year. Seventy percent of mothers had at least a high school diploma or GED, with less than nine percent having an Associate's or higher college degree. Forty-two percent of households reported less than $1,000 in monthly income from all sources, including TANF. Over 85% of households received supplemental income from TANF (31%) or other sources such as WIC and food stamps. About one-fifth of children were reported to have been exposed to community or domestic violence in their lives. (FACES study, fall 1997)
The measures, baseline data and targets for the following indicators are based on data from FACES, a periodic longitudinal data collection from a nationally representative sample of 3,200 Head Start children and families. The instruments used in FACES were designed to tap the major domains of social competence, also called school readiness. Children's cognitive development and early academic skills were measured through a direct child assessment administered by trained assessors. Children's developing social skills and approaches to learning were assessed by means of standardized scales filled out by teachers and parents and by direct observation of children's social play. Classroom quality was assessed through direct observations during the course of the Head Start day by trained observers using tools common to large-scale studies of early educational settings.
Targets for child outcomes are based on the actual performance of Head Start children during the program year and in kindergarten follow-up. Average scores are calculated for a nationally representative sample of children completing the Head Start program. Scores are generally standardized with regard to nationally normed data based on children at all income levels, with a mean score of 100 and a standard deviation of 15 points. Over the course of the Head Start year, on average, children should be expected to demonstrate progress on academic skills that is approximately half that observed during the kindergarten year. The targets have been set to be both educationally meaningful and realistically achievable. In some areas, Head Start children are already meeting this standard, while in other areas, increased programmatic attention to these goals will be required to meet the standard. This increased attention is being addressed through multiple approaches at the program level, including new initiatives in family literacy, teacher credentialing, a National Child Development Institute for Head Start managers, and a new emphasis on local program use of child outcome data in self-evaluations.
Objectives: Children demonstrate improved emergent literacy, numeracy and
language skills.
Children demonstrate improved general cognitive skills.
5.2a FY 2001/2002: Maintain at the FY 1999 baseline of 10 scale points the average gain in word knowledge.
5.2b. FY 2001/2002: Maintain at the FY 1999 baseline of 3 scale points the average gain in mathematical skills.
5.2c. FY 2001/2002: Increase from the FY 1999 baseline of 1.5 to 3.4 scale points the average gain in letter identification.
Objective: Children demonstrate improved gross and fine motor skills.
5.2d. FY 2001/2002: Increase from the FY 1999 baseline of 1.05 to 1.24 scale points the average gain in fine motor skills.
Objectives: Children demonstrate improved positive attitudes toward learning
Children demonstrate improved social behavior and emotional well being.
5.2e. FY 2001/2002: Maintain at the FY 1999 baseline of 1.4 scale points the average gain in social skills.
Objective: Children demonstrate improved physical health.
5.2f. FY 2001/2002: Increase from the FY 1999 baseline of 77% to 80% the percentage of children rated by parent as being in excellent or very good health.
Data sources: Family and Child Experiences Survey (FACES) including child assessments, parent interviews and teacher ratings.
PROGRAM GOAL: Strengthen families
An essential part of Head Start is the involvement of parents in parent education, program planning, and operating activities. Many parents serve as members of policy councils and committees and have a voice in administrative and managerial decisions. Participation in classes and workshops on child development and staff visits to the home allow parents to learn about the needs of their children and about educational activities that can take place at home. Currently, approximately 55,000 parents of Head Start children are employed as paid program staff. Head Start aims to foster family and community partnerships so community resources can be brought to bear in helping families meet their needs. Services are geared to each family after its specific needs are determined, in areas such as education, training and employment services, counseling, and crisis/emergency intervention and services.
FACES included interviews with parents of Head Start children. In the spring of 1998, 2,688 parents interviewed were a nationally representative sample of all those with children enrolled in Head Start. The parents were asked a series of questions about satisfaction with Head Start services and perceptions of their Head Start experiences.
Parents participating in the Head Start FACES study reported very high levels of satisfaction with the program’s performance in each of eight areas. Responses were given on a 5-point scale, ranging from "very dissatisfied" to "very satisfied."
|
Head Start Performance |
% parents "satisfied" or "very satisfied" |
% parents "very satisfied" |
|
Head Start prepared their child for kindergarten. |
over 96% |
85% |
|
Head Start is open to their ideas and participation. |
over 97% |
77% |
|
Head Start helped their child grow and develop. |
98% |
86% |
|
Head Start supported and respected the family’s culture and background. |
98% |
87% |
|
Head Start identified and provided services for the child -- health screenings, help with speech and language development. |
96% |
86% |
|
Head Start maintained a safe program. |
98% |
89% |
|
Head Start identified and helped provide services to help the families. |
84% |
65% |
|
Head Start helped parents become more involved in groups active in the community. |
87% |
60% |
Additional questions from the FACES parent interview gave a very positive picture of parent attitudes toward their child's and their own experiences with Head Start. For example, 96 percent of parents reported that their child "has been happy in the program" often or always; over 97 percent reported that their child "is treated with respect by teachers"; and nearly 96 percent noted that the teacher is supportive of them as parents. While this information on parent participation and satisfaction is not directly reflected in the GPRA goals, parent involvement with and reliance on the program is believed to be a mediator in obtaining positive outcomes for both children and families.
Objective: Head Start parents demonstrate improved parenting skills.
5.2g FY 2001/2002: Increase from the FY 1999 baseline of 66% to 70% the percentage of parents who read to child three times per week or more.
Data Sources: Family and Child Experiences Survey (FACES) parent interviews
Objectives: Parents improve their self-concept and emotional well being.
Parents make progress toward their educational, literacy and employment goals.
5.2h. FY 2001: Maintain at the FY 1999 baseline of 30% the number of Head Start parents who are employed as Head Start staff.
FY 2002: Maintain at the FY 1999 baseline of 30% the number of Head Start parents who are employed as Head Start staff.
Data sources: Head Start Program Information Report.
PROGRAM GOAL: Children receive educational services.
Objective: Programs provide developmentally appropriate educational environments.
Head Start has devoted quality improvement dollars specifically for the purpose of upgrading teacher qualifications.
5.2i. FY 2001: Maintain at 100% the number of classroom teachers with a degree in early childhood education (ECE), a child development associate credential, a State-awarded preschool certificate, a degree in a field related to ECE plus a State-awarded certificate, or who are in CDA training and have been given a 180 day waiver, consistent with the provisions of Section 648A(a)(2) of the Head Start Act.
FY 2002: Maintain at 100% the number of classroom teachers with a degree in early childhood education (ECE), a child development associate credential, a State-awarded preschool certificate, a degree in a field related to ECE plus a State-awarded certificate, or who are in CDA training and have been given a 180 day waiver, consistent with the provisions of Section 648A(a)(2) of the Head Start Act.
Data Sources: PIR
Objective: Staff interact with children in a skilled and sensitive manner.
5.2j. FY 2001/2002: Maintain at the FY 1999 baseline of 73 points the average lead teacher score on an observational measure of teacher-child interaction.
Data Sources: Family and Child Experiences Survey (FACES) observation of classroom teachers
Program Description, Context, Legislative Intent and Broad Program Goals
Head Start emphasizes the importance of the early identification of health problems. Every child is in a comprehensive health program which includes immunizations, medical, dental, and mental health, and nutritional services.
The Head Start program has made a considerable investment in measuring program outcomes, particularly in the health areas. When this information is analyzed over time, it demonstrates that grantees are maintaining a high level of effort, especially in accomplishing a nearly 100% rate for child immunizations and rates approaching 90% or better for health and dental examinations and treatment. Head Start sees the need for improvement in the rates of treatment for mental health referrals and receipt of mental health services for children. Basic to the philosophy of the Head Start program is that healthy children will be better able to learn.
Head Start has measured health component outcomes for more than twenty years. Trend data over the past several years show that most Head Start grantees have maintained an acceptable level of performance in the area of health services. While not direct providers of health services, Head Start grantees assist families to access care by identifying health care providers and even providing families with transportation to and from health services. The newly revised Head Start Performance Standards require that every program help every child and family to identify a "medical home" which will provide the child with ongoing sources of medical care.
Every year Head Start polls approximately 1,525 Head Start grantees using the annual Head Start Program Information Report (PIR) survey to measure several health indicators, including immunization rates, screenings for health and dental health conditions, and the rates for accomplishing treatment for identified conditions. During the past several years Head Start has also measured the rate of referral and treatment for mental health conditions. The Summary Table below shows the results reported by all 1,525 reporting grantees since 1998. Generally, Head Start programs are maintaining acceptable results as shown on the table below for indicators measured.
Program-wide Performance
The summary table below compares the actual performance, as reported by 1,525 Head Start and Early Head Start grantees on the Head Start Program Information Report (PIR) for the reporting period ending in June 2000. Head Start devotes considerable time and energy to survey mailing, data collection, data cleaning, database building and data base management. These reports (more than 2400 reports were submitted) tracked performance for over 850,000 children in the FY 2000 reporting period.
Programs reported that 88% of enrolled children receive treatment for identified medical conditions. It is important to note that Head Start has a predictable turnover rate; that is, children leave the program during its course for various reasons. So while a referral may have been made, programs may not have follow-up information for children who have left the program.
Head Start health indicators (measures 6.1a-c) are below the target levels. Since Head Start program enrollees rely heavily on Medicaid services, the Head Start Bureau suspects that levels of reimbursements to providers, particularly dental health providers, are not sufficient to encourage the provision of services to Medicaid recipients. The result is that Head Start children experience delays in receiving such services. The Head Start Bureau will examine this and other possible causes to determine an appropriate national or local level response.
Dental treatment targets may be difficult to reach in the coming years as dental providers accepting Medicaid are scarce in some communities. This may also be a factor in mental health treatment for young children. Nevertheless, Head Start has chosen to continue target increases for performance indicators (measures 6.1a-c) for FY 2002 because health plays such a critical role in the overall positive development of children. The Bureau will examine the reasons why performance is below target projections and identify strategies and actions that are reasonable on a national level to increase these outcomes.
Summary Table
|
Performance Measures |
Targets |
Actual |
Reference | |
|
Program Goal: Children in Head Start receive health and nutritional
services. |
|
|
| |
|
*199,329 children were diagnosed as needing medical treatment and 175,504 received or are receiving treatment. | ||||
|
6.1b. Maintain the percentage of Head Start children who receive necessary dental treatment after being identified as needing dental treatment. |
FY 02: 90% |
FY 02: |
Px M-99 | |
|
**219,046 children were diagnosed as needing dental treatment and 170,828 received or are receiving treatment. | ||||
|
6.1c. Increase the percentage of Head Start children who receive necessary treatment for emotional or behavioral problems after being identified as needing such treatment. |
FY 02: 85% |
FY 02: |
Px | |
|
***46,256 children were referred for mental health treatment. 35,493 received treatment.. | ||||
Performance Measures for FY 2002 and Final Measures for FY 2001
PROGRAM GOAL: Children in Head Start receive health and nutritional services.
Objective: Children in Head Start receive needed medical, dental and mental health services.
6.1a. FY 2001: Increase from 88% in FY 1998 to 92% the percentage of Head Start children who receive necessary medical treatment after being identified as needing medical treatment.
FY 2002: Increase from 88% in FY 1998 to 94% the percentage of Head Start children who receive necessary medical treatment after being identified as needing medical treatment.
6.1b. FY 2001: Increase from 83% in FY 1998 to 90% the percentage of Head Start children who receive necessary dental treatment after being identified as needing dental treatment.
FY 2002: Maintain at 90% the percentage of Head Start children who receive necessary dental treatment after being identified as needing dental treatment.
6.1c. FY 2001: Increase from 75% in FY 1998 to 83% the percentage of Head Start children who receive necessary treatment for emotional or behavioral problems after being identified as needing such treatment.
FY 2002: Increase from 75% in FY 1998 to 85% the percentage of Head Start children who receive necessary treatment for emotional or behavioral problems after being identified as needing such treatment
Data sources: Head Start Program Information Report (PIR).
Program Description, Context, Legislative Intent and Broad Program Goals
ACF funds a number of programs that focus on preventing maltreatment of children in troubled families, protecting children from abuse, and finding permanent placements for those who cannot safely return to their homes. Programs such as Foster Care, Adoption Assistance, and Independent Living provide stable environments for those children who cannot remain safely in their homes, assuring the child's safety and well-being while their parents attempt to resolve the problems that led to the out-of-home placement. When the family cannot be reunified, foster care provides a stable environment until the child can be placed permanently with an adoptive family. Adoption Assistance funds are available for a one-time payment for the costs of adopting a child as well as for monthly subsidies to adoptive families for care of the child.
The Adoption Incentives program was one of the innovative recommendations advanced in the "Adoption 2002 Initiative" and enacted into law by the bipartisan Adoption and Safe Families Act of 1997. The passage of this incentive program along with state, local and private initiatives focusing attention on the needs of children in foster care awaiting permanent adoptive families, are resulting in unprecedented increases in the number of children adopted from foster care.
The Child Welfare Services program funds grants to States and Indian Tribes to provide services to children and their families without regard to income. Family Preservation and Support Services, renamed Promoting Safe and Stable Families, focuses on strengthening families, preventing abuse, and protecting children. These grants help States and Tribes operate preventive family preservation services and community-based family support services for families at risk or in crisis, family reunification and adoption support services.
The Child Abuse and Neglect program assists States to meet their responsibilities for preventing and intervening in cases of child abuse and neglect. Discretionary funds generate knowledge and research, improve services, collect data, facilitate information dissemination and exchange, and support policy development and the education of professionals in the field.
The President's proposal to increase funding in the Promoting Safe and Stable Families program from $305 to $505 million (an increase of $200 million over the 2001 level) will support preventive efforts to help families in crisis and improve the prospects for children to live in a permanent home. An additional $67 million increase will establish a "Mentoring Children of Prisoners" discretionary authority under Promoting Safe and Stable Families. Funds would go to States to provide competitive grants to faith-based and community-based organizations that help children through the time their parents are imprisoned, including efforts to keep children connected to a parent in prison, and increase the chances that the family can come together successfully when the parent is released.
ACF is placing increased emphasis on services for youth in foster care, particularly independent living services. Independent Living assists current or former foster care youths in the transition to independent living, education and employment assistance, training in daily living skills, and individual and group counseling. Nearly 16,000 young people leave foster care each year when they reach age 18 without an adoptive family or other guardian. Research indicates that these young people experience alarming rates of homelessness, early pregnancy, mental illness, unemployment and drug use in the first years after they leave the system. (This program should not be confused with the "Increase Independent Living" strategic objective of this annual performance plan, objective 2, which focuses on achieving independence by helping developmentally disabled individuals rent or own their own homes in the mainstream community.) To help these children, a $60 million increase is being requested to provide education and training vouchers to youth who age out of foster care. Each voucher, worth up to $5,000, would be available to cover the costs of college tuition or vocational training to help these young people lead independent and productive lives.
Other ACF programs that address child welfare are: the Adoption Opportunities program, the Abandoned Infants Assistance program, special initiatives such as "Adoption 2002," enforcement of the Multiethnic Placement Act of 1994 and the Interethnic Adoption provisions of 1996, and State Child Welfare Reform Demonstrations (24 Demonstrations in 21 States and the District of Columbia, to date) to test innovative new ways to strengthen the child welfare system.
Program Activities, Strategies and Resources
ACF has undertaken a number of activities designed to improve overall performance in child welfare. Most significant is the publication in January 2000 of final regulations pertaining to aspects of the Adoption and Safe Families Act of 1997 (ASFA), including regulations about foster care eligibility reviews and child and family services State plan reviews. Central and Regional Office staff have undertaken a major initiative to provide training and technical assistance to States regarding the regulatory requirements and improvement of their child welfare services systems.
As part of this training and technical assistance, ten Child Welfare Resource Center cooperative agreements focus on providing training and technical assistance to States and local agencies around issues pertaining to the implementation of ASFA. The Resource Centers focus on permanency planning, adoption, family-centered practice, youth development, legal issues, abandoned infants, organizational development, child maltreatment, community-based family resource services, and information technology.
On January 25, 2000, DHHS published a final rule in the Federal Register to establish new approaches to monitoring State child welfare programs. The rule focuses on results in the areas of safety, permanency and child and family well-being; strengthens the penalty and corrective action processes for the Multiethnic Placement Act (MEPA), as amended, regarding discrimination and adoptive and foster care placements; regulates provisions of the Adoption and Safe Families Act (ASFA) of 1997, and the Federal foster care program; and updates the review process for the Federal foster care program. The new rule plays an important role in improving services to, and outcomes for, abused and neglected children, children in foster care, and children awaiting adoptive families. The focus on outcomes in the child and family service reviews builds on the outcome measures in section 203 of ASFA. It will promote increased safety for children who are maltreated; quicker movement to permanent homes and families for children in foster care; and enhanced well-being for families served by State agencies. The President's budget includes $2 million to expand monitoring efforts in FY 2002.
The rule addresses two monitoring activities: the Child and Family Services (CFS) review and the title IV-E eligibility review. The projects funded under a number of priority areas in this announcement are geared toward assisting States to prepare for and successfully meet the monitoring requirements. The CFS review will address two areas: (1) outcomes for children and families in the areas of safety, permanency, and child and family well-being; and (2) systemic factors that directly impact the State's capacity to deliver services leading to improved outcomes. Each outcome is evaluated by using specific performance indicators as follows:
Safety Outcomes:
Permanency Outcomes:
Child and Family Well-Being Outcomes:
The systemic factors being reviewed are related to the State's ability to deliver services leading to improved outcomes. The systemic factors include: 1) statewide information systems; 2) the case review system; 3) quality assurance system; 4) staff and provider training; 5) service array; 6) agency responsiveness to the community; and 7) foster and adoptive parent licensing, recruitment and retention.
The new CFS monitoring process is both a substantial improvement and a substantial challenge. While it is much more difficult to determine whether a child is safe than it is to determine, for example, that a date on a court order meets specified time frames, ACF believes the new monitoring process is better and more likely to yield findings that will help States improve those processes where needed.
In FY 2001-2002, ACF will emphasize the improvement of data systems and data reporting in child welfare. ACF plans to increase the number of States with operational Statewide Automated Child Welfare Information Systems (SACWIS). ACF also plans to increase the number of States submitting penalty-free Adoption and Foster Care Reporting and Analysis System (AFCARS) data from 25 to 35 through the provision of technical assistance. In addition, a number of SACWIS and AFCARS reviews will be completed. Finally, activities are underway for developing performance and outcome measures for the Independent Living Program.
To achieve the results embodied in the performance measures, ACF requires qualified staff knowledgeable about the child protection and child welfare system in the States; data systems, computers, communications technology; statistical staff to monitor progress towards the goals; and ACF regional and central office staff experienced in working with States as partners. Finally, ACF needs to work with the States to conduct various data verification, Title IV-E, and child and family services reviews.
States continue to substantially exceed performance expectations in the Adoption Incentive Program. This program, authorized by ASFA, provides incentive funds for each adoption finalized in a fiscal year beyond the established baseline number of adoptions. As they did in FY 1999, States qualified for more funds for the Adoption Incentive Program than were appropriated in FY 2000.
Finally, ACF is embarking on a set of activities that will make use of performance-based outcome measures. These include the incorporation of outcome measures into the CFS reviews to determine State compliance with statutory provisions; the publication of the annual report on Child Welfare Outcomes for the States; and the use of AFCARS data in sampling for both the CFS reviews and the title IV-E reviews.
Program Coordination, Partnerships and Crosscutting Issues
Ultimately, decisions about placing children are made by judges in juvenile and family court systems throughout the nation. Improved judicial handling of child welfare cases will be essential to achieving permanency goals for children. Children in the child welfare system have many medical and mental health problems, while many of their parents are incapacitated by chronic substance abuse, mental health problems, homelessness, limited education, and other problems. The availability of services from other sectors to meet these needs is uneven. The expansion or contraction of services in various parts of the country will affect our performance. Major changes in assistance programs for low-income families as part of welfare reform will also have an unknown impact on the child welfare system over the next several years.
To insure that activities are coordinated with Federal partners which provide many of these services, ACF works closely on achieving its goals with the Department of Justice, the Substance Abuse and Mental Health Services Administration, the Temporary Assistance for Needy Families program and other national agencies and organizations whose responsibilities overlap with child welfare services.
In developing of the Adoption 2002 Initiative, developing and implementing the Family Preservation and Support Program (now reauthorized as the "Promoting Safe and Stable Families" program), and implementing ASFA, ACF conducted and continues to conduct a broad-based consultation process with a wide range of policy experts, advocates, foster and adoptive parents, and other interested individuals to ground its examination of strategies and issues in the daily experiences of participants in the child welfare system.
An example of the comprehensive approach ACF uses to obtain consultation in the child welfare area is the approach taken to develop performance outcome measures required by ASFA. In August 1998, ACF established a consultation group including representatives from State, Tribal, county, and municipal child welfare agencies; private non-profit child and family services agencies; State legislatures; Governors' offices; juvenile and family courts; local child advocacy organizations; and a national public employees' union. Also invited to serve as resources to the consultation group were representatives from several national organizations including the American Bar Association's Center on Children and the Law, the American Public Human Services Association, the Child Welfare League of America, the Children's Defense Fund, the National Association of Child Advocates, the National Center for Juvenile Justice, the National Child Welfare Resource Center for Organizational Improvement, the National Conference of State Legislatures, the National Council of Juvenile and Family Court Judges, and the National Governors' Association.
Staff from ACF, the Administration on Children, Youth and Families (ACYF), and the Office of the Assistant Secretary for Planning and Evaluation (OASPE) were also included in the consultation process. Department staff participating were those with expertise in child welfare services, outcome measurement for assessing system performance, national child welfare databases, and performance-based incentive systems.
As a result of this consultative process, the Department published a preliminary list of child welfare outcomes and measures in the Federal Register for public comment on February 2, 1999. Based on an analysis of the comments received, the Department made numerous changes to the preliminary list of outcomes and measures. On August 20, 1999, the Department published a final list of outcomes and measures in the Federal Register.
Program-wide Performance
State performance for the measures through FY 1999 (CY 1998 for measure 7.1a) appear to be mostly in the positive direction: the proportion of the children being reunified in less than one year is increasing (measure 7.1c); the total number of adoptions in FY 1999 reached the target set for FY 2000 (measure 7.1f); and the FY 2000 target for adoptions by relatives was achieved (measure 7.1k). These measures are directly related to the implementation of ASFA, which encourages speedier permanency decisions for children, particularly related to adoption.
However, the implementation of this legislation also resulted in some counter-intuitive trends in the following measures resulting from "good" rather than "bad" practice (measures 7.1d, 7.1h, 7.1i, and 7.1k). ACF is retaining (measure 7.1d) "increase the percentage of children who exit care through adoption within two years of placement". Currently these percentages are decreasing. However, as longer-term cases are cleared out of the system and as the required ASFA review for appropriateness of termination of parental rights are implemented, it is expected that the percentage of children who exit care through adoption within two years of placement will increase.
ACF is dropping three measures: measure 7.1h--"decrease the median length of time in care until adoption"(which is better captured by measure 7.1d-- "increase the % of children who exit care through adoption within two years of placement"); measure 7.1i--"decrease the adoption time difference between white and African-American children" and measure 7.1j--"decrease the adoption time difference between white and Hispanic children." These last two measures are being dropped because they are not programmatically sound. We believe that trends reported for the last two measures resulted from child welfare agencies' initial focus on the adoption of children who had been in the foster care system for a long time, particularly children in relative foster care which has notably longer lengths of stay and which affects a higher proportion of minority children. For further discussion of the programmatic soundness of these measures, please refer to pp. 107-108.
There are a small number of measures that continue to be affected by weaknesses in the data. These include the recurrence rate for maltreatment and exits through guardianships. Only nineteen States (1998) and 23 States (1999) reported adequate data to calculate the maltreatment recurrence rate, making that measure more likely to be unstable (measures 7.1a and b). In addition, guardianship, as a reason for discharge, has generally been under-reported and does not even exist as a discharge reason in some States (measure 7.1e).
Finally, because of the consistency in this measure over time, ACF believes that reducing the mean number of placement settings per episode to 2.0 is unrealistic (measure 7.1m). A new measure is being proposed which is better able to capture the concern about child well-being while in foster care (measure 7.1n).
Data Issues
Both AFCARS and the National Child Abuse and Neglect Data System (NCANDS) conduct extensive edit checks for internal reliability. For AFCARS, if a State's data fail certain edit checks, the State incurs a financial penalty. An additional 700 edit checks are conducted to improve data quality. All edit check programs are shared with the States. Compliance reviews for AFCARS are currently being piloted and State SACWIS systems are undergoing reviews to determine the status of their operation. In FY 1999, the Department's Office of the Inspector General began auditing the child welfare GPRA measures. As these reporting systems improve, the operationalization of various outcomes has become more refined. Furthermore, as the number of jurisdictions (including the District of Columbia and Puerto Rico) reporting has increased from 32 in FY1995 to 51 in FY 1999 for foster care and from 29 in FY 1995 to 52 in FY 1999 for adoption, the values of the measures change and they more accurately reflect the total population. Because of this improvement in reporting, no data prior to FY 1998 (CY 1998 for measures 7.1.a-b) is being included in examining trends.
To speed improvement in these data, the agency has awarded funds to develop and implement the National Resource Center for Information Technology in Child Welfare. This Resource Center provides technical assistance to States to improve reporting to AFCARS and NCANDS, improve statewide information systems, and better utilize their data. These activities should result in further improvements in the data over the next few years.
Summary Table
|
Performance Measures |
Targets |
Actual Performance |
Reference | ||
|
A. SAFETY: Children are protected from abuse and neglect in their homes. The risk of harm to children will be minimized. 7.1a. Decrease the percentage of children with substantiated reports of maltreatment who have a repeated substantiated report of maltreatment within 12 months.a |
|
|
| ||
|
7.1b. Decrease the percentage of children with substantiated reports of maltreatment that have a repeated substantiated report of maltreatment within 6 months. |
CY 02: 7% |
CY 02: |
Px M-108 | ||
|
a The National Child Abuse and Neglect Data System (NCANDS) collects data by calendar year. Data necessary for calculating this measure for CY 2000 will not be available until late in 2002. The number in parentheses for the target for CY 1999 is a more realistic target based on a revised calculation approach. The information for CY 1998 is based on 19 States reporting and for CY 1999 on 23 States. Due to the varying number of States reporting on this measure and on 7.1b, data are expected to continue to fluctuate. | |||||
|
B. PERMANENCY: Provide children in foster care permanency and stability in their living situations. 7.1c. Increase the % of children who exit the foster care system through reunification within one year of placement. |
|
|
| ||
|
7.1d. Increase the % of children who exit care through adoption within two years of placement.b |
FY 02: 28% |
FY 02: |
Px M-108 | ||
|
7.1e. Maintain the % of children who exit foster care through guardianships within two years of placement. |
FY 02: 67% |
FY 02: |
Px M-109 | ||
|
7.1f. Increase the number of adoptions.b
7.1g. Increase the number of guardianships |
FY 02: 56,000 |
FY 02: |
Px M-109 | ||
|
b The number included for the FY 1999 target was the projected number in the FY 1999 Performance Plan. In developing the baseline for the Adoption Incentive Program authorized under the Adoption and Safe Families Act, it was determined that the number of adoptions had been substantially underestimated due to weaknesses in State information systems and a lack of incentives to report. The reporting of adoptions has substantially improved and is believed to be almost 100% because of implementation of Statewide Automated Child Welfare Information Systems (SACWIS), the AFCARS penalties and the Adoption Incentive Program. The number in parentheses for the FY 1999 target represents a more realistic number. The FY 1995, FY 1996 and FY 1997 actual performance numbers were reported by States to establish the baseline for the Adoption Incentive Program. These numbers come from a variety of sources including AFCARS, court records, legacy administrative data systems and hand counts. These numbers are included so that trends can be more accurately assessed. | |||||
|
7.1h. Decrease the median length of time in foster care until adoption.c
7.1i. Decrease the adoption time difference between white and African-American children
7.1j. Decrease the adoption time difference between white and Hispanic children |
FY 01: Dropped |
|
|||
|
c The calculations for this measure have been particularly unstable because of under-reporting the reason for discharge from foster care intermittently by many, including very large States. Depending on the array of the States included in the calculations, the percentages vary widely. The numbers in parentheses for 7.1h and 7.1i are more realistic targets based on more current data. | |||||
|
7.1k. Increase adoptions by relatives.
7.1l. Increase guardianships by relativesd |
FY 01: Dropped |
FY 00: 18% |
|||
|
C. FAMILY AND CHILD WELL-BEING: Minimize the disruption to the continuity of family and other relationships for children in foster care.
7.1m. Decrease the mean number of placement settings per episode.
7.1n. For those children who had been in care less than 12 months, increase the percentage that had no more than two placement settings. |
|
|
| ||
|
d Data on guardianships
have been particularly unstable. For further discussion, see section
"Program-wide Performance." | |||||
|
Total Funding (includes Independent Living/Foster
Care/Adoption-dollars in millions) |
FY 02: $7726.4 |
Bx: budget just. sections C, E, H, & L | |||
Performance Measures for FY 2002 and Final Measures for FY 2001
In 1997, Congress passed the Adoption and Safe Families Act (PL 105-89). Among other provisions designed to improve the child welfare system and protect children, it directs the Secretary of DHHS to consult with governors, State legislatures, and State and local public officials responsible for administering child welfare programs and develop a set of outcome measures for rating the performance of States in operating child protection and child welfare programs. (See Section on Program Coordination, Partnerships and Crosscutting Issues for a detailed description of the process.) Based on this consultation, additional close examination of each of the measures for methodological and programmatic soundness, the need to use the same measures when operationalizing the same concept in each of the major activities related to performance outcomes (the annual report, child and family services reviews, and GPRA), we have made a number of changes in measures for FY (CY) 2001 as discussed below.
In FY 2000, Congress passed legislation authorizing a substantial increase in funds for independent living services for foster care youth under title IV-E of the Social Security Act. These services prepare them for independent living by enhancing their education, employment and other skills to avoid dependency; and by expanding opportunities for youth to live independently while under the auspices of the public child welfare agency. This legislation requires developing and implementing outcome measures and a data collection system for this program.
Finally, in collaboration with States, Tribes, advocacy groups, foundations and others, ACF has developed new program monitoring procedures that focus on the quality of child welfare services and the outcomes for children and families. These reviews will be implemented through Federal/State partnerships. Following these reviews, States will receive immediate feedback on the extent to which their programs are achieving the stated objectives.
PROGRAM GOAL-SAFETY: Children are protected from abuse and neglect in their homes. The risk of harm to children will be minimized.
New
7.1b. FY 2001: Decrease the percentage of children with substantiated reports of maltreatment who have a repeat substantiated report of maltreatment within 6 months from 8% in CY 1998 to 7% in CY 2001.
FY 2002: Decrease the percentage of children with substantiated reports of maltreatment who have a repeat substantiated report of maltreatment within 6 months from 8% in CY 1998 to7% in CY 2002.
Data source: National Child Abuse and Neglect Data System (NCANDS)
PROGRAM GOAL-PERMANENCY: Provide children foster care permanency and stability in their living situations.
7.1c. FY 2001: Of the children who exit the foster care system through reunification, increase the percentage of children who do this within one year of placement from 63% in FY 1998 to 67%.
FY 2002: Of the children who exit the foster care system through reunification, maintain the percentage of children who do this within one year of placement at 67%.
Data source: AFCARS
7.1d. FY 2001: Of the children who exit foster care through adoption, increase the percentage who are adopted within two years of placement from 23% in FY 1998 to 28%.
FY 2002: Of the children who exit foster care through adoption, increase the percentage who are adopted within two years of placement from 23% in FY 1998 to 28%.
Data source: AFCARS
These performance indicators (measures 7.1b-d and 7.1n) are reflective of a series of efforts to focus on outcomes in child welfare. They are being used in two places where they are having substantial impact on State practice. First they are being used in the Annual Child Welfare Outcomes report. This report, required under section 479b of title IV-E of the Social Security Act contains data for each State on a variety of outcome measures. In addition, these measures are being used in the Child and Family Services Reviews and failure to meet the standards associated with them can result in a State's being found not to be in substantial conformity with the State plan requirements in title IV-B and IV-E of the Social Security Act. The National Resource Centers funded by the Children's Bureau are offering technical assistance to States to help them improve the services they deliver to children and their families and to meet the State plan requirements.
7.1e. FY 2001: Of the children who exit foster care through guardianships, change the percentage of children who do this within 2 years from 70% in FY 1998 to 67%.
FY 2002: Of the children who exit foster care through guardianships, maintain the percentage of children who do this within 2 years at 67%.
Data source: AFCARS
This measure is being used in the Annual Child Welfare Outcomes report and technical assistance being provided in association with the Child and Family Services Reviews is focusing on all aspects of permanency, including guardianship. (See previous discussion under Program Activities, Strategies and Resources for more detail.) Note: Targets for both FY 2001 and 2002 are increases over actual FY 1999 performance. This measure continues to be affected by weaknesses in the data: guardianship, as a reason for discharge, has generally been under-reported and does not even exist as a discharge reason in some States.
7.1f. FY 2001: Make progress towards increasing the number of adoptions of children in the public foster care system between FY 1998 and FY 2002 by increasing adoptions from 36,000 in FY 1998 to 51,000.
FY 2002: Increase the number of adoptions to 56,000.
Data source: Baselines from the Adoption Incentive Program and the Adoption 2002 Initiative for FY 1997 and AFCARS for all subsequent years.
The implementation of the termination of parental rights provision of the Adoption and Safe Families Act (ASFA) is expected to increase the total number of adoptions of children from the foster care system. In addition, the statute created the Adoption Incentive Program that provides incentive funds to States that increase the number of finalized adoptions over the State's baseline. The National Resource Centers and Federal staff are providing technical assistance to States to help them implement both of these activities.
In FY 2001, ACF will develop a new measure for relative adoption that is not sensitive to policy changes in large States. Under specific consideration is a measure that reports the number of States that increase their relative adoptions each year. Either this measure or another that is not sensitive to policy changes in large States and that is methodologically and programmatically sound will be included in the FY 2003 performance plan. FY 2000 will be the baseline year.
PROGRAM GOAL-FAMILY AND CHILD WELL-BEING: Minimize the disruption to the continuity of family and other relationships.
New
7.1n. FY 2001: For those children who have been in care less than 12 months, increase the percentage who had no more than two placement settings from 70% in FY 1998 to 72%.
FY 2002: For those children who have been in care less than 12 months, increase the percentage who had not more than two placement settings from 70% in FY 1998 to 74%.
Data source: AFCARS
PROGRAM GOAL--PREPARE FOSTER CARE YOUTH FOR INDEPENDENT LIVING: (a) enhance the education, employment and other skills of foster care youth to avoid dependency; and (b) expand opportunities for youth to achieve self-sufficiency while under the auspices of the public child welfare agency.
In FY 2001, ACF will develop and implement the methodology to determine the baselines for the number of foster care youth receiving independent living services and/or living independently under the auspices of the public child welfare agency and develop preferred outcome measures for independent living programs. The baseline will be established for FY 2002 and the first target will be set for FY 2003.
DEVELOPMENTAL DISABILITIES (EDUCATION)
The DD education goal is: "Increase the number of students with developmental disabilities who reach their educational goals." This goal includes the following outcomes: "Students with developmental disabilities have educational experiences based on their individual needs and goals and have access to an array of educational opportunities in their neighborhood schools. Parents know their rights regarding their children's education. Educators are prepared to educate all students and public policy supports appropriate education."
(See information on DD partnership process, data, and resources under Strategic Objective 1.)
Program-wide Performance
Performance for the number of students with developmental disabilities served in more integrated /inclusive educational settings (measure 7.2a) has experienced significant increases and decreases in years prior to FY 1999. These fluctuations have been caused by the use of varying methodology from State to State and from year to year as States gained experience in making projections and collecting performance data. For that reason, FY 1999 has been selected for the baseline year. In FY 2000, Protection and Advocacy (P&A) systems in all 56 States and Territories reported results (defined as 50 or more students) for a total of 10,054 students with developmental disabilities served in more integrated/inclusive educational settings as a result of P&A system intervention. This performance is consistent with FY 1999 results and exceeded the FY 2000 target by 1,300 students. P&A interventions included counseling parents on advocating for their children, negotiating better placements, counseling school systems on the rights of students with disabilities, administrative remedies, and, in extreme cases, litigation.
Summary Table
|
Performance Measures |
Targets |
Actual |
Reference |
|
Program Goal: Increase the number of students with developmental disabilities who reach their educational goals. 7.2a. Increase the number of students with developmental disabilities who are served in more integrated/inclusive educational settings as a result of DD program intervention. |
FY 02:11,500 FY 01:11,000* FY 00: 8,800 FY 99: 8,000 |
FY 02 FY 01: FY 00: 10,054 FY 99:10,901Ö (Baseline) |
Px M-111 |
|
Ö This represents FY 1999 data not available when the FY 1999 report was submitted with the FY 2001 CJ *Increases in the FY 2001 target for measure 7.2a is based on FY 2000 performance. | |||
Performance Measures for FY 2002 and Final Measures for FY 2001
Performance for this measure is affected by a number of factors including the impact of the economy on the cost of providing educational services to people with disabilities, the impact of social attitudes regarding the desirability and potential for people with developmental disabilities to learn in the least restrictive environment, and funding priorities in individual States.
The above issues combined with data collection and interpretation difficulties continue to create instability in the data. ACF is providing technical assistance to State programs to improve data stability and programmatic outcomes.
Program Goal: Increase the number of students with developmental disabilities who reach their educational goals.
Objective: Increase the number of students with disabilities who are served in more integrated/inclusive educational settings
7.2a FY 2001: Increase to 11,000 the number of students with developmental disabilities who are served in more integrated/inclusive educational settings as a result of DD program intervention.
FY 2002: Increase to 11,500 the number of students with developmental disabilities who are served in more integrated/inclusive educational settings as a result of DD program intervention.
Data source: P&A annual Program Performance Report (PPR)
Because the perceived cost of providing an education in less restrictive environments is high, we have limited ability to accurately project performance. Our efforts are focused on achieving gradual improvement for this measure.
To accomplish this goal, the States work with three different program delivery approaches. The Council on Developmental Disabilities (CDD) works to create systems change within the education systems, including demonstration of more desirable models. Educational and research efforts contribute to improving public and professional opinion on education for persons with developmental disabilities involving both the Council and the Centers for Excellence/University Affiliated Programs (UAPs). Protection and Advocacy Programs have worked to ensure that the rights of students with developmental disabilities to a free and appropriate public education in the least restrictive environment are protected.
DEVELOPMENTAL DISABILITIES (HEALTH)
The DD health care goal is: "Improve the health of people with developmental disabilities and increase their access to the full range of needed health care services." This goal includes the following outcomes: "Individuals with developmental disabilities and their families have access to the health care information they need to make choices. Health care for people with developmental disabilities is available, affordable, accessible, and equitable. Health care personnel are appropriately qualified to meet the health care needs of people with developmental disabilities."
(See information on DD partnership process, data, and resources under Strategic Objective 1.)
Program-wide Performance
There have been concerns with fluctuations in the data prior to FY 1998 for Performance Measure 7.3a caused by the use of varying methodology from UAP to UAP. Some of these fluctuations occurred as UAPs gained experience in making projections and collecting performance data. For that reason, FY 1998 has been selected as the baseline year. In FY 1999, UAPs reported 4,100 health care providers trained to meet the needs of people with developmental disabilities (measure 7.3a).
Summary Table
|
Performance Measures |
Targets |
Actual |
Reference |
|
Program Goal: Improve the health of people with developmental disabilities and increase their access to the full range of needed health care services. 7.3a. Increase the number of health care providers trained to meet the health needs of people with developmental disabilities as a result of DD program intervention. |
|
|
Px |
|
Availability of FY 2000 Data: Data are expected to be available in January 2002 Ö This represents FY 1999 data that were not available when the FY 1999 report was submitted with the FY 2001 CJ. | |||
Performance Measures for FY 2002 and Final Measures for FY 2001
Performance for this measure is affected by a number of factors including the impact of the economy on the cost of providing health care generally, and especially to people with disabilities; the impact of social attitudes regarding the desirability and potential for people with developmental disabilities to benefit from full access to health care and the attitudes of health care providers toward this special needs population.
The above issues combined with difficulties in data collection and interpretation have created instability in the performance data. ACF's technical assistance to University programs has helped to improve data stability and programmatic outcomes. Performance for this measure in FY 2002 is projected to increase.
Program Goal: Improve the health of people with developmental disabilities and increase their access to the full range of needed health care services.
Objective: Increase the number of health care providers trained to meet the health needs of people with developmental disabilities.
7.3a. FY 2001: Increase to 5,000 the number of health care providers trained to meet the health needs of people with developmental disabilities as a result of DD program intervention.
FY 2002: Increase to 5,200 the number of health care providers trained to meet the health needs of people with developmental disabilities as a result of DD program intervention.
Data source: UAP annual report
This measure focuses on the access to proper health care for persons with developmental disabilities. Because so few health care professionals are aware of the special health care needs of persons with developmental disabilities, there is a significant need for training. Actual performance remains unstable, largely due to changes in allocation of training resources, but we believe there is potential for gradual improvement.
Three programs in the States combine to provide a comprehensive approach to accomplishing this target. The Council on Developmental Disabilities (CDD) works to create systems change within the health care systems, including demonstration of more desirable models. Education and research efforts strive to improve public and professional opinion on health care, involving both the Council and the Centers for Excellence/University Affiliated Programs. The University Affiliated Programs are the main providers of training to health care professionals. Protection and Advocacy Programs have worked to ensure that the rights of patients with developmental disabilities are protected.
Program Description, Context, Legislative Intent and Broad Program Goals
Legislative Intent and Broad Program Goals: The Runaway and Homeless Youth (RHY) Program began in 1974 in response to concern about increasing numbers of runaway youth exposed to exploitation and the dangers of street life. It has subsequently been expanded to assist homeless youth both on a short-term basis and in making the transition to independent living. Fundamental to ACF's approach to youth programs is the concept of positive youth development, which values young people and recognizes their strengths and abilities. Youth who are nurtured by caring adults, who are given opportunities to become involved in work or education that builds their skills, who receive support and protection during challenging times, and who are actively engaged in service to the community can become valuable contributors to the quality of community life.
The Runaway and Homeless Youth Program, recently reauthorized under the Runaway and Homeless Youth Act of 1999, funds approximately 640 grants for three community-based service programs to alleviate the problems of runaway and homeless youth: the Basic Center Program (BCP), the Transitional Living Program for Homeless Youth (TLP), and the Street Outreach Program (SOP - also known as Sexual Abuse Prevention Grants). In ACF, the Family and Youth Services Bureau (FYSB) administers the RHY programs.
A request for $33 million will fund a new initiative for maternity group homes (community-based, adult-supervised group homes) for young pregnant and parenting women not more than 21 years of age who cannot live safely with their own families. This program has been proposed under the established Runaway and Homeless Youth program. These homes will provide safe, stable, nurturing environments for mothers and assist them in moving forward with their lives by providing support so they can finish school, acquire job skills, and learn to be good parents.
Program Context: The National Network for Youth, an educational and advocacy organization whose members include many of the RHY organizations, summarizes on its website (www.nn4youth.org/runaway_and_homeless_youth.htm ) what is known about the numbers and demographics of this population:
"It is estimated that 1 to 3 million youth run away from their homes each year (U.S. General Accounting Office [GAO], 1989). A 1988 study of missing, abducted, runaway and "thrownaway" youth reported the number of runaways and thrownaways to be 577,800 in a year (Finkelhor et al., 1990). In a more recent study by the Research Triangle Institute (RTI), an estimated 2.8 million youth living in households in the United States reported a runaway experience during the prior year (Greene et al, 1995). The size of the homeless youth population has been estimated to be approximately 300,000 young people each year (Institute for Health Policy Studies, 1995). Reports from the field indicate that the number of homeless youth is rising. While data can validate the scope of the phenomenon, debating the actual number of youth who have run away or are homeless can deflect attention from the hard reality of the dire circumstances in which many young people live....
"The ages of runaway and homeless youth generally range from 12 to 21. Government reports typically indicate that the majority of youth who run away are between 14 and 17 years of age and those who live on the streets are between 16 and 21 years of age (GAO, 1989)."
The size and composition of the young homeless population varies with the economy, local and national demographics, community viability, school quality, family dynamics, and other factors. Most of the youth served in the RHY programs seek assistance because of problems with parental substance abuse, emotional, sexual and/or physical abuse and neglect, or other adolescent/parental relationship issues. The ACF Runaway and Homeless Youth (RHY) programs are able to shelter and provide face-to-face services to only about 55,000 to 75,000 youth annually (Runaway and Homeless Youth Management Information System).
Youth in high risk situations are affected by all the stresses of modern society, e.g., income inequality, economic dislocation, availability and misuse of intoxicating substances, child abuse, family instability, loss of a parent as a role model, early sexual maturation ahead of emotional or cognitive maturation, crime perpetration or victimization, the influence of predatory social groups or individuals, racism, sexism, and homophobia.
The ability to serve and achieve positive outcomes for at-risk youth is often affected by the youths' resistance to help, their distrust of authority, and the severity of the circumstances in which they are found or are trying to flee. This often invisible population is hard to track, resists contact, and is highly variable in living arrangements from month to month or day to day.
Once youth are served in an RHY center, a limited amount of reliable personal information may be obtained, assuming the youth's reticence can be overcome. Studies have found strong links between family circumstances, especially familial substance use, and the high-risk behaviors of runaway, throwaway, and homeless young people. Disruptive family conditions may be the principal reason that young people leave home. Familial substance abuse co-occurs with youth substance abuse, youth suicide attempts, and other problem behaviors. More than half of the youth interviewed during their stays in shelters reported that their parents either told them to leave or knew they were leaving and did not care.
Program Activities, Strategies and Resources:
Positive Youth Development: Over the past several years, the Family and Youth Services Bureau (FYSB) of ACF has sponsored efforts to broaden and re-focus the agency's mission upon "positive youth development." This approach encourages communities to provide the settings and services needed for young persons' healthy growth and development. The positive youth development framework identifies the stages of growth from early adolescence to adulthood, the needs associated with it, and the factors and settings which nurture it. The following key principles are important in the development of young people as they work toward a successful and productive adulthood:
Positive youth development focuses on assets rather than weaknesses (whether in normal or in high-risk situations) in redirecting youth toward healthy pathways of development. This does not mean overlooking vulnerabilities or ignoring problems. However, as Dr. Karen Pittman, a distinguished researcher in the youth field, has often said: "Problem-free is not fully prepared." (What is Youth Development: Preventing Problems or Promoting Development--Competing Priorities or Inseparable Goals?, Karen Johnson Pittman, Senior Vice President, International Youth Foundation).
As set forth in "A National Blueprint for Youth" (see discussion of this ACYF initiative in the following pages), key elements of positive youth development are:
If these factors are being addressed at the same time as basic needs--such as safety, security, good nutrition and access to health care and other essential services--are being fulfilled, young people can become not just "problem-free" but "fully prepared" to engage constructively in their communities and society.
Positive youth development principles can provide a framework for policy-making, programmatic initiatives, and design of service delivery. FYSB believes it is crucial that positive developmental opportunities be available to all young people during adolescence, a time of rapid growth and change. Adolescents need the chance to fulfill their developmental needs-intellectually, psychologically, socially, morally and ethically. Youth benefit from experiential learning and need to belong to a group, while maintaining their individuality. At the same time, they want and need adult support and interest as well as opportunities to express opinions, challenge adult assumptions, develop the ability to make appropriate choices, learn to use new skills, and make a contribution to the community around them.
Program Support: In addition to administering financial grants to the nationwide network of RHY grantees, soliciting and evaluating applications for funding and making awards accordingly, FYSB monitors RHY services to improve overall program quality and ensure the attainment of measurable results. This monitoring involves on-site visits by FYSB regional office staff (supported by trained peer reviewers) and technical assistance and training for grantees. The regional offices provide technical assistance through a network of ten provider organizations, operating under cooperative agreements, one in each region. All grantees have access to their services.
FYSB funds the National Runaway Switchboard, a twenty-four hour, seven-day hotline staffed by trained counselors who listen to and counsel youth in crisis situations and connect them with appropriate services. The Switchboard has multi-lingual service capacity. FYSB also maintains the National Clearinghouse on Families and Youth (NCFY), which provides extensive information and analytical resources to the field, publishes newsletters and other documents, and exhibits at conferences. Information dissemination also takes place through websites maintained by FYSB, NCFY, and the Switchboard. During FY 2000, FYSB also assumed responsibility for an HHS "YouthInfo" website, previously maintained by the HHS Office of the Assistant Secretary for Planning and Evaluation. This website will be integrated with the other FYSB-affiliated web pages and continue to offer information on youth issues, positive youth development, programs, and resources with HHS-wide scope and government-wide links.
During FY 1998 and 1999, FYSB worked with ACF, contractors, and partners to assure that the Runaway and Homeless Youth Management Information System (RHYMIS), the National Clearinghouse on Families and Youth, the National Runaway Switchboard, and grantee information and service systems were ready for the Y2K transition. These efforts included working with the National Switchboard to upgrade their telecommunications and voice mail system to be Y2K compliant. Previously, RHYMIS had been modified and verified to be Y2K compliant. RHY grantees were given technical assistance and guidance on meeting the Y2K challenges. No Y2K incidents were reported in the RHY universe.
Due to difficulties experienced by grantees in reporting program information through RHYMIS (discussed in more detail under "Data Verification and Validation," below), FYSB is streamlining and simplifying the system. Efforts to increase the level and accuracy of reporting have had some success but many grantees lack the trained staff to effectively answer the more than 200 detailed and complex questions in RHYMIS. (These questions also incorporate responses and data elements that are an order of magnitude more numerous than the questions alone.) During FY 2001, FYSB is continuing to modify and add resources to the RHYMIS information technology contract to create and install a new user interface based on a smaller, more relevant and practical set of questions. The questions were developed in consultation with regional staff, NCFY experts, and representatives of the runaway and homeless youth service field, all of whom welcome the simplified requirement. RHYMIS reporting frequency will be reduced from quarterly to semi-annually.
These changes will produce better data both for GPRA and for FYSB's Report to Congress, as well as providing information that grantees can use in their own jurisdictions.
Program Coordination, Partnerships and Crosscutting Issues:
On May 2, 2000, the White House held a conference on Raising Responsible and Resourceful Teenagers in the 21st Century. FYSB played a key supporting role in this event by helping to identify participants, developing agenda concepts and handouts, hosting a local satellite viewing of the conference in Washington and with ACF regional staff around the country, and funding travel to the event by parents and youth.
During FY 2000, FYSB and ACYF held meetings, focus groups, and consultations, and developed publications and other documents based on "the National Blueprint for Positive Youth Development." ACYF and FYSB have involved other programs across ACF and HHS and worked closely with the Departments of Justice, Labor, Education, Housing and Urban Development, Agriculture, and Transportation, as well as the Corporation for National Service, to formulate and clarify common principles and objectives in positive youth development. The effort featured a half-day forum in February 2000 at the annual Symposium of the National Network for Youth (the membership association of RHY and youth-serving grantees), with audience participation by individual youth and RHY grantees, and panelists from Justice, Labor, Education, HHS, the Ford Foundation, the National Collaboration for Youth, the National Network for Youth, and the National Academy of Science. Work on the Blueprint continued throughout FY 2000 with the development of a document for eventual clearance and distribution through the world wide web and mailings by endorsing organizations. The latter are expected to include foundations active in the youth field, youth-serving organizations, intergovernmental associations, and the original partnering Federal departments. Follow-up activities could include interagency conferences on positive youth development, goal setting and performance measurement, and efforts to improve interagency coordination on program announcements, technical assistance, and research.
Since September 1998, FYSB has funded State Youth Development Collaboration Projects to develop and support innovative youth development strategies at the State level. FYSB had originally set a target of five States but was able to award funding to eight States and fund a ninth State with the help of the ACYF Children's Bureau (CB). Each of the following States receives an annual grant of $120,000, renewed in each of three years: Arizona, Colorado, Connecticut, Iowa, Maryland, Massachusetts, Nebraska, New York, and Oregon. With the support of its partner, the Children's Bureau, FYSB added four more States during FY 2001: Illinois, Indiana, Kentucky, and Louisiana. The grants enable the States to develop new, or strengthen existing, youth development infrastructures, partnerships and policies. These efforts focus on all youth, including at-risk youth such as runaway and homeless youth, youth leaving the foster care system, abused and neglected children, and other youth served by the child welfare and juvenile justice systems. Each project will be evaluated before completion.
FYSB and the ACF CB are entering the sixth year of a collaborative effort to strengthen and expand a partnership to promote the youth development philosophy and approach in services to foster care and homeless youth, with particular reference to the expanded funding under the Chaffee Independent Living Program (ILP). FYSB's TLP grantees have valuable experience in helping disadvantaged older youths transition to a healthy and productive adulthood; thus, FYSB is helping CB's ILP connect with these community resources. In April 2000, FYSB funded travel by a large number of TLP grantees to the National ILP meeting in Boston. The State Collaborations funded by Children's Bureau will focus particularly on ILP linkages.
FYSB works with various health agencies in HHS and with other public, private, and non-profit entities to encourage use of the youth development framework in providing effective services to young people. FYSB is a member of the Teen Pregnancy Prevention Working Group. FYSB collaborates with and furnishes financial support for the four HHS-funded Girl Neighborhood Power Programs to continue providing effective services for young adolescents
The National Governors Association (NGA), with foundation support and consultative assistance from FYSB and other federal agencies (DOL, DOJ, Education, HUD, etc.), has established a ten State interdisciplinary learning network of forums, meetings, and issue briefings on youth development. FYSB's own State collaboration projects offer a useful parallel and seven of the FYSB states are in the NGA network, which will last eighteen months. FYSB and NGA continue to cooperate as their respective State youth development projects unfold.
FYSB partners with youth-serving organizations, foundations and RHY grantees on an ongoing basis, for example, involving youth organizations and selected grantees in making the changes in youth services data collection described above. FYSB's influence and ability to engage the RHY grantee organizations is enhanced by the training and technical assistance network, the monitoring process, and other oversight activities. Many of these widely diverse organizations receive support from multiple sources, including other ACF grants, State child welfare funds, substance abuse prevention funds, Department of Justice funds, private non-profit support, volunteerism, and faith-based organizations. Many operate multiple programs under the same roof, serving a diverse population of youth, families, and individuals.
Coordination across programs also takes place through the regional offices. For example, the ACF West Central Hub (Dallas and Denver regions) works with the Casey Family Foundation on a demonstration project looking at effective interventions designed to strengthen families and improve parent-child relationships in the families of sheltered youth, at-risk Head Start families, emerging families (pregnant and parenting teens), and possibly the families of youth in foster care. Statistics indicate that most children placed in foster care will return to the family of origin, though it may continue to be abusive and even dangerous. The ultimate goal of this project would be the diversion of youth from foster care placement.
Another regional project called "Safe Place Trucks and Trains" is establishing a collaboration between ACF, RHY grantees, the National Highway Traffic Safety Administration, the "Safe Place" program, the Teamsters' Union, the U.S. Department of Transportation, and major trucking companies to make trucks and trains "Safe Places." Significant numbers of youth travel on the interstates, "hitchhike" from the road, or meet drivers in truck stops and rest areas where they arrange rides. These youth engage in activities that include transporting controlled substances, survival sex and "panhandling." Through this project, "over-the-road" drivers with appropriate motives and interest would be identified and trained, background checks would be performed, and drop-off sites and procedures developed.
Program-wide Performance
During FY 1999, 53,000 runaway or homeless youths were reported as being "admitted to services." These youths received basic support, such as food, shelter, clothing, transportation, and counseling services. Other services included life skills training, recreation, substance abuse prevention, education, and health care. Most youths reported psychological issues, such as depression or suicide attempts. The prospect of increased services for mental health could provide additional help for troubled individuals.
There has been a reported decrease between FY 1998 and FY 1999 in the numbers of youth "admitted to services" in RHY centers. This number probably does not represent a decrease in the actual number of youth sheltered and treated or in need for the following reasons. Currently all RHYMIS data is unreliable due to chronic low levels of grantee reporting (less than 50% reporting fully). The RHYMIS technical assistance provider has anecdotal evidence that suggests many youth were being treated at RHY agencies but not counted as "admitted to services;" many homeless youth are treated at RHY centers but not counted in RHYMIS because their services are funded by non-Federal resources (e.g., United Way funds); and many runaway and homeless youth are sheltered by non-RHY organizations or find no shelter at all and end up on the street.
Performance data details for certain measures
Researchers agree that it is nearly impossible to determine the overall number of runaway and homeless youth in the U.S. Homeless adults are hard to count and estimates vary widely. The numbers of homeless American youth, who often conceal themselves or migrate from one temporary living situation to another, are even harder to measure. A recent study by the U.S. Conference of Mayors (USCM) estimated that "unaccompanied minors" represent 7% of the total homeless population in 26 cities studied.
Based on research released in February 2000 by the Urban Institute, an estimated 3.5 million people become homeless in the course of a year. If the 7% USCM rate is applied (albeit "unscientifically") to the Urban Institute estimate, homeless unaccompanied minors could number nearly a quarter of a million. Thus, large numbers of vulnerable children in their teens could separate from their families, become homeless and be at-risk in areas not served by FYSB's limited program resources.
While the general economic well-being of the late 1990's has somewhat reduced social problems and stresses that put pressures on families and influence youth to run away or seek shelter away from home, demographics indicate the level of potential need is holding steady. Current numbers of youth remained static during the 1990's. A nearly 12% increase in the youth population may be expected over the next ten years as the larger cohort of children aged five to fourteen matures into middle and late adolescence.
Measure 7.4a Maintain the proportion of youth living in safe and appropriate settings after exiting ACF-funded services
|
Safe and appropriate settings after exiting FY 2000 |
Safe and appropriate settings after exiting FY 1999 |
Safe and appropriate settings after exiting FY 1998 |
Safe and appropriate settings after exiting FY 1997 |
Safe and appropriate settings after exiting FY 1996 |
|
|
Females 16,709 |
Females 28,455 |
Females 32,815 |
Data not available (collected through Pre-GPRA predecessor system with criteria not consistent with current collection) |
Methodology: From the RHYMIS Youth Profile (composite for both BC and TLP), count all youth with "positive" youth outcomes for "Living Situation at Exit" and divide by the total number of youth served. "Positive outcomes" would be all outcomes except: on the run, on the street, in squat, correctional institute or detention center, other temporary shelter, other, do not know.
Measure 7.4e: Increase the proportion of Basic Center and Transitional Living program youth receiving peer counseling through program services.
|
Youth receive peer counseling services FY 2000 |
Youth receive peer counseling services FY 1999 |
Youth receive peer counseling services FY 1998 |
Youth receive peer counseling services FY 1997 |
Youth receive peer counseling services FY 1996 |
|
|
Females 1,956 |
Females 3,798 |
Females 3,645 |
Data not available (collected through Pre-GPRA predecessor system with criteria not consistent with current collection) |
Methodology: From the RHYMIS Youth Profile (composite for both BC and TLP), count the number of youth receiving "peer counseling" and divide by the total number of youth served.
Measure 7.4j: (deleted in FY 2001): Increase the proportion of ACF-supported youth programs that are using community networking and outreach activities to strengthen services.
|
Community networking FY 2000 |
Community networking FY 1999 |
Community networking FY 1998 |
Community networking FY 1997 |
Community networking FY 1996 |
|
|
Using area services 152 |
Using area services 229 |
Using area services 232 |
Data not available (collected through Pre-GPRA predecessor system with criteria not consistent with current collection) |
Methodology: From the RHYMIS Agency Program Profile (composite for both BC and TLP), count the number of grantees using any (at least one) of the "area services" (outreach, promotional instructional material, language assistance services, respite care, community/educational events, training/consultation or other) and divide by the total number of grantees reporting in that period. (In this denominator, do not include the total number of grantees that were funded, only the total reporting.)
ACF failed to achieve the projected targets in all three of these measures. Until improvements to RHYMISA are fully implemented (FY 2002 will be the first full year of data), we know very little about the achievement or progress for these measures since the old RHYMIS data is incomplete (only 45% reporting level in a recent year) and unreliable on a national basis. For measure 7.4j, the current and past RHYMIS data is incomplete and an evaluation, confirmed by anecdotal evidence, indicates that there has been a significant decline in community resources available for referrals and services for RHY youth. This decline is a factor beyond the control of the RHY community. We are providing FY 1999 data (and will report FY 2000 data) but acknowledge that it is extremely unreliable.
Data Issues
Data Verification and Validation: Data sources for RHY GPRA measures previously were limited to RHYMIS. For FY 2002, data from the National Runaway Switchboard (NRS) and grantee annual reports will be added on a pilot basis. The NRS data are gleaned from records of those calls in which it is possible and appropriate for NRS staff to gather information beyond the basic facts needed to help the caller. The data are not a statistical sample of all calls received during the year, but represent over 30% of youth crisis calls logged and provide a reasonably reliable indication of the situations of many young callers.
RHYMIS is an automated and manual system with evaluation features included if the data reported are accurate and correct. The RHYMIS software has built-in validation, verification and quality assurance routines to assist grantees in producing high quality data. The RHYMIS Data Quality report may be run at any time by RHYMIS users, affording them a way to identify missing or invalid data. Additionally, a series of data validation checks occur automatically prior to each data transfer. After the contractor receives the data, they are put through an additional series of checks to assure that the format is correct and virus-free.
RHYMIS features a number of data quality checks performed interactively as users enter RHYMIS data. Improved data reliability results from instantaneous feedback provided to the users as data are entered. RHYMIS is a Windows application with a graphical interface. A dramatically streamlined version of RHYMIS is currently under development. (This work-in-progress is being dubbed "RHYMIS-LITE".) Beta testing is planned to begin in FY 2001.
For both RHYMIS and the RHYMIS-LITE system which will replace it, additional data quality checks are performed at the national level during the logging and integration processes, including an assessment of non-reports. Software is used to remove duplicate data and check for missing or erroneous data before they are integrated into the national database. The RHYMIS Technical Support team interacts with those agencies submitting problematic transfers or failing to report and works to determine their underlying source of difficulty. Grantee agencies are then able to address input problems and re-submit data before the end of the reporting period.
Compliance and completeness of reporting: Improvements in both technical and support areas of the RHYMIS software have brought increased rates of grantee compliance with data submission requirements. The RHYMIS national data submission rate has continued to increase over the past years. We believe this trend will continue as grantee agencies become increasingly aware of the many ways they can use the RHYMIS data to improve their own reporting and evaluation processes and certainly as reporting tasks are simplified.
|
Recent Levels of RHYMIS Reporting Compliance | |||
|
|
FY 1997 |
FY 1998 |
FY 1999 |
|
% of grantees who submitted in the 4th quarter. |
62% |
65% |
77% |
|
% of grantees who submitted in at least one quarter. |
88% |
89% |
95% |
|
% of grantees who submitted in all four quarters. |
39% |
35% |
45% |
The RHYMIS technical support team has taken a proactive role in familiarizing grantee agencies with the new software and encouraging its use. Support staff continue to aid grantees experiencing difficulty with the application by completing over-the-phone training on application procedures. RHYMIS also has a web page that can be accessed from the FYSB homepage. It features downloads of the RHYMIS application, executable updates, a conversion utility, answers to frequently asked questions, information about RHYMIS Technical Support, release notes, installation guides, and reports from the National Database.
Early identification of problems with Federal transfer data is now possible with the enhanced logging and integration software. This early identification allows the RHYMIS technical support team to contact grantees and help them to determine and correct problems. Grantee agencies are then able to re-submit corrected data before the end of the reporting period and maintain submission compliance.
As FYSB streamlines the RHYMIS-LITE software and reporting requirements to focus them on information needed for GPRA and for the biannual report to Congress required by the legislation, grantees will need less time for reporting through RHYMIS-LITE and can spend that time helping youth. When the simpler, more relevant RHYMIS-LITE instrument is ready, a clear message will be sent that complete and accurate reporting is a condition of receiving RHY grant funds, a condition already highlighted in program announcements and performance standards. Program quality assurance, accountability and improved RHYMIS-LITE reporting levels are priority goals of FYSB, the RHYMIS contract, the on-site monitoring process conducted by regional staff and peer monitors, and the follow-up technical assistance program. Until then, considerable caution should be exercised in drawing conclusions from RHYMIS data submitted to date, including performance results, trends and baselines included in this plan.
Summary Table (with youth development outcome logic model):
For the FY 2002 Annual Performance Plan and the FY 2001 Revised Performance Plan, outcome domains, goals and objectives structure and several performance measures shown below have been added, revised or replaced. FY 2000 measures (including those being dropped from future plans) are reported as they appeared in the FY 2000 Revised Performance Plan, along with performance results for FY 2000 and FY 1999, but embedded in the new logic model structure. Where appropriate, outcome domains have been paired or overlapped.
|
Performance Measures |
Targets |
Actual |
Reference | |
|
1. Safe and Stable Living Situations: Runaway and homeless youth find safety, shelter and services that support their well-being and development into adults. | ||||
|
Program Goal: Provide appropriate shelter, counseling and other support services to youth and their families in high-risk situations. | ||||
|
7.4a. Maintain the proportion of youth living in safe and appropriate settings after exiting ACF-funded services. NOTE: Safe and appropriate living situation at exit would be all discharge outcomes except situations such as on the run, on the street, in squat, correctional institute or detention center, other temporary shelter, other, or do not know. |
FY 02: 96% |
FY 02: |
Px. M-127 | |
|
Note on "Social Indicator" 7.4b. The next measure is being presented as a pre-intervention "social indicator" which, while beyond the control of ACF, the National Switchboard, and RHY programs, could nevertheless provide valuable information about living conditions of the runaway and homeless youth population before they find safe shelters. | ||||
|
7.4b. Increase the proportion of runaway and homeless youth who are able to rely upon safer and more appropriate means of survival while on the street, (based on information from reports by youth calling the National Runaway Switchboard for help). (Developmental, FY 99 is tentative baseline) NOTE: "Safer means of survival" includes living with friends and relatives, using soup kitchens or shelters, or getting by on personal funds, and excludes stealing, prostitution, selling drugs, panhandling, police detention or "unknown." |
FY 02: |
FY 02: |
Px M-128 | |
|
2. A Feeling of Connectedness to Others, Especially Caring
Adults, Youth have relationships with and increasing trust for
caring, capable adults. | ||||
|
Program Goal: Disseminate information and maintain the credibility of RHY programs and services among youth to increase the level of trust which youth feel for service providers. (7.4c and 7.4d are "pre-intervention" in nature but related to successful outreach activities.) | ||||
|
7.4c: Increase the proportion of youth who contact the National Runaway Switchboard (for counseling and referral to safe shelter or other services) earlier rather than later in their runaway episode (up to the first week). (Developmental; FY 99 is tentative baseline.) NOTE: This measure will suggest the success of improved outreach activities, information dissemination and other services and actions which increase youths' trust and confidence in the Switchboard and youth shelters. |
FY 02: tbd |
FY 02: |
Px M-129 | |
|
Program Goal: Prevent or mitigate severe youth crises by providing and publicizing opportunities to seek help and receive appropriate intervention and counseling (such as the National Runaway Switchboard) before situations deteriorate and/or the youth leaves home. | ||||
|
7.4d: Increase the proportion of youth who call the National Runaway Switchboard when they are contemplating running away (but before they do so). (Developmental; FY 99 is tentative baseline) NOTE: The denominator would include those who call for help after having left home and/or who have become enmeshed in crisis situations. |
FY 02: tbd |
FY 02: |
Px M-129 | |
|
3. A Sense of Industry and Competency; | ||||
|
Program Goal: Increase the involvement of youth as peers in service delivery and program development. | ||||
|
7.4e: Increase the proportion of BCP and TLP youth receiving peer counseling through program services. (revised FY 97 baseline equals 12%) *NOTE: The target and baseline for this measure in the FY 1999 APP were not based on RHYMIS but on a different data source (an evaluation using statistical sampling methodology and not comparable with RHYMIS). For this reason, and because data will only be collected through RHYMIS, we are switching to targets based on more recent RHYMIS data. While this data also has accuracy problems, there will be a more consistent relationship between baseline and targets. |
FY 02: 15% |
FY 02: FY 97: 12% |
Px M-130 | |
|
7.4f: Increase the number of youth serving on RHY grantee organization boards and participating in program and activity design, in the following categories: (1) volunteer youth (from the community) and (2) TLP youth. (Developmental; FY 01 is tentative baseline) |
FY 02 (1): tbd FY 02 (2): tbd FY 01 (1): NA FY 01 (2): NA |
FY 02 (1): FY 02 (2): FY 01 (1): FY 01 (2) |
Px M-130 | |
|
Program Goal: Strengthen youth in reaching their full potential socially and economically by providing opportunities that move them toward self-sufficiency. | ||||
|
7.4g: Increase the number of youth in the transitional living programs who have attained suitable education and housing status by the time they exit the program. (Developmental, FY 01 is tentative baseline) |
FY 02: tbd FY 01: NA |
FY 02: FY 01:6/01 |
Px M-131 | |
|
7.4h: Increase the number of youth in the transitional living programs who successfully complete the program. (Developmental; FY 01 is tentative baseline) NOTE: Successful completion does not strictly depend on lasting a full eighteen months but will be defined by status at exit and other elements in the TLP section of RHYMIS-LITE. |
FY 02: tbd FY 01: NA |
FY 02: FY 01: 6/01 |
Px M-131 | |
|
Program Goal: Build partnerships across governments, with communities, and with youth to help youth develop as individuals and as citizens. | ||||||
|
7.4i: Maintain with 13 States and youth services grantees in those States a collaboration that supports a youth development approach to services for young people, including substance abuse and teen pregnancy prevention activities and add additional States as resources becomes available. NOTE: FY 01 and 02 targets are adjusted to reflect the inclusion of additional States. |
FY 02: 13 |
FY 02: |
Px M-131 | |||
|
7.4j. Increase (revised FY 97 baseline equals 77%) the proportion of ACF-supported youth programs that are using community networking and outreach activities to strengthen services. NOTE on 7.4j: An evaluation, confirmed by anecdotal evidence, indicates that there has been a significant decline in community resources available for referrals and services for RHY youth. This measure has been deleted in the final revised FY 2001 plan due to difficulties in defining elements. |
FY 01: deleted |
FY 00: 6/01 |
| |||
|
4. A Belief in Their Control over Their Fate in Life; Youth achieve good mental and physical health and a greater sense of optimism, empowerment and possibility. | ||||||
|
Future possible goal development activity: The following possibilities will depend on RHYMIS redesign, available resources, and the need to maintain a manageable set of performance goals. Some of the following may replace existing goals if the result is an improved performance plan.
| ||||||
|
Availability of FY 2000 Data: More complete results will be available by June 2001. The current data are not accurate on a national level and our limited contract resources are responsible for designing the new system. | ||||||
|
Total Funding (dollars in millions) See detailed Budget Linkage Table in Appendix 6 for line items included in funding totals. |
FY 02: $117.1 |
Bx: budget just. section H | ||||
Performance Measures for FY 2002 and Final Measures for FY 2001
Challenges: The development of goals and outcome measures for FYSB grantees is challenging for a variety of reasons. First, there is extensive variation in the types of agencies that receive funding from FYSB. These approximately 400 agencies range from large, multi-service youth and family agencies with fairly sophisticated data collection and reporting systems to smaller single-service agencies that are just beginning to develop and use management information technology to track their services and service recipients. The annual financial support from FYSB to Basic Centers varies from about $50,000 to about $160,000, with the average being around $100,000. The smaller number of Transitional Living Programs average $180,000, and range from $150,000 to $200,000. The small number of Street Outreach Programs receive approximately $80,000 each.
As of FY 2000, data from RHYMIS are submitted semi-annually by grantees but are valid only on an annualized basis. (Data vary widely from quarter to quarter due to reporting factors). Hence, little can be said with confidence about FY 2000 performance until well after the year's end.
FYSB program and reporting standards are applicable only to the subset of youth in the runaway and homeless category supported by the RHY funding. The variable level of compliance with RHYMIS reporting requirements and the ability to collect reliable performance data, both of which are discussed later in this report, are affected by these program and service delivery realities.
In looking at trends, it may be methodologically questionable to compare one year to the next in a universe of grantees that changes from year to year as some grantees drop out or are not refunded and new ones take their place in the discretionary grants competitive process. RHY grantees operate one or more of three very different FYSB programs (as well as other non-FYSB programs) and serve a constantly changing and volatile client population. For this reason, while baselines are provided for the measures, these are being reevaluated. FYSB may change from using a baseline approach to a year-to-year continuous improvement approach, but this too has limitations. The level of report completion has been far less than it should be, leading to accuracy issues. (See "Data Verification and Validation" above.) These challenges will be addressed over the next few years as the data collection process is redesigned and as program reporting changes are implemented under the new legislation.
FYSB-funded programs vary in ways that have implications for identifying and assessing outcomes. Basic Center grantees, for example, generally operate programs that serve youth for short periods of time ranging from 1 to 15 days. Determining which outcomes are relevant for these types of programs is difficult because it requires focusing on short-term, incremental and sometimes intangible shifts in youths' attitudes, family environments and conditions. In contrast, the much smaller number of Transitional Living Program grantees work with youth for up to 18 months and offer a larger range of services, allowing clearer assessments of long-term change. Street Outreach Programs are designed primarily to build youths' trust in the agency and to encourage them to seek help and obtain safer and more stable living situations. These programs sometimes reach youth in a turbulent, street-corner setting for only a few moments each week; thus, establishing appropriate outcomes for Street Outreach programs is particularly challenging. (However, intermediate results, such as distribution of hygiene, food, or information packages, while having only short-term effects in the life of a street youth, nevertheless are of intrinsic value [e.g., nutrition and a few hours of relief from hunger] and can also establish a connection of trust. Once implemented, RHYMIS-LITE will track such results.)
Another reason for the difficulty in establishing outcomes and performance measures for FYSB-funded grantees is that their limited resources are almost fully dedicated to program operations. Many youth grantees do not maintain large and sophisticated information technology resources and staff, concentrating instead on services to at-risk youth. Moreover, as mentioned, grantees are often beholden to multiple funding sources with varying requirements.
Despite these challenges, FYSB is proposing the revised FY 2001 and FY 2002 performance goals and measures. These are derived from both the legislative mandate and the youth development framework. The specific rationale for the measures in this plan is based on evaluation and research findings related to adolescents, knowledge about what is important in the lives of youth, and knowledge regarding substantive areas needing further development.
Proposed New or Revised Performance Goals for FY 2001 and 2002: During the past three years, FYSB conducted an effort to develop a final set of outcomes and measures to describe and improve the performance of grantees who operate the Runaway and Homeless Youth programs (BC, TLP, SOP). The identification of performance indicators and performance measures within a youth development logic model was based on input from a wide variety of organizations and individuals involved in youth issues. The new outcome and performance measurement logic model, effective as of the revised FY 2001 Annual Performance Plan, derives from this effort and will be based in part on data from the revised, streamlined RHYMIS-LITE, which is expected to generate greater reporting compliance and accuracy.
New data sources are being added. The National Runaway Switchboard and grantee annual reports will be simplified and integrated. Some of the new measures (measures 7.4b-d) are "pre-intervention" in nature and, while beyond or tangential to control by FYSB and its partners, nevertheless tell an important story.
Because of resource constraints, the time required for completion of RHYMIS-LITE improvements, and the complexity of the activities involved, it may be several years before a final set of measures and targets is fully in place with reliable data to continually assess the effectiveness of FYSB grantees and the improvements in safety and well-being of the youth these grantees serve. ACF anticipates having an adequate RHYMIS-LITE system installed in time for a full year of quality data beginning in FY 2002. Thus we are setting new baselines for measures ("developmental" for FY 2002) and will apply these to established measures if the data collection experience beginning in FY 2002 is more reliable than before. There will be an unavoidable discontinuity in mid-FY 2001 as grantees transition to the new system, with new questions and definitions, new features and program coverage, and deletions and consolidations of content. The discussion earlier in this chapter makes the case that the benefits of better data in the future are well worth the discontinuity with poor data in the past.
The following presentation embodies the new structure. New or developmental measures may lack specific targets at this time. These will be set after review of new data and in consultation with partners. Unchanged measures are shown as is.
_______________________________________
Safe and Stable Living Situations
1. YOUTH DEVELOPMENT OUTCOME: Runaway and homeless youth find safety, shelter and services that support their well-being and development into adults.
Program Goal 1A: Provide appropriate shelter, counseling and other support services to youth and their families in high-risk situations.
7.4a. FY 2001: Increase to 96% the proportion of youth living in safe and appropriate settings after exiting ACF-funded services. (FY 97 baseline equals 82%)
FY 2002: Maintain at 96% the proportion of youth living in safe and appropriate settings after exiting ACF-funded services. (FY 97 baseline equals 82%)
Data source: RHYMIS-LITE
NOTE: Safe and appropriate living situation at exit would be all discharge outcomes except: on the run, on the street, in squat, correctional institute or detention center, other temporary shelter, other, or do not know.
FYSB will continue to work (through the highly competitive grantee selection process, on-site monitoring reviews, training and technical assistance, information dissemination, partnerships across a range of programs, and through other means) to help RHY grantees deliver comprehensive and high quality services to youth during shelter and TLP tenure. Such services not only focus on short term vital needs such as food and shelter, but must include counseling (both individual and family), and other services which are aimed at helping youth make appropriate living choices and healthy transitions to independence and adulthood. It is of the highest importance that youth served in RHY programs are placed in appropriate living situations upon the end of their RHY stay. Follow-up services and referrals by the community-based grantee, where feasible, are an important part of this commitment.
7.4b. FY 2002: Increase to X% the proportion of runaway and homeless youth who are able to rely upon safer and more appropriate means of survival while on the street, based on information from reports by youth calling the National Runaway Switchboard for help. (developmental)
Data Source: National Runaway Switchboard
Note: "Safer means of survival" include living with friends and relatives, using soup kitchens or shelters, or personal funds and exclude stealing, prostitution, selling drugs, panhandling, police detention, or "unknown." Police detention of runaways, as a survival "alternative," is still in place in some States, but is not part of a desirable youth development outcome. This is because detention criminalizes as "status offenders" youth who may be fleeing abusive situations, is coercive, demeaning, and demoralizing and may expose young people to incarcerated adults.
Measure 7.4b is being presented as a pre-intervention "social indicator" which, while beyond the control of ACF, the National Switchboard, and RHY programs, could nevertheless provide valuable information about living conditions of the runaway and homeless youth population before they find safe shelters. This developmental measure for FY 2002 will try to capture improved street level services and other resources for homeless youth across society, prior to their accessing the RHY network. The data are based on completed or partly completed interviews with crisis callers. Not every crisis call can generate detailed information, but in many crisis calls (over 30% for this particular measure), it is appropriate and feasible for the counselor to elicit reliable information. FY 1999 is tentatively the baseline year.
The data source is from outside the network of shelter grantees and captures general information about the lives led by these youth while they are unsheltered, unsettled and at high risk. FYSB and its grantees can indirectly affect these situations through partnerships with non-RHY programs that serve the homeless and youth in particular and through emphasizing coordination of services across a community network. If FYSB and its partners are successful over the long term, there may be fewer youth running away and of those, more able to find appropriate interim refuge.
_______________________________________
A Feeling of Connectedness to Others, Especially Caring Adults, and to the Community
2. YOUTH DEVELOPMENT OUTCOME: Youth have relationships with and increasing trust for caring, capable adults.
Program Goal 2A. Disseminate information and maintain the credibility of RHY programs and services among youth to increase the level of trust youth feel for service providers.
7.4c. FY 2002: Increase to X% the proportion of youth who contact the National Runaway Switchboard (for counseling and referral to safe shelter or other services) earlier rather than later in their runaway episode (up to the first week (developmental)
Data Source: National Runaway Switchboard
This developmental measure for FY 2002, though also pre-intervention and somewhat beyond the control of FYSB and its partners, will indicate the reputation and credibility of the National Switchboard and the success of its outreach and information dissemination efforts in informing youth and increasing their trust and confidence in the Switchboard and youth shelters. In FY 1999, 40.4% of callers had been on the street for 1-2 days before contacting the Switchboard, 22.6% for 4-7 days, 14.7% 1-4 weeks, 11.5% for 1-2 months, and 10.5% for over 2 months. Other measures that may indicate healthy and caring relationships between youth and adults staffing RHY centers are also under consideration. The goal would be to increase the percentages of youth that call during the earlier time periods (during the first few days, up to the first week). FY 1999 is tentatively the baseline year.
In FY 2000 FYSB awarded additional funds to the NRS for enhancing their presence on the web, their use of all media, besides the traditional (e.g., flyers mailed to middle and high school counselors) and their overall communications and outreach activities. More awareness among youth of the NRS services, including their preventive potential, could mean more youth learning of the Switchboard and thus reaching out for assistance and counseling (even if only over the phone). Youth in runaway status who contact the NRS are helped to find RHY centers or other appropriate shelters. FYSB's contract with the National Clearinghouse on Families and Youth also pays for the development of handouts, flyers, and other youth-tailored publications (such as "Express Yourself," also published in Spanish, which, among other things, encourages youth to reach out, to communicate, and to establish healthy relationships with caring adults.)
Program Goal 2B. Prevent or mitigate severe youth crises by providing and publicizing opportunities to seek help and receive appropriate intervention and counseling (such as the National Runaway Switchboard) before situations deteriorate and/or the youth leaves home.
7.4d. FY 2002: Increase to X% the proportion of youth who call the National Runaway Switchboard when they are contemplating running away (but before they do so). (developmental; FY 99 is tentative baseline)
Data Source: National Runaway Switchboard
This developmental measure for FY 2002, also pre-intervention in nature, will suggest the reputation and credibility of the National Switchboard and the effectiveness of its outreach and information dissemination efforts. In FY 1999, 9% of youth were contemplating running away when they called, while 61.2% were already runaways, 3.2% were throwaways, 1.2% were homeless, and 25.2% were "in crisis." The target will be expressed as a ratio, with the numerator being "contemplating running away" and the denominator being the total number of youth who call. The goal would be to increase the numerator. FY 1999 is tentatively the baseline year. The same activities and resources described under measure 7.4.c could mean more youth getting counseling, caring attention, referrals, and other interventions before they run away out of desperation.
_______________________________________
A Sense of Industry and Competency;
A Feeling of Connectedness to Others, Especially Caring Adults, and to the Community;
A Belief in Their Control over Their Fate in Life;
3. YOUTH DEVELOPMENT OUTCOME: Youth are empowered to develop into independent, contributing members of society.
Program Goal 3A. Increase the involvement of youth as peers in service delivery and program development
7.4e. FY 2001: Maintain at 15% the proportion of BCP and TLP youth receiving peer counseling through program services. (FY 97 baseline equals 12%)
FY 2002: Maintain at 15% the proportion of BCP and TLP youth receiving peer counseling through program services. (FY 97 baseline equals 12%)
Data source: RHYMIS-LITE
The only change in this measure is the reference to specific RHY programs. In the future, we will explore the use of annual report and RHYMIS-LITE information to determine to what extent RHY youth in the long term TLP program become, as part of their developmental process, peer counselors and mentors to youth who are just entering TLP or to non-TLP youth served in the BCP.
FYSB strongly promotes "positive youth development" approaches to working with adolescents such as service learning, include encouraging youth involvement, leadership, community service, and other experiences which engage youth in healthy life. Training and involvement of youth from the community as volunteers or of RHY youth "on the mend" in communicating with troubled adolescents benefits both peers. This measure is a maintenance, not an increase target, since peer counseling is not appropriate in all cases.
7.4f. FY 2002: Increase by X% the number of youth serving on RHY grantee organization boards and participating in program and activity design, in the following categories: (1) volunteer youth (from the community) and (2) TLP youth. (developmental)
Data Source: RHY Grantee annual reports (as revised)
This developmental measure for FY 2002 will indicate the commitment of RHY grantees and their affiliates to building authentic youth participation and involvement in responsible roles that benefit the community. If RHYMIS-LITE shows sufficient accuracy improvement, a similar measure may be piloted to capture volunteer and community service activity by RHY youth (particularly in the TLP). If changes in grantee reporting can be made on a timely basis and good data are available, FY 2001 will be the baseline year. For further explanation, see measure 7.4.e, above.
Program Goal 3B. Strengthen youth in reaching their full potential socially and economically by providing opportunities that move them toward self-sufficiency.
7.4g. FY 2002: Increase by X% the number of youth in the transitional living programs who have attained suitable education and housing status by the time they exit the program. (developmental)
Data source: RHYMIS-LITE
FYSB is mandated to invest up to 10% of its program funding in support services, such as data collection, communications, research, state projects, monitoring, and training and technical assistance. All of these efforts are focused on improving service delivery and outcomes to at-risk youth in RHY programs. There is more outcome information from the long term TLP program, than from the BCP or SOP, and this program has more of a chance to change a youth's life direction over the eighteen months they can participate. Education and housing is provided during the term but optimal placement upon exit is an important objective, and follow-up services are offered where resources permit.
7.4h. FY 2002: Increase by X% the number of youth in the transitional living programs who successfully complete the program. (developmental)
Data Source: RHYMIS-LITE
Successful completion does not strictly depend on lasting a full eighteen months but will be defined by status at exit and other elements in the TLP section of RHYMIS-LITE.
Developmental measures 7.4g-h (above) indicate the success of the TLP grantees in fulfilling their primary mission. If RHYMIS-LITE improvements can be made timely and reliable data are available, FY 2001 will be the baseline year.
Program Goal 3C: Build partnerships across governments, with communities, and with youth to help youth develop as individuals and as citizens.
7.4i. FY 2001: Maintain with 13 States and youth services grantees in those States a collaboration that supports a youth development approach to services for young people, including substance abuse and teen pregnancy prevention activities and add additional states as resources become available.
FY 2002: Maintain with 13 States and youth services grantees in those States a collaboration that supports a youth development approach to services for young people, including substance abuse and teen pregnancy prevention activities.
Date Source: FYSB administrative records
In numerous programs, such as TANF and WIA, States are carrying an increasing burden and responsibility and authority. These demonstration grants provide for participating States to address youth issues and integration of youth services with other programs on a state-wide basis, bring them into contact with the community-level RHY network, and further the promotion of positive youth development approaches. In administrative terms, FYSB requires periodic reporting from these States, a final evaluation, and attendance at a national meeting in Washington. The objectives of each grant were proposed by the States and awards were made and overseen by FYSB in ways that encourage innovation. FYSB has recently established contractual consulting services with a nationally respected scholar and writer in the youth field. The principal focus of this consultant will be on achieving high quality results and lessons from these projects.
_______________________________________
A Belief in Their Control over Their Fate in Life;
A Stable Identity
4. YOUTH DEVELOPMENT OUTCOME: Youth achieve good mental and physical health and a greater sense of optimism, empowerment and possibility.
Future possible goal development activity: (The following possibilities will depend on RHYMIS-LITE redesign, available resources, and the need to maintain a manageable set of performance goals. Some of the following may replace existing goals if the results lead to improved performance.)
Performance Measurement, Evaluation, and Research Challenges: Despite the RHYMIS-LITE improvement efforts, the environmental and programmatic issues, discussed above under Performance Goals, make performance conclusions for RHY programs, particularly BCP and SOP, difficult to rely upon. Conclusive measurement of long term outcomes for the transient, self-concealing, and fearful street-life SOP population may also be elusive. For both shelter and outreach services, even measuring the level of need has so far been practically impossible, even by the U.S. Census Bureau, national research organizations or advocates for the homeless. Ultimately, the measure may be limited to the overall numbers of those runaway and homeless youth actually experiencing safety and security offered by the limited BCP network, even though services are temporary. This safety and security, even for a few weeks, is a priceless end in itself and can save lives.
The more intensive, long-term services of the TLP are more readily assessed, but the ability to follow up after exit is limited. When resources permit, FYSB would like to initiate a more intensive evaluation of the TLP, exploring the possibility of coordination with evaluations by the Children's Bureau of the Independent Living Program. Earlier evaluation efforts have been too limited to be reliable. ACF youth development research can also link with and build upon existing efforts such as the National Academy of Science's study of Community Level Youth programs and broaden our knowledge of effective practices at both the State and local levels.
In the recent reauthorization legislation, Congress directed FYSB to study the national prevalence and sources (i.e., perpetrators) of sexual abuse against runaway and homeless youth and report back in one year. The study will rely upon links to, and statistical analysis of ongoing studies.
|
STRATEGIC GOAL 3: INCREASE THE HEALTH AND PROSPERITY OF COMMUNITIES AND TRIBES |
Rationale
Strong neighborhoods and communities are essential in creating healthy environments for children and families. Research reveals a significant relationship between the quality of community life and the well-being of residents. Living in distressed neighborhoods is associated with negative impacts on early childhood development, educational attainment, and health, as well as higher rates of violence, infant mortality, substance abuse, and out-of-wedlock teen parenthood. ACF programs contribute to the goal of increasing the health and prosperity of communities and Tribes by strengthening local community partnerships, improving civic participation, increasing community development investments, and working with Tribes and Native American communities to build capacity and infrastructure for social and economic development and self-sufficiency.
ACF supports activities that create jobs in economically disadvantaged communities, that help communities develop comprehensive service networks to provide community supports for local residents, and that empower residents to leverage local assets and address their needs. ACF assists communities to develop economically and enable low-income individuals to get work through a number of initiatives. For example, the Empowerment Zone/Enterprise Community (EZ/EC) initiative, in cooperation with the Department of Housing and Urban Development, provides substantial funding and technical assistance for community development corporations and other organizations to create new business and employment opportunities.
These programs help low-income families, including many leaving TANF cash assistance, succeed and advance at work. In isolated urban low-income communities, immigrant neighborhoods and rural areas separated from labor markets, organizations which have a stake in those communities serve as an indispensable link between low-income parents struggling to become self-sufficient and find jobs and employers and public agencies offering needed services and support. These community-based organizations have identified innovative and promising roles for community-level agencies to create employment opportunities and assist low-income families to succeed at work. Building on years of experience within the communities, activities are focused on partnering with State TANF, Medicaid, labor, and human services agencies to connect low-income working families with a full range of supports and career development possibilities.
A request for $89 million will establish a Compassion Capital Fund to support the creation of public/private partnerships that would provide start-up capital and operating funds to qualified charitable organizations that wish to expand or emulate model social services programs. The Compassion Capital Fund will also support and promote research on "best practices" among charitable organizations. Funds will be used to assess and document successful models that could be emulated or expanded by entities that are recipients of the Compassion Capital Fund.
Many DHHS programs vital to this goal are implemented by State, local, and non-governmental agencies. Several other Federal Departments and agencies manage projects for strengthening community-based efforts and creating economic opportunity for residents of distressed communities. In addition, the Nation's overall economic climate, and that of particular geographic regions, is a major factor in the Department's ability to achieve this strategic objective.
The Community Services Block Grant, the Social Services Block Grant, the Low-Income Home Energy Assistance Program (LIHEAP), and the programs of the Administration for Native Americans (ANA) are administered directly by States and Tribal governments. Numerous agencies throughout DHHS have responsibilities for achieving parts of this strategic objective. ACF, Administration on Aging, Centers for Disease Control and Prevention, Health Resources and Services Administration, Substance Abuse and Mental Health Services Administration, and individual offices within the Office of the Secretary, including the Office of the Assistant Secretary for Planning and Evaluation, contribute to the effort.
ACF assists community organizations to gain access to DHHS programs supporting comprehensive, coordinated community services. Community service programs, such as the Family Violence Prevention Program, the Community Services Block Grant program, Healthy Start, Mental Health Services for Children and the Aging Network, are encouraged to build coordinated service networks. ACF promotes the involvement of community residents as active partners in developing and implementing local programs and services through community service programs, such as the Community Services Block Grant Program, HIV prevention programs in the Centers for Disease Control and Prevention, and the Administration for Native Americans.
In addition, numerous other Federal agencies, such as the Departments of Housing and Urban Development, Agriculture, Justice, Education, Commerce, and Labor, the Environmental Protection Agency, and the Small Business Administration, are involved in related work. DHHS coordinates and collaborates with these entities.
The objectives and major program areas for this goal are:
8. Build healthy, safe and supportive communities and Tribes
COMMUNITY SERVICES BLOCK GRANT
Program Description, Content, Legislative Intent, and Program Goals
The purpose of the Community Services Block Grant (CSBG) program is to provide a range of services and activities having a measurable and potentially major impact on causes of poverty in the community. The CSBG Act requires States to pass through 90% of the Federal funds allocated to eligible entities, which in most cases are Community Action Agencies (CAAs). These programs support community-based organizations in meeting the challenge of helping people succeed at work.
Results-Oriented Management and Accountability (ROMA): Prior to passage of GPRA, ACF was already in the process of developing a monitoring and technical assistance strategy which focused on increasing the capacity of local agencies to increase program performance toward achieving results. ACF established a task force composed of CSBG State directors, CAA directors and relevant association members, including representatives from Head Start, to oversee this responsibility. The purpose of this task force was to develop and implement a strategy for strengthening the capacity of CSBG agencies and local CAAs to focus on improved program performance and better results for low-income people. The major strategy of ROMA is to allow community-based agencies to develop their own objectives and activities based on periodic assessments of community needs and resources. It is a way to continuously revitalize, energize and measure results obtained by the partnerships on the local, State and Federal levels.
ROMA evolved from a need to develop a goal oriented framework with State partners, which binds and holds accountable a local network of community action agencies in a standardized way yet allows them the flexibility to develop their own processes and outcomes in keeping with local preferences and State objectives. This is a major cultural shift for all levels because it redefines the roles of each. The emphasis since 1996 has been on developing the capacity to contain a results-oriented structure on all levels rather than just a data management system. ROMA data for FY 1997 were reported for the first time last year as States moved from a service categorization to an outcome orientation.
ROMA is a management practice that incorporates the use of outcomes or results into the administration, management, and operation of human services. It provides a framework of national goals at the family, community and agency levels for a flexible transition to an outcome orientation and an opportunity to create and use a variety of indicators for local community action agencies. ROMA encompasses: (1) a menu of outcome-oriented measures which leave maximum flexibility at the local level; (2) implementation tools for measuring incremental successes and assessing agency capacity such as scales and self-assessment matrices; (3) electronically-provided economic and demographic data mapping at the neighborhood level for conducting community needs assessment and planning; (4) training and technical assistance plans to ensure timely phasing of the total approach; and (5) reporting compatible with local, State and Federal need for information.
Program Activities, Strategies and Resources
From the beginning, ACF has viewed GPRA as an opportunity to improve program performance toward better outcomes at State and local levels. In FY 1996 and FY 1997, percentages of the CSBG funds designated for training, technical assistance, planning, evaluation and data collection were awarded to States and localities in support of GPRA. These funds and others from State and local levels support training at national, State and regional association conferences; development and use of special implementation tools such as manuals; scales for incremental measurement at the individual, family and community levels; surveys and survey methodology; electronically-provided economic and demographic mapping data at the neighborhood level; revision of reporting tools; and specific on-site consultative technical assistance efforts.
Program Coordination, Partnerships and Crosscutting Issues
ROMA involves extensive work with partners. As an example, a major impediment to ROMA implementation is the difficulty agencies have in coordinating programs and client efforts across programs when these programs have separate incompatible databases. For community action agencies, some of which may operate as many as 50 programs with their own specific requirements, trying to work with clients toward outcomes in separate programs and track client success over time involves technology challenges. To address this issue, the national Monitoring and Assessment Task Force (MATF) created the Managing Multiple Data Base Project in response to this concern expressed by local agencies, States and other partners, The first report was presented to the MATF in July 2000.
Program-wide Performance
The Community Services Block Grant Program continues to support an array of services and activities to assist low-income individuals, including persons transitioning from welfare, the elderly, the homeless and migrants, to achieve individual and family self-sufficiency. The CSBG Program is carried out through the States and Community Action Agencies based on community needs assessments. CSBG awards were made to the 50 States, Puerto Rico, and the District of Columbia, U.S. Territories, and 61 Indian Tribes and tribal organizations.
The national Monitoring and Assessment Task Force and OCS continue to provide technical assistance and support to States to implement ROMA. Work is underway on several fronts: (1) to develop and implement a community scale project to measure civic and social capital development; (2) to continue to provide technical assistance for the statewide implementation of ROMA in the form of statewide partnership grants; (3) to strengthen the capacity of State CAA Associations through 5-year grants awarded (now in their second year) to all CAA State Associations; (4) to assist eligible entities through special State technical assistance grants to address complex problems which prevent such entities from meeting performance goals and implementing ROMA; and (5) to insure that all States began some phase of implementation of ROMA. The ROMA Guide training tool, mailed to all States and community action agencies, is now available on the website for use by other community-based agencies. A project group has been formed to document the database management issues commonly faced by local community action agencies that typically operate at least five databases to handle the multiple system demands of funding requirements.
Program-wide performance indicates that sixty percent of the States and half of the 1000 CAAs are actively engaged in implementing ROMA. These States have demonstrated progress in (1) working on program improvement initiatives; (2) using a mix of the six national goals to report CAA outcomes; (3) revitalizing data collection and reporting; (4) embracing ROMA training of State staff, CAA staff and board members; and (5) developing approaches to collecting and reporting experiences in using performance measures.
There is considerable variation in the kinds of measures used by States for activities supporting the six national goals. The six goals are:
The National MATF Task Force continues to develop guidance to assist States to implement ROMA and to overcome the challenges faced in measuring, aggregating and defining data from CAAs in order to address the ROMA national goals. As part of a comprehensive training, technical assistance and capacity strategy the Office of Community Services has supported (1) the development of a ROMA Guide; (2) a ROMA website; (3) peer-to-peer TA and State ROMA implementation grants; and (4) training at National and State conferences of the Community Services network.
Trend data for previous years: FY 1996-1998 show improvement in one of the performance measures, the amount of non-Federal resources brought into low-income communities by the Community Services Network. There was a slight decrease in the number of volunteer hours contributed by CSBG consumers. Both of these measures are directly related to the fund-raising efforts of the Network. The local Network's involvement in implementing TANF required CAAs to provide an increased role in assisting low-income individuals to transition from welfare to work. They also expanded their provision of on-going supportive services to assist in both retention and advancement in employment for individuals who had obtained work. Our analysis indicates that the provision of these increased services and activities for the working poor within each State accounts for the increase in additional funds leveraged. The slight decrease in the number of volunteer hours contributed may be the result of more individuals working with less time to volunteer.
State Reports on FY 1999 CSBG data were submitted in March 2000; data are still undergoing analysis and validation and, therefore, is not ready for release. Reports on CSBG performance data for FY 1999 are expected to be available July 2001 and a report on the FY 2000 data will be available July 2002. For FY 1999 and FY 2000, ROMA implementation has been voluntary; however, in accordance with the CSBG Statute, ROMA became mandatory effective 2001. It is anticipated that future data will be more current as a result of this legislative requirement.
Data Issues
The data reported here have been gathered by the CSBG Information System (CSBG/IS) survey, a voluntary reporting effort by the States administered by the National Association for State Community Services Programs (NASCSP) and supported by the Office of Community Services, ACF. There are lags in collecting data in a block grant program. However, the CSBG/IS under ROMA is revising its survey to request fewer data elements in order to speed up the timeliness of the reporting process.
Until now, CSBG data collection has been a part of the T&TA strategy, i.e., information gathered from a survey which is needed by States to revise their overall training and technical assistance strategies. OCS has found ways to encourage more States to cooperatively buy into a low cost method of collecting data. States that receive only 5% of the CSBG funds for staff and administration cannot afford to purchase information system technology. Therefore, many of the State reports are simply local level reports bound together. Reporting on outcome measures has placed the States in the position of needing to report by goal, not service and requires more sophisticated higher cost technology. Because of GPRA, OCS needs to begin collecting its own data and not be dependent on data gathered by an association for a different purpose.
Summary Table
|
Performance Measures |
Targets |
Actual |
Reference | |
|
Program Goal: Ensure that low-income people have a stake in their community. 8.1a. Increase by 1% over the previous year the number of volunteer hours contributed by CSBG consumers in one or more community groups. (expressed in million of hours) |
|
|
| |
|
Program Goal: Conditions in which low-income people live are improved. 8.1b. Increase by 1% over the previous year the amount of non-Federal resources brought into low-income communities by the Community Services Network (non-Federal funds mobilized expressed in billions). |
|
|
| |
|
*Measure 8.1a target was decreased and 8.1b was increased based on FY 1999 actual performance. **43 States reporting for FY 1998; 42 for FY 1997. ***49 States reporting for FY 1998; 47 for FY 1997. Availability of FY 2000 Data: Results will not be available until July 2002 for FY 2000 Performance Report due to lags in collecting data in a block grant program. | ||||
|
Total Funding (dollars in millions) See detailed Budget Linkage Table in Appendix 6 for line items included in funding totals. |
FY 02: $630.5 |
Bx: budget just. section H | ||
Performance Measures for FY 2002 and Final Measures for FY 2001
These measures were chosen as initial measures by the national Monitoring and Assessment Task Force based on critical issues that the Community Services Network viewed as central to building human, social and economic capital. This capital is important to the survival of the community agencies' organizational capacity to deliver services in an environment of dwindling resources. Measures relating to non-Federal resources leveraged and volunteer hours contributed were chosen as central to the network's mission of operating strategies and programs to alleviate the causes and conditions of poverty.
PROGRAM GOAL: Ensure that low-income people have a stake in their community.
8.1a. FY 2001: Increase by 1% over the previous year the number of volunteer hours contributed by CSBG consumers in one or more community groups. (1997 baseline: 27 million hours)
FY 2002: Increase by 1% over the previous year the number of volunteer hours contributed by CSBG consumers in one or more community groups. (1997 baseline estimate: 27 million hours)
Volunteers are necessary for most network activities and although local agencies differ based on community needs, use of volunteers is universal. The volunteer measure is critical to building social capital necessary for accomplishing ROMA goals. This volunteer measure, focusing on building skills, capabilities and relationships that enable people to act in new ways, builds the human and social capital necessary for accomplishing two ROMA goals -Low Income People Own a Stake in their Community and Conditions in which Low-Income People Live are Improved. There has been a slight decrease in the number of hours (from 27 million to 26.86), therefore ACF is undertaking a number of initiatives to get a better understanding of that decrease, e.g. State-assessments of individual States' status and identification of technical assistance needs. Additionally, ACF is sponsoring five regional conferences and a series of workshops, leadership programs and training of trainers--efforts directed at improving progress for all of the ROMA goals and measures.
PROGRAM GOAL: Use federal funds as leverage to improve conditions where low-income people live.
8.1b. FY 2001: Increase by 1% over the previous year the amount of non-Federal resources brought into low-income communities by the Community Services Network (non-Federal funds mobilized). (1997 baseline: $1.26 billion)
FY 2002: Increase by 1% over the previous year the amount of non-Federal resources brought into low-income communities by the Community Services Network (non-Federal funds mobilized). (1997 baseline: $1.26 billion)
A five year (1994-97) trend analysis of local networks' resources revealed that the decline in non-CSBG resources was due largely to the elimination or reduction of Federal funding in discretionary domestic programs for low-income individuals and communities. Many programs, historically administered by CAAs and other community-based organizations, were eliminated while others were drastically reduced. It was the steady growth in resources in all other sectors that kept the network from a precipitous loss of capacity to respond to the needs of the low-income community. The MATF selected the focus on non-Federal resources given the evidence that these resources are critical for survival and the network's tradition of leveraging CSBG dollars.
The Community Services Network initiated its own performance-based system almost six years ago in an effort to build strong foundations for continuous program improvement and accountability among State agencies, community action associations, and local community action agencies. ROMA utilizes a flexible, "bottoms-up" approach which allows wide variation in the kinds of measures reported. As part of the ongoing work with partners that is the basis of the ROMA approach, a more extensive set of goals and measures is under development and States should begin to report on a menu of measures crafted by local agencies in FY 2001. We anticipate continuous reduction and consolidation of measures by States in order for OCS to achieve aggregation of data by FY 2003. Inasmuch as ROMA is more than measurement and reporting, OCS has identified core activities as yardsticks to measure ROMA progress among States and local agencies and as focal points for State plan approval, compliance monitoring and program reporting. States and eligible entities are encouraged to use these core ROMA activities to assess their own ROMA progress and to identify what work needs to be done to complete their efforts by FY 2003. OCS will help States to conduct such assessments in FY 2001. Training and technical assistance support will be targeted to help States and local agencies conduct these activities that constitute basic ROMA implementation.
As part of the ongoing work with partners that is the basis of the ROMA approach, a more extensive set of goals and measures is under discussion. Beginning in 1998, more than half the States began using and reporting on a broad range of family, community and agency goals. Scales have been developed as a tool to measure incremental progress in family and community outcomes and agency processes toward achieving these goals. By so doing, States can measure intermediate outcomes and a common language can be used and understood by all partners--Federal, State and community. Not all States have reached the same level, but at least 25 States are reporting on "community" outcomes; 24 on "agency capacity" outcomes and 27 on "family" outcomes.
Much experimentation is underway on community measures. Examples under development include: "increase the number of participants enrolled in educational and literacy programs who attend regularly;" and, "increase the amount of property tax generated as a result of rehabilitation projects." As the Network gains more experience and sophistication in determining the most appropriate measures toward obtaining community revitalization results, we anticipate that some of these measures will be considered for inclusion in future performance plans.
FAMILY VIOLENCE PREVENTION PROGRAM
Program Description, Content, Legislative Intent, and Broad Program Goals
The Family Violence Prevention and Services Program (FVPSP) is responsible for the administration and oversight of a number of activities pertaining to family violence. A primary focus of the program is to assist States and Indian Tribes in responding to and preventing family violence. To that end, the FVPSP allocates funds to support the provision of immediate shelter and related assistance for victims of family violence and their dependents. Funding is also allocated to carry out coordination, research, training, technical assistance, and clearinghouse activities.
The Family Violence Prevention and Services Act (FVPSA) was enacted as Title III of the Child Abuse Amendments of 1984, and reauthorized and amended for FY 1995 through FY 2000 by the Violent Crime Control and Law Empowerment Act of 1994 (the Crime Bill). The increase in FY 2001 funding for the Family Violence initiative provided an expansion of services, particularly to under-served populations, and increased support for the National Domestic Violence Hotline.
With each amendment of the legislation, the FVPSP responsibilities have grown. In addition to overseeing State and Tribal activities, the FVPSP is responsible for administering grant programs for State domestic violence coalitions carrying out similar technical assistance and prevention efforts. Moreover, the program establishes and provides ongoing support for the Domestic Violence Resource Network, which includes the National Resource Center on Domestic Violence, four special issue resource centers, and the National Domestic Violence Hotline.
"Family violence" is a broad term, encompassing all forms of violence within the context of family or intimate relationships, including domestic violence, child abuse and elder abuse. A primary focus of the FVPSP has been to support intervention and prevention targeting domestic violence, or violence and abuse between adult intimate partners. Most commonly, domestic violence involves the abuse of a female by a male partner or ex-partner. Domestic violence is an issue of increasing concern because of its far-reaching and negative effects on all family members, including children. The FVPSP has also been concerned about the intersection between domestic violence and child abuse within families and with abuse of women in later life, and has provided funding for several collaborative initiatives to increase our knowledge and improve our intervention and response efforts.
Domestic violence is not confined to any one socioeconomic, ethnic, religious, racial, or age group, and occurs in rural, urban and Tribal communities. It is the leading cause of injury to women in the United States, where they are more likely to be assaulted, injured, raped or killed by a male partner than by any other type of assailant. Statistics show that 29 percent of all violence against women by a single offender is committed by an intimate-a husband, ex-husband, boyfriend, or ex-boyfriend. Accurate information on the extent of domestic violence is difficult to obtain because of extensive under-reporting. However, it is estimated that in this country between one and four million women are abused to the point of injury by a male partner or ex-partner each year. About one-fourth of all hospital emergency room visits by women are the result of domestic assaults.
This violence takes a devastating toll on children who are exposed to its cruelty. Between three and four million children witness parental violence every year. Children whose mothers are victims of wife battery are twice as likely to be abused themselves as those children whose mothers are not victims of abuse. When children witness violence in the home, they have been found to suffer many of the symptoms experienced by children who are directly abused.
Program Activities, Strategies and Resources
State and Tribal Programs: The FVPSP State and Tribal grants program authorized by Section 303 of the FVPSA is the primary Federal mechanism for encouraging State, Tribal and local support for implementing, maintaining, and expanding programs and projects to prevent family violence. FVPSP funds continue to supplement many already established community-based family violence prevention and services activities. In particular, these funds have been instrumental in promoting and supporting the development of services in rural and other under-served areas.
During the past decade, there has been tremendous expansion in the number of grants to Indian Tribes. The impetus for growth came with a legislative amendment, which set forth the mandatory allocation of funding for Indian programs, rather than funding of such programs at the discretion of the Secretary of DHHS. The number of grantees has nearly tripled over the last decade from 64 Tribes when the legislation was first enacted.
The FVPS programs on Tribal trust lands and reservations are in the process of evolving towards a more stable and comprehensive set of activities. As the FVPSP supports the development of staff capacity among the Tribal grantees, ACF has been able to identify the need to enhance both service delivery and information compilation techniques. There are several activities underway in an attempt to improve Tribal reporting of family violence intervention and prevention activities. For example, ACF has the assistance of a newly-funded resource center that provides comprehensive technical assistance, support and training to Tribes, Native American communities, and advocates working with Indian women. This Center has begun working directly with Tribes receiving FVPSP grants both in the collection of data for reporting purposes and to assist them in administering their programs.
Through the FVPSP, State agencies, Indian Tribes, and Tribal organizations receive grants for the provision of emergency shelter services to domestic violence victims and their families. In addition, funds may be used for related services, such as alcohol and substance abuse prevention, counseling related to family violence, legal assistance through civil and criminal courts, childcare services for children who are victims of family violence, and other prevention-focused activities.
Discretionary Program and Activities: Each fiscal year, FVPSP discretionary funding supports public agencies and nonprofit organizations in establishing, maintaining, and expanding programs and projects to prevent incidents of family violence and provide immediate shelter and related assistance to victims and their families. Discretionary funding is typically limited to applicants who specify goals and objectives having national and local relevance. Moreover, the programs must demonstrate applicability to the coordination efforts of national, Tribal, State and community-based organizations.
During the past several years, priority funding areas have included: Public Information/ Community Awareness grants; stipends to Historically Black, Hispanic-serving, and Tribal Colleges and Universities; grants to support Domestic Violence/Child Protective Services Collaborations; grants to develop demonstration training models for improved access and legal representation; grants to develop services for immigrant, migrant, and refugee battered women; grants to develop strategies for effective response to domestic violence issues within the context of the Temporary Assistance to Needy Families (TANF) Program; and grants to improve health care response to domestic violence.
The FVPSP has also implemented several initiatives to facilitate and improve its outreach, information gathering, and service response to under-served communities. Such initiatives include the mobilization of researchers, academicians, and practitioners around issues of family violence that impact these particular communities. These efforts have resulted in the development of the Institute on Domestic Violence in the African American Community, the National Latino Alliance, the Women of Color Network, and the Asian American Institute on Domestic Violence.
Domestic Violence Resource Network: The Domestic Violence Resource Network (DVRNetwork) was established in 1993 as part of the 1992 amendments to the FVPSA. The FVPSP initially provided funding for the development and operation of a National Resource Center on Domestic Violence and three special issue resource centers - the Battered Women's Justice Project (focusing on civil and criminal justice issues), the Health Resource Center on Domestic Violence, and the Resource Center on Domestic Violence: Child Protection and Child Custody. In 1997, funding was made available to establish a fourth special issue resource center focusing on the technical assistance and training needs of Tribes and Native American communities.
Prior to the establishment of the DVRNetwork, there were no national organizations dedicated specifically to providing training, technical assistance and policy analysis to help domestic violence practitioners and other professionals improve their approaches to working with victims or perpetrators of domestic violence. Each resource center, operated by established organizations with demonstrated expertise in domestic violence policy and practice issues, partners with community-based domestic violence programs, State domestic violence coalitions, Federal, State, and local government agencies, Indian Tribal organizations, policy makers, researchers, and others to identify and respond to emerging information and technical assistance gaps.
While each resource center is charged with a specific domestic violence subject area, members of the DVRNetwork have always worked in partnership to ensure that domestic violence-related training and technical assistance throughout the country is complementary, comprehensive, appropriate, and informed by the entire network. These member resource centers work collaboratively to identify gaps in policy and services and to develop strategies for addressing these gaps. In addition to providing toll-free access to technical assistance pertaining to its subject area, other services include training, policy analysis and development, identification of model programs, development of policies and publications, and assistance to Federal and State agencies on a full range of policy and practice issues.
National Domestic Violence Hotline: In 1995, ACF sought applications to operate its National Domestic Violence Hotline (NDVH), under authorization of Section 316 of FVPSA. The NDVH became operational in 1996 as a project of the Texas Council on Family Violence and serves as a critical partner in the prevention and resource assistance efforts of the DVRNetwork.
The toll-free, 24-hour NDVH provides:
In an effort to assess the effectiveness of the Hotline, ACF funded two studies to evaluate the Hotline's progress and activities. The first, funded in 1996, a 6-month review of the Hotline yielded an impact assessment of the Hotline, an analysis of the Hotline's information systems, feedback from the Hotline workers, and plans for future Hotline research. The second included a 4-day site visit and follow-up interviews which identified the strengths of the Hotline and noted areas where change is needed to foster growth and development in key areas such as databases, research, and organizational growth.
Program-wide Performance
It should be noted that many Tribal grantees and Alaskan native villages funded through the FVPSP are constrained in their program development efforts and service delivery activities by the extreme distances between service facilities, isolation in rural areas, and the constant turnover in program staff. The performance goal for FY 2000 was to increase the participation of Indian Tribes, Tribal organizations, and Alaskan Native Villages by 45 percent from 120 in FY 1996 to 174. During FY 2000, ACF exceeded the program goal by funding 187 Indian Tribes, Tribal organizations, or Alaskan Native Villages to establish family violence prevention and service programs. Through the 187 Tribes and Alaskan villages funded by FVPSP in FY 2000, there is a network of safehouses, Tribal-run shelters and related assistance services for family violence victims and their dependents (measure 8.2a).
The Hotline is committed to meeting the needs of diverse communities and provides bilingual Spanish-English staff, text telephones for callers who are hearing impaired, access to translators in 139 languages, and materials in a variety of languages and formats. The Hotline first began responding to calls in late February 1996 and currently receives an average of 11,000 calls per month from throughout the U.S. and its territories (measure 8.2b). The majority of these calls are from domestic violence victims themselves. Since the opening of the Hotline on February 21, 1996 to September 30, 2000, the Hotline has answered 524,758 calls.
Program Coordination, Partnerships and Crosscutting Issues
ACF recognizes that coordination and collaboration at the local level among the police, prosecutors, the courts, victim services providers, child welfare and family preservation services, TANF agencies, and medical and mental health providers are necessary to create a more responsive network of protections and supports for families dealing with domestic violence. To help develop a more comprehensive and integrated service delivery approach, ACF is assisting State agencies and Indian Tribes receiving funds under FVPSP to coordinate planning activities with new and existing State, local, and private sector agencies.
State Domestic Violence Coalitions: In FY 1993, the FVPSP began administering grants to statewide private nonprofit domestic violence coalitions to conduct activities that promote domestic violence intervention and prevention and increase public awareness of domestic violence issues. Some areas of focus for State coalitions include developing data systems, advocacy, statewide planning efforts, administration, direct services, public awareness and community education. Needs assessment and planning activities conducted by coalitions are designed to document gaps in current response and prevention efforts and help guide future endeavors. FVPSP funding also enables State coalitions to provide technical assistance to State agencies and organizations on policy and practice related to domestic violence intervention and prevention, as well as ongoing training and support to local domestic violence programs, many of whom receive State-allocated FVPSA funds. By funding these types of State coalition activities, the FVPSP demonstrates its commitment to inclusive, broad-based planning at the State and local levels.
Data Issues
Current and available data sources and informational systems are inadequate to accurately report on information, resource development and support services in place to assist victims of domestic violence. As indicated earlier, ACF is continuing to discuss the development of a voluntary aggregate data reporting system for the family violence program with its State and local partners. Moreover, in collaboration with other Federal agencies and State and local partners, ACF has begun to establish a typology of domestic violence services acceptable to all organizations and agencies in the field. These efforts have been supplemented by discussions through the resource center network related to responsibly documenting the impact of efforts at the local, state and national levels.
It is expected that by the end of fiscal year 2002, 50 percent of the States and 30 percent of the Tribes will have received survey methodology training and technical assistance in order to conduct assessments on the adequacy of the resource and services plan and the appropriateness of the measures being developed by the DOW workgroup to track performance.
Summary Table
|
Performance Measures |
Targets |
Actual |
Reference | ||
|
Program Goal: Build healthy, safe and supportive communities and Tribes that increase the ability of family violence victims to plan for safety. 8.2a. Increase the number of Federally recognized Indian Tribes that have family violence prevention programs. |
|
|
| ||
|
8.2b. Increase the capacity of the National Domestic Violence Hotline to receive and respond to an increase in the average number of calls per month. |
FY 02:11,500 |
FY 02: |
Px M-146 | ||
|
8.2c. Build the capacity of the National Domestic Violence Hotline to receive and respond to calls from sexual assault victims/survivors and their family/friends(developmental). |
FY 02: |
FY 02: |
Px M-146 | ||
|
Ö FY 1999 data that were not available when the FY 1999 report was submitted with the FY 2001 CJ *This target for measure 8.2b was increased from 10,000 to 11,000 based on FY 2000 actual performance. | |||||
|
Total Funding (dollars in millions) See detailed Budget Linkage Table in Appendix 6 for line items included in funding totals. |
FY 02: $119.1 |
Bx: budget just. section H | |||
Performance Measures for FY 2002 and Final Measures for FY 2001
The Family Violence Program has initiated several efforts designed to assist in developing performance indicators and outcome measures for the various programs and activities funded with FVPSA funds. There is currently considerable variation in the type and comparability of data reported by State and Tribal grantees, as well as from State coalitions and discretionary grantees. This is in part because of the tremendous variation in the types of services and activities funded within each State or locality, given other Federal, State and local funding that might also be available, as well as the varying reporting capacity of grantees to provide extensive data. This FVPSP effort will be accomplished in collaboration with the States, State domestic violence coalitions, the national resource center network, and Federal-level partners to reach consensus.
Specifically, these efforts include the funding of the Documenting Our Work project of the National Resource Center on Domestic Violence, which formed a national working group and completed an extensive number of focus group conference calls to assist in the building of common, but sufficiently inclusive, definitions of the "services" provided by local domestic violence programs and State domestic violence coalitions. These efforts are focused on capturing the impact of services on diverse communities and individuals; initiating a review of the current data elements reported by States to identify those that can be considered baseline; and participating in the Federal agency workgroup exploring the feasibility of developing a standardized Federal reporting form for all victim assistance programs (Violence Against Women Office, Office for Victims of Crime, National Center for Injury Prevention and Control, and FVPSP) which often provide direct or indirect funding to the same agencies.
The "Documenting our Work" (DOW) workgroup is continuing the process of identifying and agreeing on a full range of performance indicators and outcome measures. We anticipate a report with recommendations regarding performance and outcomes by the fourth quarter of FY 2001. The reporting of services provided by shelters is a part of the DOW workgroup's effort. This compilation of reporting services was provided to ACF in March 2001.
The following program performance goals have been developed in two program areas where sufficient data is available to track performance: Tribal program development and the NDVH.
PROGRAM GOAL: Build healthy, safe and supportive communities and Tribes that increase the ability of family violence victims to plan for safety.
Objective: Support programs to provide immediate shelter and related assistance for victims of family violence and their dependents.
8.2a. FY 2001: Increase to 189 (from 174 in 1999) the number of Federally recognized Indian Tribes that have family violence prevention programs.
FY 2002: Increase to 205 (from 189 in 2001) the number of Federally recognized Indian Tribes that have family violence prevention programs.
(NOTE: There are 540 such Tribes; the target is for 35% to have some form of prevention service by FY 2002.)
ACF will provide technical assistance and information to 25 percent of the States and 10 percent of the Indian Tribes aimed at increasing the number of Indian Tribes that sponsor family violence prevention programs. A collaborative planning effort among the national resource center networks, the national domestic violence hotline, and selected State domestic violence coalitions will sponsor technical assistance and information activity for States (25 percent) and Tribes (10 percent) as an ongoing long-term commitment for this targeted initiative. ACF will remove barriers to work for victims of domestic violence and will provide States and Indian Tribes information on program models, best practices and services information to enhance the ability for Tribes to operate quality programs.
PROGRAM GOAL: Ensure that victims of domestic violence and sexual assault, their family and friends, and others interested in their safety and support, have a source of comprehensive and timely information, crisis services, and assistance.
8.2b. FY 2001: Increase the capacity of the National Domestic Violence Hotline to receive and respond to an average of 11,000 calls per month throughout FY 2001.
FY 2002: Increase the capacity of the National Domestic Violence Hotline to receive and respond to an average of 11,500 calls per month throughout FY 2002.
The Hotline currently maintains an average of 22 full and part-time Hotline Advocates, approximately 20 relief, and 30 volunteer advocates. The Advocates ensure that the Hotline is answered 24 hours a day, 7 days a week. The biggest challenge to the Hotline continues to be staffing. To adequately respond to the more than 10,000 calls a month requires a minimum of the staff identified above. Staff resources are at times limited due to turnover, work schedules, compensation and the competition with better paying jobs in the local area of the Hotline. Achieving an average of 11,500 calls per month in FY 2002 will be affected by these limitations.
8.2c. FY 2001: Build the capacity of the National Domestic Violence Hotline to receive and respond to calls from sexual assault victims/survivors and their family/friends (Developmental).
FY 2002: Build the capacity of the National Domestic Violence Hotline to receive and respond to calls from sexual assault victims/survivors and their family/friends (Developmental).
In FY 2000-2001, funding was provided for the NDVH to provide responses to sexual assault as well as domestic violence calls. ACF planning a number of activities to be able to differentiate and track increases of callers related to sexual assault and domestic violence and measure the impact (both programmatically and organizationally) of these expanded services. The Hotline currently responds to sexual assault calls as part of its on-going operation. We are unable to report the number of sexual assault calls as callers are not required to identify themselves or provide reasons for why they are calling. In the process of active listening, the advocates have recognized that some of the calls are sexual assault calls. The Hotline has not recorded the number of sexual assault calls since the number would be inaccurate and misleading. We are currently developing training for the advocates on ways to appropriately respond to callers who have identified themselves as victims of sexual assault including rape and other abuses (past and current). The proposed training is scheduled for FY 2001 and will provide advocates with a structured manner and basis to respond to and report the calls.
LOW-INCOME HOME ENERGY ASSISTANCE (LIHEAP)
Program Description, Content, Legislative Intent, and Broad Program Goals
Program Description: The Low-Income Home Energy Assistance Program (LIHEAP) is one of six block grant programs authorized by the Omnibus Budget Reconciliation Act of 1981 (OBRA). States, eligible Indian Tribes/Tribal organizations, and Insular areas that wish to assist low-income households in meeting the costs of home energy may apply for LIHEAP block grant funds. The LIHEAP statute requires that LIHEAP benefits be limited to assisting eligible households in meeting their heating and cooling costs, not their total residential energy bill, which includes such things as lighting and appliances.
LIHEAP benefits include the following: (1) heating or cooling assistance (i.e., fuel subsidies) to increase the affordability of low-income households to heat or cool their homes; (2) energy crisis intervention to assist low-income households to cope with weather-related and supply-shortage home energy emergencies, and other household energy-related emergencies; and (3) low-cost residential weatherization and other energy-related home repairs to assist low-income households in safely increasing the efficiency of their home energy consumption, thus lowering their home energy bills and making their homes more comfortable.
Content: As a block grant, LIHEAP grantees design their own programs within very broad Federal guidelines. LIHEAP grantees have the authority to determine how to implement or target their programs and how best to carry out the purposes of LIHEAP. ACF has a limited role in determining how LIHEAP funds are spent.
The need for energy assistance is affected by the severity of the weather, fluctuations in home heating or cooling fuel costs, the economy, and the impact of restructuring the utility industry on low-income households. However, LIHEAP is not an entitlement program. LIHEAP appropriations are allocated to LIHEAP grantees on the basis of a statutory formula that gives greater weight to cold temperatures and results in great discrepancies in per capita funding. This in turn leads to large differences among LIHEAP grantees in average benefits and the number of households receiving LIHEAP assistance.
Legislative Intent: The Human Services Amendments of 1994 (P.L. 103-252) clarified that the purpose of LIHEAP is "to assist low-income households, particularly those with the lowest income, that pay a high proportion of household income for home energy, primarily in meeting their immediate home energy needs." Congress further indicated that LIHEAP grantees need to ensure that LIHEAP benefits are targeted to those low-income households that have the highest energy costs or needs.
"LIHEAP targeting" can be defined as serving eligible households that have the highest energy costs or needs at a higher rate than the total eligible household population. "Highest home energy needs" is defined by the LIHEAP statute as "the home energy requirements of a household determined by taking into account both the energy burden of such household and the unique situation of such household that results from having members of "vulnerable" populations, including very young children, individuals with disabilities, and frail older individuals. However, the statute does not define the terms, "young children," "individuals with disabilities," and "frail older individuals."
Broad Program Goals: LIHEAP's broad program goals include: (1) minimizing health and safety risks that result from high home energy burdens: such risks include unsafe home temperatures, loss of home energy due to inability to pay, weather-related and supply shortage home energy emergencies, or inoperative/faulty heating or cooling equipment; and (2) targeting energy assistance to low-income households, especially those households which have the highest energy costs or needs, to assist them in meeting their immediate home energy needs.
Program Activities, Strategies and Resources
ACF is committed to working with the States to improve program performance in targeting LIHEAP assistance to eligible households, which have the highest energy, costs or needs. LIHEAP targeting serves as a proxy for measuring program outcome. Improved targeting performance addresses the LIHEAP statute's purpose of primarily assisting those eligible households with the lowest incomes in meeting their immediate home energy needs. ACF is assisted in this endeavor by the LIHEAP Advisory Committee. The ongoing tasks of the Advisory Committee are: (1) to collaborate with ACF in developing recommendations on cost-effective performance goals and measures for LIHEAP that will meet the requirements of GPRA, and (2) to enhance program management practices through "Managing for Results."
Program Activities: By the end of FY 2001, ACF expects its LIHEAP Advisory Committee on Managing for Results to complete the following program activities:
By the end of FY 2001, ACF expects to complete the following program activities:
Program Strategies: Given that LIHEAP is a Federal block grant, ACF does not require State LIHEAP grantees to report on LIHEAP targeting performance. Instead, ACF is working with its Advisory Committee on Managing for Results and the National Energy Assistance Directors' Association (NEADA) to encourage, assist, and guide State LIHEAP agencies in measuring and analyzing LIHEAP targeting performance. ACF is working to create a "multiplier effect" whereby State LIHEAP grantees can receive peer assistance to replicate States that have successfully used LIHEAP targeting data in the management of their LIHEAP programs.
Program Resources: ACF staff and financial resources are limited in providing direct technical assistance to State LIHEAP agencies in measuring and analyzing their LIHEAP program's targeting performance. About $43,000 in LIHEAP T&TA funds is available for FY 2001 LIHEAP performance measurement activities. Currently, one ACF staff member devotes about 25% of his time to LIHEAP performance measurement.
LIHEAP grantees are limited to spending no more than 10% of their LHEAP allotments on planning and administration costs. Thus, they have limited capabilities to redesign their data collection and processing systems to collect, tabulate, and analyze performance data that are especially useful in measuring program outcomes.
The LIHEAP regulations [45 CFR 96.88(a)] published in 1997 address limitations on the use of LIHEAP funds for administrative costs. The regulations state that any expenditure for governmental functions normally associated with administration in a public assistance program must be included in determining administrative costs subject to the statutory limitation on administrative costs. However, the final regulation published in April 1999 for the Temporary Assistance for Needy Families (TANF) program [45 CFR 263.13(b)] are somewhat more flexible allowing grantees to improve information technology capacity outside the administrative cost cap. LIHEAP grantees may adopt the TANF administrative cost definitions for their LIHEAP project and ACF will work with them to help improve their performance measurement capacity where possible.
Program Coordination, Partnerships and Crosscutting Issues
Program Coordination: ACF will coordinate in FY 2002 its LIHEAP performance measurement activities through the following activities:
Program Partnership: ACF is a member on the Board of the National Low-Income Energy Consortium (NLIEC), which focuses on low-income energy issues. NLIEC brings together public, private, and nonprofit sector organizations for the common purpose of reducing the residential energy hardships and crises faced by low-income consumers.
ACF collaborates with national organizations whose State or local members provide energy assistance services to low-income households. In addition to NEADA, such organizations include the National Fuel Fund Network, American Public Human Services Association, National Association of Community Action Agencies, National Association for State Community Services Programs, and the National Community Action Foundation.
Finally, ACF and the Department of Energy are examining the opportunities for coordination between LIHEAP and LIWAP regarding the new State energy benefit programs for low-income households brought about by utility restructuring.
Crosscutting Issues: The need for energy assistance affects a range of issues for low-income households, such as health, safety, nutrition, education, and homelessness. Studies have shown the following:
Program-wide Performance
In June 2000, the Advisory Committee sent the States its 2000 LIHEAP Survey on Managing for Results to determine, in part, how many States had set measurable performance goals or other LIHEAP performance goals in FY 2000. Results from the survey indicated that a small number of States established FY 2000 performance goals for vulnerable households, i.e., a number or percent of recipient households that included an elderly member or young child. Some States indicated that their goal was to "increase the number of vulnerable households served," while others indicated that they had a performance goal, but did not specify a performance target for the goal. In FY 2000, only five States reported establishing performance goals for measure 8.3a and four reported meeting that performance; two States set and met their performance goals for measure 8.3b. An increase in the number of States establishing and reporting on LIHEAP performance goals will require additional T&TA and further work with ACF's partners to demystify the field of performance measurement. ACF intends to analyze the results of LIHEAP performance measurement when at least 25% of the States implement LIHEAP measurement systems and report their performance results and analyses.
Data Issues
ACF's ability to affect program-wide achievement is limited, as it does not provide energy assistance directly to eligible low-income households. ACF relies on the efforts of its LIHEAP grantees for delivery of services and achieving program performance. The measurement of block grant performance has been examined by the General Accounting Office in its report, Managing for Results: Measuring Program Results That Are Under Limited Federal Control, (December 1998, GGD-99-16). This report identifies data verification and validation problems inherent in applying GPRA requirements to Federally-funded programs where the States have extensive flexibility.
The LIHEAP statute provides for the collection of several types of data that could be used in the measurement of LIHEAP targeting performance. Congress established annual LIHEAP reporting requirements to track the home energy use, cost, and consumption of LIHEAP-eligible households; and the number, income, and presence of vulnerable household members of LIHEAP-recipient households receiving LIHEAP assistance. As described below, there are several issues concerning data collection:
LIHEAP Eligible Households
LIHEAP Recipient Households
Summary Table
|
Performance Measures |
Targets |
Actual |
Reference | ||
|
Program Goal: Increase the availability of LIHEAP fuel assistance to eligible households having at least one member whose health is vulnerable (60 years or older, or five years old or under) by living in a home without sufficient heating or cooling. 8.3a. Increase the percent of LIHEAP grantees that have set a goal for the participation rate of LIHEAP-eligible households having at least one member who is 60 years or older, and are successful in meeting that goal. |
|
|
| ||
|
8.3b. Increase the percent of LIHEAP grantees that have set a goal for the participation rate of LIHEAP-eligible households having at least one member who is age 5 years or younger, and are successful in meeting that goal. |
FY 02: 75% |
FY 02: |
Px M-154 | ||
|
*In FY 2000, five States set targets for households having at least one member 60 years or older. Four of the States reported meeting their target, resulting in a percentage of 80% (4/5); in FY 1999, ten States set performance targets and five met them, resulting in a percentage of 50% (5/10). **In FY 2000, two States set targets for households having at least one member age 5 years or younger. Both State reported meeting their target, resulting in a percentage of 100%; in FY 1999, four States set the target and one State met the target (1/4=25%). ***FY 1998 baseline provided States with data to calculate the number or percent of LIHEAP-assisted households having at least one member who was 60 years or older or 5 years or younger. The data provided a starting point for States in setting performance targets. . | |||||
|
Total Funding (dollars in millions) See detailed Budget Linkage Table in Appendix 6 for line items included in funding totals. |
FY 02: $1700.0 |
Bx: budget just. section F | |||
Performance Measures for FY 2002 and Final Measures for FY 2001
The protection of the health and safety of vulnerable members is a key LIHEAP program goal. Therefore, ACF will continue with this program goal for FY 2001 and FY 2002-"to increase the availability of LIHEAP fuel assistance to eligible households with at least one member whose health or safety is vulnerable (60 years or older, or 5 years or younger) by living in a home without sufficient heating or cooling." Improved targeting performance addresses the LIHEAP statute's purpose of helping those most in need to meet their immediate home energy needs.
The manner in which the LIHEAP targeting goals are stated continue to reflect the flexibility of the block grant approach by allowing each State to set its own targeting goal for vulnerable households.
PROGRAM GOAL: Increase the availability of LIHEAP fuel assistance to eligible households with at least one member whose health is vulnerable to a home without sufficient heating or cooling.
8.3a. FY 2002: At least 75% of grantees that have set a goal for the participation rate of eligible households having at least one member in the household who is 60 years or older are successful in meeting that goal. (Baseline data is FY 1999.)
FY 2001: At least 75% of grantees that have set a goal for the participation rate of eligible households having at least one member in the household who is 60 years or older are successful in meeting that goal.
8.3b. FY 2002: At least 75% of grantees that have set a goal for the participation rate of eligible households having at least one member in the household who is age 5 years or younger are successful in meeting that goal. (Baseline data is FY 1999.)
FY 2001: At least 75% of grantees that have set a goal for the participation rate of eligible households having at least one member in the household who is age 5 years or younger are successful in meeting that goal.
Data sources: Results from the Advisory Committee's FY 2001 LIHEAP Survey on Managing for Results.
ACF also is developing "targeting indexes" as a potential additional measure of LIHEAP targeting performance. ACF has been producing State-level estimates of the number of LIHEAP-eligible households having at least one person 60 years or older and at least one child five years old or younger. The State-level estimates are calculated using weighted averages from three consecutive years of March CPS data. The Census Bureau uses a similar methodology in providing annual State-level estimates of the number of low-income students for use in the Federally-subsidized School Lunch Program.
LIHEAP targeting indexes are calculated by using (1) the weighted averages from the most recent three consecutive years of data from the March CPS and (2) State-reported data on LIHEAP recipients.
ACF will calculate LIHEAP targeting indexes for FY 2001 at the national, Census region, and Census division level, using March 2000, March 2001, and March 2002 CPS data; and State-reported LIHEAP-recipient household data for FY 2001.
Calculate baseline targeting indexes (at the national, Census region, and Census division level) for the number of LIHEAP households receiving home energy assistance that have at least one member who is age 60 years or older, or 5 years or younger. (Developmental)
Data sources: (1) LIHEAP-recipient household counts by vulnerable group, as reported in States' LIHEAP Household Report for FY 2001, (2) annual estimates of LIHEAP income eligible households by vulnerable group from the three year weighted averages calculated from the March 2000, March 2001, and March 2002 Current Population Survey.
Program Description, Content, Legislative Intent, and Broad Program Goals
ACF's Administration for Native Americans (ANA) operates programs mandated to provide grant funding to the full range of Native American populations. ANA is the only Federal agency serving all Native Americans, including over 550 Federally recognized Tribes, 250 Tribes that are State-recognized or seeking Federal recognition, Indian organizations, over 200 Alaska villages, Native Hawaiian communities, and populations throughout the Pacific basin. All Indian and Alaska Native organizations, Native Hawaiian communities, and Native populations in Guam, American Samoa, Republic of Palau, and the Commonwealth of the Northern Mariana Islands are eligible for ANA programs. This includes non-federally recognized Tribes, Urban Indian Centers, small communities in rural areas of Alaska and the Pacific Basin, along with many others such as Alaska Native villages, multi-purpose community-based Indian organizations and consortia. ANA provides grants, training, and technical assistance to eligible Tribes and Native American organizations representing 2.2 million individuals.
Promoting the goal of social and economic self-sufficiency through local self-determination is the cornerstone of ANA's program philosophy. Self-sufficiency is that level of development at which a Native American community can control and internally generate resources to provide for the needs of its members and meet its own economic and social goals. Social and economic underdevelopment is the paramount obstacle to the self-sufficiency of Native American communities and families.
In 1981, ACF collaborated with Tribes and Native communities to develop the innovative Social and Economic Development Strategies (SEDS) program. SEDS is based on the premise that a local community has the primary responsibility for determining its own needs, planning and implementing its own programs, and using its own natural and human resources. In initiating the SEDS approach, ACF developed a framework of three interrelated goals:
Through this direct grant funding relationship, Tribes and Native communities have created administrative systems to operate their own social and economic programs, in much the same way as State and local governments. Support for the unique, government to government relationship that exists between Tribal governments and the Federal government is reflected in this approach. These funds will support self-sufficiency efforts by Tribes through economic development and governance projects. Increasing the number of grants awarded will increase the core outcomes that typically occur as grants are measured over time. Additional priority funding areas include native language preservation, recovery and enhancement, environmental regulatory enhancement, and environmental mitigation. The development of performance goals will take place within this context. The preliminary goals and measures below will be further developed through this partnership process, and will include data and baselines.
ANA faces unique challenges in formulating goals and measuring results. As a discretionary grant program funding projects designed and implemented at the local level, the differences between projects are considerable in terms of size, scope, community goals, and funding levels. Because Tribes and Native American communities set their own goals and priorities, ACF requests objective progress reports throughout the project period of the grant and an objective evaluation report once the grant has ended. This system provides information on goals and measures, but these are solely unique to the Tribe or community. Each grantee is at different stages of social and economic development. Administrative and organizational capacity varies greatly among grantees, making more difficult the prospect of developing more "conventional" measures.
Many ANA grants are aimed at capacity-building and infrastructure development for Tribes and organizations, particularly through the development of legal codes, courts systems, and the revision of existing Tribal constitutions. Capacity-building encompasses not only economic development (creation and expansion of businesses and jobs), but also efforts to create new programs as a result of welfare reform. This emphasis on capacity-building ties into the larger ACF goal to facilitate the changes effected by welfare reform by working together in innovative ways. For both economic and social development, capacity-building and infrastructure development are key factors. ANA will continue to work with its partners to develop meaningful GPRA measures, within the context of sovereignty, and available technical and staff resources at ANA, for job creation, economic well-being, and reducing dependency on social services across a diverse mix of project types, Tribes and Native American organizations.
Program Activities, Strategies and Resources
In prior years, ANA funded over 225 competitive grants annually totaling over $34 million in several grant programs, including Social and Economic Development, Environmental Regulatory Enhancement and Native Languages Preservation and Enhancement. ANA's grant award process is highly competitive; approximately one-third of applicants are funded each year. As part of our rigorous review process, individuals from all populations served by ANA are brought in to read, evaluate and score proposals. These ratings developed by the review panels, along with internal staff reviews and recommendations, provide the basis upon which the ANA Commissioner makes funding decisions. Once funded, projects' progress is monitored through required written progress reports, in-office meetings, and site visits. Consultation with all Native American Tribes, communities and organizations is conducted as a central programmatic activity and guides the Commissioner in formulating ANA priorities and goals. This approach directly supports local self-determination and the government-to-government relationship between Tribes and the Federal government. ANA also has established a Traditional Native Circle, made up of Tribal elders and spiritual leaders, to provide a more holistic perspective on issues facing Tribes and Native communities.
The FY 2001 budget increase provided the necessary resources of $10.6 million to fund an increase in grants under ANA programs. This additional funding will provide funds for an estimated 30 to 50 additional grants annually, depending on the type of projects approved under the competitive review process. Based on the rate of elders' participation in prior years, ANA expects to increase elder participation by approximately 10 new grant projects. The funding will expand training and technical assistance, increase grant application rates and awards to Tribes and organizations that have not received assistance in the past.
Program Coordination, Partnerships and Crosscutting Issues
ANA coordinates with all ACF program offices regarding Native American issues. These offices include Head Start, Office of Community Services (Tribal TANF), and the Child Care Bureau. ANA has provided a leadership role on a number of issues within ACF and throughout the Department, including the development of the DHHS Tribal Consultation Plan, Tribal Colleges and Universities Plan, and other initiatives involving Native populations. The Intra-Departmental Council on Native American Affairs (IDCNAA), located within ANA, coordinates numerous activities and initiatives with HHS agencies, such as the Indian Health Service (IHS), and external departments such as the Department of Interior (DOI). The Commissioner represents ANA as a member of the Domestic Policy Council - Working Group on American Indians and Alaska Natives, an organization that facilitates the development of new initiatives and program coordination across Federal agencies.
Program-wide Performance
ANA has exceeded its targets for FY 1999 and is confident that all targets for FY 2000 will be met due to the provision of consistent technical assistance and the emphasis on the role of Tribal elders in Indian communities. Elders play a key role in Tribal culture by protecting and preserving tribal cultural heritage including language, traditions and lifeways. They also play a critical role in providing guidance to youth. Increased elder participation (measure 8.4a) has occurred due to their inclusion in the native language grants awarded and to various SEDS projects that focus on culture. In 1998, with the addition of the Pacific region, the number of T/TA contractors increased from five to six. New contract performance requirements have led to all contractors expanding the variety of technical assistance delivery methods they use. In addition to on-site assistance, contractors are now offering walk-up, world-wide web, telephone, fax, e-mail and other state-of-the-art delivery mechanisms. Other initiatives under consideration include on-line chats and threaded discussions, electronic newsletters, and CD-ROM training programs.
ANA regularly selects new program goals and priorities. For example, in 1999, ANA: (1) initiated a new retirement plan policy in FY 1999 for all ANA financial assistance grantees that was modified for FY 2000; (2) played a key role in the Department's tribal consultation policy implementation; and (3) was the ACF lead organization in implementing the Tribal Colleges/Universities (TCU) Executive Order.
ANA's retirement plan policy that now strongly encourages such plans was developed, in part, to address socioeconomic trends indicating that American Indians are slipping farther behind the U.S. population. In 1979, 27% of American Indians were living in poverty compared to 12% of the U.S. population. By 1989, 31% of American Indians were living in poverty compared to 13% of the U.S. population. The U.S. economy contributes to this situation: because the least skilled and least educated earn less and find it harder to remain employed, ANA recognized that jobs created through grant programs could serve as a starting point for long-term individual benefits in retirement. ANA achieved 100% compliance in 1999 with all grant-funded employees under new grants receiving self-directed retirement plan fringe benefits.
Through the Tribal Colleges/Universities effort, ANA provided financial and technology assistance, in the form of grants and computer hardware, software and accessories, to the colleges and universities. ANA also modified its grant eligibility statement to allow TCUs direct competition for funding in addition to Tribes' eligibility.
While performance goals such as the retirement and TCU initiatives result in lasting, positive impacts on socioeconomic conditions for Native Americans, they are not suitable as GPRA measurements because they can be implemented and achieved quickly, typically within a year or two. ANA selected elder participation and training and technical assistance as performance goals to represent key, long-term, closely associated activities which require year-to-year continuous effort by grantees and the agency.
Data Issues
The primary source for data collection on the above performance measures is the Grant Award Tracking and Evaluation System (GATES). Funded grants are entered into these systems and a full description of the project as well as the goals and objectives. It will be necessary for ACF to design and perform systematic validation surveys of grant proposals regarding the types of projects and proposed participants, including trends and changes from other periods; potential applicants' use of technology; and training and technical assistance providers' outcomes and delivery levels. Such surveys will be reconsidered based on FY 2001 recruitment of professional staff experienced in Native American programs and trained on the use of new grant database systems for recording and analyzing information.
In FY 1999, ANA completed work with ACF's Office of Information Services to move all existing performance measure data from the former "Project Information and Evaluation System" (PIES) into GATES. ANA is one of the first offices to populate ACF's new Y2K compliant database with program performance measures and data. ANA will now begin to develop a strategy to validate data and determine if pre-existing data has value for GPRA performance measures. ANA will also work with other ACF programs to identify and develop standardized, cross-program measures.
Summary Table
|
Performance Measures |
Targets |
Actual |
Reference |
|
Program Goal: Support and encourage the role of Tribal elders in the community; promote efforts to involve elders in work as mentors with youth and children, e.g., teaching culture and language in Head Start and other child care programs. 8.4a. Increase the number of grants that include elder participation. |
|
|
|
|
Program Goal: Increase the provision of training and technical assistance services to the diverse Native American population, with particular emphasis on urban organizations, rural and non-Federally recognized Tribes. 8.4b. Maintain the number of TA visits per year to diverse Native American population, with emphasis on urban Native organizations, rural & non-Federally recognized Tribes. |
|
|
Px M-159 |
|
Ö FY 1999 data that were not available when the FY 1999 report was submitted with the FY 2001 CJ. Availability of FY 2000 data: ANA will report on FY 2000 performance in the third quarter of FY 2001. *ANA determined that the previous report of 1614 TTA visits for FY 1997 is insupportable and has provided the revised count of 1014 TTA visits. | |||
|
Total Funding (dollars in millions) See detailed Budget Linkage Table in Appendix 6 for line items included in funding totals. |
FY 02: $44.4 |
Bx: budget just. section H | |
Performance Measures for FY 2002 and Final Measures for FY 2001
PROGRAM GOAL: Support and encourage the role of Tribal elders in the community; promote efforts to involve elders as mentors with youth and children, e.g., teaching culture and language in Head Start, other child care programs, and adult programs.
8.4a. FY 2001: Increase to 65 the number of grants that include elder participation from the 1997 baseline level of 44 grants.
FY 2002: Increase to 70 the number of grants that include elder participation from the 1997 baseline level of 44 grants.
Tribal elder involvement was selected as a key measure of program performance because the role of Tribal elders is essential in all aspects of Tribal and community life. Support of Tribal elders and providing a voice for their concerns has been an important emphasis area. Through the Tribal Elders Initiative, elders meet regularly with ANA/ACF officials and staff.
PROGRAM GOAL: Maintain the provision of training and technical assistance services (T/TA) to the diverse Native American population, with particular emphasis on urban organizations, rural and non-Federally recognized tribes.
8.4b. FY 2001: Increase to 1,500 the number of technical assistance contacts per year by Tribal T/TA contractors to the diverse Native American population, with particular emphasis on urban Native organizations, rural and non-Federally recognized Tribes.
FY 2002: Maintain at 1,500 the number of technical assistance contacts per year by Tribal T/TA contractors to the diverse Native American population, with particular emphasis on urban Native organizations, rural and non-Federally recognized Tribes.
Training and technical assistance delivery was selected as a key measure of program performance because of its "domino effect" and the cost-efficient aspects of field-based training. As individuals are given assistance, they are able to transfer the knowledge and skills to other key grant professionals at the Tribal office, train others and build a useful skill base. The T/TA contractors assist Tribes and Native communities in conceptualizing strategies for social and economic development, preservation of native languages, environmental regulatory enhancement, and environmental mitigation, translating them into viable applications for ANA funds.
For FY 2002, ANA expects training and technical assistance to potential and existing grantees to be maintained at the FY 2001 level of 1,500 contacts. The maintenance at 1,500 in the number of T/TA site visits is based on the level funding of these contracts. However, level funding alone does not assure sustained delivery of technical assistance year-to-year. To maintain a constant level of assistance, ANA must address client willingness to seek continued technical assistance after a successful or unsuccessful competition effort, encourage clients to consider projects aligned with ANA's national objectives, and recognize opportunities for additional grants when appropriations are increased.
Competition for ANA's technical assistance contracts occurs no less than every three years, and, when necessary, as frequently as every year to maintain performance standards. ANA is working to stagger contract competition cycles among the renewals and new contract competitions for the regions. For this reason, ANA has selected a three-year running average to measure performance since, in particular, new contracts have a start-up cycle that can affect delivery.
|
BUILD A RESULTS-ORIENTED ORGANIZATION |
Rationale
In order for ACF to provide assistance to America's most vulnerable populations, it is essential that the organization focus on results, provide high quality, cost-effective and efficient services, meet customers' needs and expectations, and use state-of-the-art information technology to improve management and data systems.
The objectives for this goal are:
Program Description, Content, Legislative Intent, and Program Goals
ACF has endeavored to embrace the principles of GPRA reinventing the way we do business through partnership building, strategic planning, measurable outcomes, customer focus, streamlining of operations and devotion to quality. ACF's goal of becoming a more results-oriented organization has brought about changes in its internal management. Its efforts in recent years include:
Examples of strategies that have proven most successful in strengthening ACF as a results-oriented organization include:
A request to increase Federal Administration by $11 million above the FY 2001 enacted level will provide funds for mandatory pay raises, additional support for the on-going implementation of the child welfare monitoring initiative, and 15 additional FTE and associated funding to maintain a Center for Faith-Based and Community Initiatives in accordance with the President's recent Executive Order.
Program-wide Performance
The original objective for FY 1999 and 2000 was to change the way ACF does business by reducing bureaucratic levels and relying more on teams; maintaining or increasing values such as effectiveness, efficiency and diversity while reducing the number of managers. The FY 2000 target ratio of 1:9 was not attained. Progress towards this goal has been stymied by severe outside hiring limitations. During FY 1998-1999, we were unable to reduce supervisory personnel for demographic reasons and the number of non-supervisory personnel continued to decline. This resulted in an increase in manager to staff ratio of 1:5. ACF replaced measure 9.1a with measure 9.1b (the FY 2001-2002 measure) which better reflects ACF's commitment to improve employee knowledge and skills.
During FY 2000, ACF confronted dangerously shrinking staff levels and a waning knowledge and skills bank due to attrition and separations. Simultaneously, expanding workload demands continued to increase the need for technically and technologically advanced staff. These combined challenges, within an agency over half of whose workforce are eligible to retire in the next five years, refocused efforts from initiatives of streamlining staff and decreasing the manager to staff ratio to developing a highly skilled, diversified staff to carry out its mission in the twenty-first century. To address these issues, ACF developed an agency training strategy that provides training for new hires and increases and broadens training opportunities for existing staff, and a diversity and minority initiative to ensure that ACF's workforce reflects all groups including our most under-represented populations.
ACF participated in the 1999 Employee Satisfaction Survey sponsored by National Partnership for Reinventing Government (NPR) and the Office of Personnel Management (OPM). Following are highlights of the results:
ACF has selected four areas from the survey to concentrate where scores were significantly below the government-wide average. These four areas provide the core of our Reinvention Priority Work Plan that is focused on employee communication and performance management; diversity and minority initiatives and training and staff development.
During FY 2001, ACF is analyzing information gathered for work force planning purposes in order to accurately gauge and project for the next 3 to 5 years: current agency workload, current employees' competencies, estimated future workloads and future competency needs. ACF will develop and begin implementing an action plan to address any identified gaps in the staffing needed to complete core workloads or in employees' competencies. These efforts will help us identify additional measures for tracking progress in this area. Additional measures will be incorporated in future GPRA annual performance plans.
Summary Table
|
Performance Measures |
Targets |
Actual |
Reference | ||||
|
9.1a. In FY 2000, increase ACF's manager-to-staff ratio from 1:4.6 in FY 1993 to 1:8. (dropped)
9.1b. Each ACF staff member participates in at least one Distance Learning or other training opportunity directly related to increasing his/her job skills. |
FY 01:dropped |
FY 00: 1.5 ** |
| ||||
|
*Original performance goal and target for FY 1999. Staff separations have been primarily non-supervisory without full replacement. New legislation, such as TANF, and organizational realignments have also affected this target. **FY's 1999 and 2000 target ratio of 1:9 was not attained. Progress towards this goal has been stymied by severe outside hiring limitations. During 1998, we were unable to reduce supervisory personnel for demographic reasons and the number of non-supervisory personnel continued to decline. This resulted in an increase in our manager to staff ratio. We have replaced 9.1a with 9.1b (the FY 2001 measure) which better reflects ACF's commitment to improve employee knowledge and skills. Availability of FY 2000 Data: Data will be available March 2001. | |||||||
|
Total Funding (dollars in millions) See detailed Budget Linkage Table in Appendix 6 for line items included in funding totals. |
FY 02: $174.9 |
Bx: budget just. section H
| |||||
Performance Measures for FY 2002 and Final Measures for FY 2001
9.1b. FY 2001: Each ACF staff member participates in at least one training opportunity directly related to increasing his/her job skills (baseline=FY 2000).
FY 2002: Each ACF staff member participates in at least one training opportunity directly related to increasing his/her job skills (baseline=FY 2000).
Data Source: ACF Administrative Records
Program Activities, Strategies, and Resources
Historically, ACF processed grants using more than 30 separate computer programs (application systems). In 1993, ACF initiated a re-engineering of its business processes, challenging the purpose, principles and assumptions of ACF's grant processes and abandoning the outdated grant-making and management procedures and rules for all categories of grants. In July 1994, the ACF Grants Re-engineering Team published its report. The report recommended an organizational restructuring of the way ACF does business, establishing a quality assurance framework and supporting re-engineered grants administration activities with a major redesign of the automated information systems.
A systems re-engineering team began developing an integrated system, the Grants Administration, Tracking and Evaluation System (GATES), designed to support decision-making and accountability in a decentralized environment. This project targeted the replacement of more than 30 incompatible, outmoded legacy systems operating on a variety of platforms supporting grants administration. This re-engineered GATES, a comprehensive system for electronic processing, benefits grantees by providing more timely and efficient grants processing, more accurate data, less down time and quicker start-up.
GATES schedules have been developed jointly with each Program Office and Region affected through Joint Application Development (JAD) meetings with crosscutting representation in small face-to-face meetings and telephone conferences.
The GATES project has been rolled out in ACF over the last few years. ACF has made significant progress in developing the current GATES modules. We recently implemented the formula/block award modules on the schedule expected by GATES users. This implementation completes the legacy conversation/replacement efforts. Now, all grants are awarded through GATES. Yearly targets and accomplishments are included in the ACF annual performance plan. Regular weekly GATES project meetings and periodic reporting closely track and report progress.
ACF will implement a next generation of electronic grant-making through an "Electronic Grants Initiative" that will comprise the "GATES II" application. Plans have been presented to the Information Technology Review Board (ITRB) consistent with the new Government Paperwork Elimination Act.
Program-wide Performance
In FY 1996 and FY 1997, ACF completed developing and implementing GATES system functions supporting application, evaluation, award and funds control activities for Discretionary Grants made to non-profit and Native American organizations. In FY 1998, 22 legacy systems were replaced. The FY 1999 target (measure 10.1c) was to replace 15 additional legacy systems. The deployment of the Entitlements portion of GATES in June 1999 completed the replacement of the additional 15 systems. Now 100 percent of the active ACF grants are being processed electronically in GATES. Replacement of these legacy systems with GATES also corrected the Year 2000 programming flaw embedded in them. All Y2K system replacements were completed by December 31, 1998.
ACF completed the full functionality planned for GATES. The Audit resolution tracking process (measure 10.1b) was implemented in GATES and the old system shut down in August of 2000. ACF adopted the Crystal Report Writing software that allows the user community to retrieve information in GATES efficiently and quickly. Both standard and ad hoc reporting retrieval is possible. Crystal Report writer licenses have been distributed and training conducted throughout the ACF grant and program offices. Additionally, OIS has set up a Crystal Report support system to assist users with the development and usage of the standards and ad hoc GATES reports. This was implemented in June 2000. Enhancements for tying in to the Bureau of Census' Federal Clearinghouse, as well as debt collection capabilities, are scheduled for the 2001 module.
Summary Table
|
Performance Measures |
Targets |
Actual |
Reference |
|
10.1a. Develop and implement GATES II, which will capture and validate grant information submitted by grantees using the Web.* 10.1b. In FY 2000, replace the audit system; provide a user- report retrieval capability.
10.1c. In FY 1999, replace [a total of] 27 individual automated grant systems. Use technology for purposes of child support enforcement, foster care, funds planning and electronic collection of State plans. ** |
FY 02: GATES II
|
FY 02:
|
Px M-164 |
|
* Implementing the GATES II system will be completed in phases. **The revised goal for FY 1999 was an additional 15 systems. These 15 systems were completed June 1999. NOTE: Twenty-two systems were replaced in FY 1998. With the implementation of this goal, by the year 2000 nearly 10,000 ACF grant actions and over 5,300 grants awards were processed more efficiently and effectively. This improvement corrected the Year 2000 programming flaw embedded in current grants programs. Availability of FY 2000 data: June 2001. | |||
Performance Measures for FY 2002 and Final Measures for FY 2001
Objective: Benefit Grantees by Improving Automated Data and Management Systems.
10.1a FY 2001: Develop and implement GATES II, which will capture and validate grant information submitted by grantees using the Web.
FY 2002: Develop and implement GATES II, which will capture and validate grant information submitted by grantees using the Web.
Data source: ACF Administrative records
APPENDICES to the PERFORMANCE PLAN
A.1 Approach to performance measurement
ACF and its partners began "focusing on results" before GPRA was in effect. Efforts to reach consensus on outcomes prompted extensive discussion of strategic objectives, legislative requirements, data sources and availability; led to a fuller understanding of outcomes and the relationships to process and output measures; and fostered closer partnership collaborations.
Projected results and impacts vary across goals and objectives depending on the nature of the issues, the identification of appropriate measures and the ability to collect the data. In areas where results are quantifiable and data are available, ACF can report results on a more timely basis. In other areas, where outcomes are qualitative or more complex, additional efforts are required to achieve consensus on appropriate outcomes and measures of success, and to design, develop and implement systems for data collection. This is illustrated by efforts to measure high performance under welfare reform, quality in Head Start, and improvements in child protective services, foster care, and adoptions.
ACF has preserved the original goals and objectives of its overall mission and many individual program goals have remained constant. Continuous program improvement requires ongoing consultation, technical assistance, and coordination across partnerships resulting in some performance measures being modified, dropped or replaced.
Methodology and rationale: Nearly all of ACF's GPRA measures are outcome-oriented and every program has a process in place with its partners to finalize those measures which are developmental. Some of ACF's programs, where funds are limited and programs are implemented by grantees with a limited funding base (such as diverse community youth agencies or sovereign Native American Tribes) have identified process and interim outcome measures. Limitations of the data collection infrastructure and partnership capacities have delayed the availability of robust and reliable outcome data.
The selection of performance measures carries certain risks, such as creating unintended consequences. ACF has endeavored to be mindful of these. While no formal assessments have been made to predict unintended consequences, these have been an important part of the agenda in discussions with partners around goal setting and measurement. For example, in welfare reform, similar job training programs prior to TANF were reviewed, where ill-effects such as "creaming" occurred, in which programs were rewarded for placing clients in jobs. This resulted in programs selecting the more sturdy and employable recipient population for placement. To cite another example in TANF, targeting "caseload reduction" could hasten the premature exit of fragile families from the support of welfare before they were ready for self-sufficiency. Thus, TANF measures have stressed new employment, retention of jobs, and increase of earnings rather than limiting measures to participation rates.
Data verification and validation and other data issues: Because data for ACF programs are mostly collected by grantees and partners, such as States, with collection schedules written into statutes and regulations, several programs have not yet completed the analysis of FY 2000 data. Each program uses considerable resources to verify and validate program data through automatic edit checks, manual reviews or audits, and other forms of quality control and assurance.
Specific data issues are discussed in the individual performance goal sections. ACF has developed a number of different strategies to deal with these issues. There are a number of broad data-related challenges affecting ACF's performance plan. Resolving these challenges (listed below) and other data issues is necessary, time-consuming, difficult, and costly.
Many ACF grantees receive programmatic funds that the legislation either designates or permits to be used for data collection. Discretionary, formula, and entitlement grant awards generally carry reporting requirements directed at facilitating oversight and measuring performance. However, block grants and devolution of program authority to States and other levels of government have resulted in limitations on ACF's collection of data. ACF advocates that recipients of its funds collect a reasonable amount of data from which to determine performance and assure program integrity. For some programs, performance results can be measured and validated through the administrative data that States use to manage their programs.
For a number of major programs, ACF is largely dependent upon State administrative systems for collecting performance data, e.g., Temporary Assistance to Needy Families, Developmental Disabilities, Refugee Resettlement, Child Welfare, Child Support Enforcement, Child Care, and Low Income Home Energy Assistance programs. Other ACF programs, e.g., Head Start, Youth programs, CSBG, and Family Violence, are reliant on local community data systems. Native Americans programs use two internal data tracking systems (Project Information and Evaluation System and the Grant Award Tracking and Evaluation System.). The Head Start information is collected at local grantee sites through the Family and Child Experiences Survey (FACES) which has rigorously defined collection procedures. Several of these programs use survey information to supplement the data.
As a result of many of the challenges listed above, there is a substantial delay in the availability of administrative data in many ACF State grant programs. These delays can reduce knowledge of current program activity, and hinder policy-making and program planning, but sometimes they are inherent in the goals and measures of the program, e.g., job retention and earnings gain in TANF. In FY 2001, ACF will work with DHHS and OMB to develop a plan for reducing the delay in the availability of State administrative data, where appropriate. The plan will identify the length of time between the end of the program year and the availability of program data for public use for each of ACF's major programs in FY 2000; identify the obstacles to publishing data in a more timely manner and, where appropriate, propose a strategy for eliminating these obstacles.
Currently, ACF has the following major data system infrastructures in place: the National Directory of New Hires (Child Support and TANF), the Unemployment Insurance Wage data (UI), the Child Support Survey; the Residential Energy Consumption Survey; March Current Population Survey (CPS) Supplement (Census Bureau); the Refugee Resettlement Survey; Head Start Family and Child Experiences (FACES) Survey; and the National Child Welfare Longitudinal Study.
A.2 Changes and improvements over previous year
ACF has made a number of improvements in this FY 2002 Annual Performance Plan. An executive summary has been added. The FY 2002 plan includes additional information on detailed changes between the Final FY 2001 Plan submitted in February 2000 and the Revised Final FY 2001 Plan including which targets are new, which have been discontinued and which are still developmental (see Appendix A.5 for a summary table). Each of the ACF programs was asked to re-examine its measures and targets, and many programs created a more focused set of measures, e.g., dropping some measures, providing improved measures and targets based on the most recent available data and by narrowing or refining existing measures.
Section I provides additional information on implementing the ACF Priority Workplans, describes strategies aimed at achieving performance goals and identifies major management improvement efforts. Summary charts on the status of FY 1999 and 2000 performance data have been added. Appendix A.4 provides an updated chart for performance data omitted from the prior FY 1999 Performance Report.
In Section II, under each of the strategic goals and objectives, performance goals and measures are discussed in greater detail, along with a fuller discussion of program activities and strategic approaches directed at improving performance. Program-wide performance, identification of partnerships and crosscutting issues, and resource and data issues, including frequency of reporting, are summarized.
The FY 2002 submission is based on budgetary resources from the FY 2002 President's Budget. The detailed budget linkage table (Appendix A.6) has an additional column that provides budget program account numbers.
ACF has endeavored to project targets based on FY 1998 or FY 1999 baseline data wherever possible. There are a few measures that still lack baselines because programs are implementing new initiatives and data collection activities. Baselines for those measures will be established upon completion of start-up and developmental activities. In a very few cases, the targets or measures are stated in ways that cause baselines to change annually (e.g., continuous improvement targets or legislatively defined targets); for those a context has been provided in the narrative.
More descriptive information has been provided in a number of areas: (1) a more comprehensive discussion of program coordination activities and data issues under the program areas; (2) a revision of certain goals and measures to reflect program experience using the same baseline data wherever possible; (3) additional narrative explaining the FY 2001 and 2002 measures; and (4) a status update on FY 2001 measures.
A section on program evaluation has been added to Appendix A.6.
In this version, both the FY 2002 and FY 2001 targets are repeated in the narrative section. Because programs are still refining the wording of many of the measures, it is critical that the specific wording be included in the annual performance plan section for future tracking purposes.
A.3 Linkage to DHHS and OPDIV strategic plans
The ACF Annual Performance Plan links directly with three of the DHHS Strategic Plan Goals:
ACF GOALS AND THE DHHS STRATEGIC PLAN
|
DHHS STRATEGIC GOALS Strategic Objectives |
CORRESPONDING ACF STRATEGIC GOALS Strategic Objectives |
|
GOAL 2: IMPROVE THE ECONOMIC AND SOCIAL WELL-BEING OF INDIVIDUALS, FAMILIES AND COMMUNITIES IN THE UNITED STATES 2.1 Increase the economic independence of low-income families including those receiving welfare |
GOAL 1: INCREASE ECONOMIC INDEPENDENCE AND PRODUCTIVITY FOR FAMILIES 1. Increase employment 2. Increase independent living 4. Increase affordable child care |
|
2.2 Increase the parental involvement and financial support of non-custodial parents in the lives of their children. |
3. Increase parental responsibility |
|
2.3 Improve the healthy development and learning readiness of preschool children |
GOAL 2: IMPROVE HEALTHY DEVELOPMENT, SAFETY AND WELL-BEING OF CHILDREN AND YOUTH 5. Increase the quality of child care to promote childhood development 6. Improve the health status of children |
|
2.4 Improve the safety and security of children and youth |
7. Increase safety, permanency and well-being of children and youth |
|
2.6 Increase independence and quality of life of persons with long-term care needs. |
2. Increase independent living |
|
2.7 Improve the economic and social development of distressed communities |
GOAL 3: INCREASE THE HEALTH AND PROSPERITY OF COMMUNITIES AND TRIBES 8. Build healthy, safe and supportive communities and Tribes |
|
GOAL 3: IMPROVE ACCESS TO HEALTH SERVICES AND ENSURE THE INTEGRITY OF THE NATION'S HEALTH ENTITLEMENT AND SAFETY NET PROGRAMS 3.1 Increase the percentage of the Nation's children and adults who have health insurance coverage |
6. Improve the health status of children |
|
GOAL 4: IMPROVE THE QUALITY OF HEALTH CARE AND HUMAN SERVICES 4.4 Develop knowledge that improves the quality and effectiveness of human services practice. |
(ACF research and demonstration program investments are targeted to improve the quality of services related to objectives 1-8.) |
|
IMPROVE PERFORMANCE |
GOAL 4: BUILD A RESULTS-ORIENTED ORGANIZATION 9. Develop and retain a highly skilled, strongly motivated staff 10. Improve automated data and mgmt systems |
A.4 FY 1999 Performance Data Omitted from Prior FY 1999 Performance Report
|
Performance Goals |
FY 99 Target |
FY 99 Actual Performance |
Reference |
|
TANF | |||
|
1.1a All States meet the TANF all-families work participation rates. |
100% |
100% |
Px M-32 |
|
1.1b All States meet the TANF two-parent families work participation rates. |
100% |
74% |
Px M-32 |
|
| |||
|
Developmental Disabilities | |||
|
1.2a Increase the number of adults with developmental disabilities who obtain integrated jobs as a result of DD program intervention |
9,517 |
8,959 |
Px M-38 |
|
1.2b Increase the number of businesses/employers that employ and support people with developmental disabilities as a result of DD program intervention |
4,353 |
1,113 |
Px M-38 |
|
2.1a Increase the number of people with developmental disabilities owning or renting their own homes as a result of DD program intervention |
2,079 |
34,904 |
Px M-53 |
|
7.2a Increase the number of students with developmental disabilities who are served in more integrated/inclusive educational settings as a result of DD program intervention. |
8,800 |
10,901 |
Px M-111 |
|
7.3a Increase the number of health care providers trained to meet the health needs of people with developmental disabilities as a result of DD program interventions. |
4,000 |
4,100 |
Px M-112 |
|
| |||
|
Refugee Resettlement | |||
|
1.3a Increase the number of refugees entering employment through ACF-funded refugee employment services by at least 5% annually from FY 1997 actual performance. |
5l,597 |
50,208 |
Px M-45 |
|
1.3b Increase the number of entered employments with health benefits available as a subset of full-time job placements by 5% annually from the FY 1997 actual performance. |
27,767 |
28,425 |
Px M-45 |
|
.3c Increase the number of refugee cash assistance cases closed due to employment by at least 5% annually as a subset of all entered employments from the FY 1997 actual performance. |
16,480 |
16,445 |
Px M-45 |
|
11.3d Increase the number of 90-day job retentions as a subset of all entered employments by at least 5% annually from the FY 1997 actual performance. |
37,936 |
36,055 |
Px M-45 |
|
1.3e Increase the number of refugees who enter employment through the Matching Grant (MG) program as a percentage of all MG employable adults by at least 5% annually from the calendar year 1997 actual performance. |
8,620 |
9,713 |
Px M-45 |
|
1.3f Increase the number of refugee families (cases) that are self-sufficient (not dependent on any cash assistance) within the first 4 months after arrival by at least 4% annually from the calendar year 1997 actual performance. |
5,710 |
6,497 |
Px M-45 |
|
| |||
|
Child Support | |||
|
3.1a Increase the paternity establishment percentage among children born out of wedlock |
96% |
106% |
Px M-64 |
|
3.1b Increase the percentage of IV-D cases with support orders |
74% |
60% |
Px M-64 |
|
3.1c Maintain the IV-D collection rate for current support |
71% |
52% |
Px M-64 |
|
3.1d Maintain the percentage of paying cases among IV-D arrearage cases |
46% |
54% |
Px M-64 |
|
3.1e Increase the cost-effectiveness ratio (total dollars collected per $1 of expenditures). |
$5.00 |
$3.92 |
Px M-65 |
|
| |||
|
Child Welfare |
|
|
|
|
7.1a Decrease the percentage of children with substantiated reports of maltreatment who have a repeated substantiated report of maltreatment within 12 months. |
21% |
11% |
Px M-104 |
|
7.1f Increase the number of adoptions |
24,000 |
46,000 |
Px M-105 |
|
7.1g Increase the number of guardianships |
6,300 |
5,015 |
Px M-105 |
|
7.1h Decrease the median length of time in foster care until adoption |
38 mos |
42 mos |
Px M-106 |
|
7.1i Decrease the adoption time difference between white and African-American children |
9 mos |
19 mos |
Px M-106 |
|
7.1j Decrease the adoption time difference between white and Hispanic children |
4 mos |
5 mos |
Px M-106 |
|
7.1k Increase adoptions by relatives |
15%% |
14% |
Px M-106 |
|
7.1l Increase guardianships by relatives |
70% |
57% |
Px M-106 |
|
7.1m Decrease the mean number of placement settings per episode |
2.0 |
3.0 |
Px M-106 |
|
| |||
|
Family Violence | |||
|
8.2a Increase the number of Federally recognized Indian Tribes that have family violence prevention programs |
162 |
174 |
Px M-144 |
|
| |||
|
Native Americans | |||
|
8.4a Increase the number of grants that include elder participation |
44 |
55 |
Px M-158 |
|
8.4b Maintain the number of TA visits per year to diverse Native American population with emphasis on urban Native organizations, rural & non-Federally recognized Tribes |
1,400 |
1,450 |
Px M-158 |
A.5 Status of FY 2000 Data and Detailed Changes between the
Final FY 2001 Plan
and the Revised Final FY 2001 Plan
|
Status of FY 2000 Data and FY 2001 Measures Includes changes, status of developmental measures and availability of data for FY 2000 Performance Report. Measures are not listed if they remain as they were presented in the Final FY 2001 Annual Performance Plans (APP). |
|
1. Increase employment |
|
TEMPORARY ASSISTANCE FOR NEEDY FAMILIES |
|
Results will be available for measures 1.1a-b in August 2001 and 1.1c-e December 2001 for FY 2000 Performance Report: States are being given up to 11 months to provide data for each quarter. Time will also be needed for validation and verification of the data. Measure 1.1d has been revised to "in the next two consecutive quarters" to agree with the revised rule for the HPB. |
|
DEVELOPMENTAL DISABILITIES (EMPLOYMENT) |
|
Three FY 2001 targets for measures 1.2a-c were decreased from the Final FY 2001 Plan based on FY 1999 and 2000 performance. The baseline for measure 1.2a was revised from FY 1999 to FY 2000 due to changes in data reporting by States. |
|
REFUGEE RESETTLEMENT |
|
Results will be available for FY 2000 Performance Report in April/May 2001: Annual, unduplicated FY 2000 data is due 45 days after end of year, circa November 15. Because individual State reports may be missing and time needed to validate and verify the data, final State data will be available in April 2001; final MG data in May 2001. Measure 1.3c performance for FY 1998 was corrected from 16,078 to 16,978. |
|
SOCIAL SERVICES BLOCK GRANT |
|
Results will be available for FY 2000 Performance Report in May 2002. Changes in Measures from the Final FY 2001 Plan: Targets were increased to be consistent with achievements in FY 1998. |
|
2. Increase independent living |
|
DEVELOPMENTAL DISABILITIES (HOUSING) |
|
FY 2001 target 2.1a has been increased based on FY 2000 performance. The baseline for measure 2.1a was revised from FY 1999 to FY 2000 due to changes in data reporting by States. |
|
INDIVIDUAL DEVELOPMENT ACCOUNTS |
|
Status of measures: Measures to be developed. Results are not available for FY 2000 Performance Report. Demonstration grants funded in FY 1999 will operate for 3-5 years. |
|
3. Increase parental responsibility |
|
CHILD SUPPORT ENFORCEMENT |
|
Status of measures: Increase was changed to maintain to be consistent with projected target for measure 3.1d. New baselines were established for all measures using Final FY 1999 data available as of December 2000. . Measures 3.1b-c and 3.1e were decreased and measures 3.1a and 3.1d were increased for FY 2001 targets based on performance in FY 1999. Results will be available for FY 2000 Performance Report in October 2001. |
|
4. Increase affordable child care |
|
CHILD CARE: AFFORDABILITY |
|
Results will be available for FY 2000 Performance Report in May 2001. Most of the data for these measures are from State reports, which are not due until the end of CY 2000. Performance data will be available by April 30, 2001. The target for measure 4.1a was decreased and measure 4.1b was increased based on performance in FY 1999. Language in measure 4.1c was revised from "maintain" to "reduce and maintain" to be consistent with target projection. |
|
5. Increase quality of child care to promote childhood development |
|
CHILD CARE: QUALITY |
|
See CHILD CARE: AFFORDABILITY above. Measures 5.1a and 5.1b are based on calendar year totals. Measure 5.1a has been changed to measure the number of regulated child care centers and homes that are accredited; ACF does not have an accurate count of the total number of facilities or accreditation tally. |
|
HEAD START (CHILD DEVELOPMENT) |
|
Results for the performance report for FY 1999 and 2000 for measures 5.2a-f and 5.2i represent a combined cohort. The seven measures that FACES provides cover a two-year period for each cohort. The word "scale" has been inserted to clarify the measurement. |
|
6. Improve the health status of children |
|
HEAD START (HEALTH) |
|
No changes. |
|
7. Increase safety, permanency, well-being of children and youth |
|
CHILD WELFARE |
|
Status of measures: The baseline year is CY 1998 for measure 7.1b and FY 1998 for the remaining measures. The data for AFCARS strengthened significantly in FY 1998 when financial penalties began to be imposed on States for failure to report and failure to report data, which meets certain quality standards. Therefore, data from that year is being used as the baseline. The baselines for measures that use/used other data sources were changed to FY 1998 so that measures would be consistent. Status of work with partners: Extensive consultations with partners were undertaken and have brought about a number of changes in the FY 2002 measures. A detailed description of this process can be found in Child Welfare Section. Final results will be available for FY 2000 Performance Report: Final FY 2000 data for most measures will be available June 2001; the delay is due to workload created by the Child and Family Services Reviews and the Annual Report. Measure 7.1b and 7.1f will be available September 2001 and measure 7.1a will be available October 2002 The following measures have been dropped: measures 7.1a, 7.1h, 7.1i, 7.1j, 7.1k, and 7.1m. The following measures were added: measures 7.1b and 7.1n. The explanation for these changes can be found in Child Welfare Section entitled Performance Measures for FY 2002 and Final Measures for FY 2001. |
|
DEVELOPMENTAL DISABILITIES (EDUCATION) |
|
FY 2001 target was increased based on FY 1999 performance. |
|
DEVELOPMENTAL DISABILITIES (HEALTH) |
|
No changes. |
|
YOUTH PROGRAMS |
|
New "youth development outcome domains" logic model: "Program goals" in the FY 2001 APP have been revised, replaced, and supplemented by a new logic model structure organized by outcome domains based on research in positive youth development. Some of the outcome domains are paired or overlap. Each domain (e.g., "Safe and Stable Living Situations") includes an outcome statement relating the domain to RHY program specifics (e.g., "Runaway and homeless youth find safety, shelter and services that support their well-being and development into adults.") Revised program goals (e.g., "Provide appropriate shelter, counseling, and other support services to youth and their families in high-risk situations") flow from each outcome domain. Status of measurable performance goals from FY 2001 APP (explanations of changes are in the main Youth Program chapter): Measure 7.4i: phrase "add a tenth State" is modified to "add additional States as resources become available." Measures 7.4j, 7.4k and 7.4l are discontinued after FY 2001 results are reported, if these are available post RHYMIS-LITE. Progress in streamlining RHYMIS into RHYMIS-LITE will impact the selection, dating and modification of baselines. Final results for FY 2000 will be complete in June 2001 due to the transition from a less reliable (RHYMIS) to a more reliable (RHYMIS-LITE) data source, FY 2000 data and possibly much of FY 2001 data may be subject to implementation and start-up anomalies. |
|
8. Build healthy, safe & supportive communities and Tribes |
|
COMMUNITY SERVICES |
|
Final results will be available for FY 2000 Performance Report in July 2002 due to are lags in collecting data in a block grant program. FY 2001 targets for measure 8.1a was decreased and 8.1b was increased based on FY 1998 performance. |
|
FAMILY VIOLENCE PREVENTION |
|
Measure 8.2b was increased from 10,000 to 11,000 based on FY 2000 performance. |
|
LOW INCOME HOME ENERGY ASSISTANCE (LIHEAP) |
|
The words "or who is disabled" has been dropped from measure 8.3a. |
|
NATIVE AMERICANS PROGRAMS |
|
Results will be available for FY 2000 Performance Report in September 2001. FY 1997 total for measure 8.4b was corrected. |
|
A RESULTS-ORIENTED ORGANIZATION |
|
9. Develop and retain a highly skilled, strongly motivated staff |
|
Final results will be available for FY 2000 Performance Report in June 2001. FY 2001 target of increasing manager to staff ratio has been dropped and replaced with a more meaningful measure related to ACF's need to maintain, retain and train staff to carry out its mission in the 21st Century. |
|
10. Improve automated data and management systems |
|
Final results will be available for FY 2000 Performance Report in June 2001. The FY 2001 target has been changed to more accurate language: "develop and implement GATES II, which will capture and validate grant information submitted by grantees using the Web" |
A.6 Performance Measurement Linkages
Information technology planning: During the past fiscal year, ACF has actively utilized the ACF Information Technology Review Board (ITRB) in accordance with requirements contained in the Clinger-Cohen Act (also known as the Information Technology Management Reform Act (ITMRA). The overall purpose of the ACF ITRB is (1) to monitor the performance of selected ongoing major ACF information technology investments or to consider proposed new major investments and (2) to convene for matters that concern ACF IT policies and issues. In accordance with Clinger-Cohen, the ACF ITRB completed or is in the process of implementing ten priority Investment Technology policies:
In addition, ACF continues to monitor the following IT investments:
Cost accounting: Beginning in FY 1998, all government reporting entities were required to implement, and be audited on, full cost accounting (also known as managerial cost accounting) as part of the annual financial statements audit process. Beginning with the FY 1998 audit process, ACF was required to present all costs directly associated with a program, as well as all costs indirectly supporting that program. Based on Federal law and OMB guidance, the programs against which these costs had to be reported were ACF's major program areas as identified in the GPRA Annual Performance Plan.
To implement a credible and auditable method to fulfill the full cost accounting requirements for the FY 1999 audit, ACF allocated its Federal Administration budget indirect costs proportionately among the major program areas on the basis of direct FTE. (Indirect costs include salaries and benefits for staff not working directly on one of the fourteen program activities; costs of training, personnel, budget, travel, systems, facilities, supplies, and rent.) To accomplish this, ACF senior staff in headquarters and the regions completed a Staff Resource Survey providing the total number of staff working directly on program activities in one or more of the major program areas; and the total number of staff not working directly on program activities. Staff in this category included planning, administrative, and front office staff.
Fractions of staff were indicated for those working in more than one major program area. Contractors and detailees out of an organization were excluded from a manager's count while detailees into an organization from another office were included.
Where an organization encompassed one entire major program area, e.g., Developmental Disabilities, Child Support, Native Americans Program, only the total number of on-board staff for that organization were indicated. Staff offices that provided crosscutting activities reported on-board staff as "Other staff not working directly on program activities." Offices where program distinctions could be made (e.g., ACYF, OCS) reported on both items.
Completed survey data were collated and analyzed in an automated spreadsheet and provided to the HHS Program Service Center (PSC) to allocate the indirect costs in proportion to the resulting direct staff ratio. This data supported PSC's development of ACF's Statement of Net Cost. ACF managers were advised to retain documentation that explains how they arrived at their numbers in the event that auditors requested to review this process.
Our cost accounting strategy was accepted by the auditing firm (Clifton Gunderson), PSC, ASMB and the OIG. Other OPDIVs also requested copies of our methodology and survey instrument. ACF is using the same strategy for FY 2002 with the addition of one program area, Individual Development Accounts.
Program evaluation: While States have been given increasing latitude in administering programs, they depend on national leadership and partnership in developing reliable information, technical assistance, and the development and dissemination of proven or promising methods for achieving and measuring success. Extant research and early results of major studies underway helped shape significant changes in Federal and State policy and legislation affecting low-income families and children.
The effects of these programmatic changes and increase in State flexibility are not fully understood. For example, the TANF legislation limits the duration of eligibility for public assistance, the percentage of the caseload who may be excluded from work requirements, and the conditions for teen parent assistance for which States may expect Federal support. The statute also allows States wide discretion in designing services to meet these and other provisions. Effective State decision-making requires timely and reliable information on the consequences of alternative policy and program choices and the experiences of other States. As policy and program design devolves to States and localities, it is vital that these levels of government have reliable information for decision-making and that the effects of different policy and program choices on quality and accessibility are understood. Documenting, understanding, interpreting and facilitating the exchange of information and experiences among States is essential to providing high quality services to promote the well being of families and children.
As ACF continues to focus on results-oriented management, evaluations play an increasingly important role in program improvement. Program evaluations are directed at evaluating effectiveness, assessing the achievement of performance results, assessing the impacts of human services, and improving program management. While program evaluations are largely directed at assessing the effectiveness of individual projects within a program, the ACF performance measurement system is the primary mechanism used to monitor annual progress in achieving ACF's strategic and performance goals.
Specific Examples of Ongoing Evaluations that Support Major Goals in ACF Performance Plan
Goal One: Improve the economic independence and productivity for families: Data from a variety of national, State and program-specific sources provided valuable insights and information for developing strategies, measures and targets for Goal One and attendant strategies. For example, the national evaluation of welfare-to-work strategies produced valuable information on the effectiveness of the JOBS program in seven sites and provided the basis for many reforms in the Personal Responsibility and Work Opportunity Reconciliation Act of 1996 (PRWORA).
A number of implementation strategies support Goal One objectives and focus on identifying best practices and effective program practices and disseminating these to other service providers through Federal technical assistance and capacity-building activities. Evaluations of these efforts point to the success of many of these strategies. For example, there is substantial evidence that many welfare-to-work experiments have been adopted by States. Many elements of successful demonstrations were adopted in the welfare reform provisions of TANF. Additionally, ACF is funding research to provide more information on the role of fathers in strengthening family formation and functioning to identify and eliminate barriers that impede involvement with their children.
Goal 2: Improve Healthy Development, Safety and Well Being of Children and Youth: Evaluations demonstrate the success of working through programs, such as Head Start and Child Care, to link children to health care, e.g. Descriptive Study of Head Start Health Services (a 1996 study of a representative sample of 1200 children in 40 Head Start programs) and current Head Start Program Information Report data and Child Care State plans. A study issued in October 1999, Access to Child Care for Low-Income Working Families, examined the availability of child care subsidies to eligible families and a NICHD Study of early child care examined the outcomes of children attending centers that meet professional standards. The Family and Child Experiences Survey, a longitudinal study of a nationally representative sample, provides valuable data on child performance in areas of cognitive and social skills indicating readiness to learn more in kindergarten. Research and evaluation studies of child care services assist in promoting effective practices and provide a better understanding of child care supply, demand, unmet need, quality and cost for those transitioning from welfare to work.
Additionally, State and program administrative data are particularly useful in assessing trends and establishing targets for child welfare, abuse and neglect, early learning (Head Start) and child care. The Department's third annual report, America's Children: Key National Indicators of Well-being, provided a secondary source of trend data for these objectives. Recent evaluative data indicates substantial increases in adoptions in FY 1997 and FY 1998, indicating the success of these strategies. Also, GAO recently found that the use of adoption incentives increases the likelihood of adoption of older and minority children and is cost effective (GAO/HEHS-97-73).
Future Evaluations that will inform performance measures:
|
Objective |
Subject |
Methodology |
End Date |
Agency |
|
1.1 Increase Employment |
Evaluation of Employment Retention and Advancement strategies; impact of welfare reform on child outcome measures; rural welfare to work strategies; effectively serving special populations |
Impact Analyses (experimental or non-experimental design) |
Variable (late 2000-2005) |
ACF/OPRE |
|
3.1 Increase Parental Responsibility |
Evaluation of the role of both parents in providing financial and emotional support to their children |
|
|
ACF/OCSE |
|
4.1 Increase affordable child care |
Evaluations of changing dynamics of the child care system in the larger framework of welfare reform |
|
|
ACF/OPRE/CCB |
|
5.1 Healthy Development and Learning Readiness of Children |
Continuation of "A National Study of Child Care for Low-Income Families" |
Surveys, Site Visits |
2002 |
ACF/OPRE/CCB |
|
5.2 Head Start |
Continuation of the Family and Child Experiences Survey (FACES) to provide outcome-based information on the social and cognitive progress of Head Start Children |
Interviews, Observations, Assessments & Surveys |
Every 3 years; Each cohort followed through kindergarten |
ACF/HSB |
|
7.1 Safety, Permanency and Well- Being of Children and Youth |
Continuation of national longitudinal study of child welfare; complimentary studies concerning structural decision making and effectiveness of services provided for families and children |
Surveys, interviews |
On-going in 3-5 year cycles |
ACF/OPRE/CB |
|
7.1 |
Systematic review of child welfare outcomes in areas of safety, permanency and child and family well-being |
Monitoring, state RO-CO partnership monitoring visits, previsit statewide assessments, analysis and use of existing data from NCANDS and AFCARS |
On-going |
ACF/CB |
|
7.1 |
Evaluation technical assistance to grantees to improve local evaluations and encourage cross-site cooperation and consensus on data elements |
Contracts |
Second phase 10/1/00 to 9/29/02 |
ACF/CB |
|
7.1 |
Evaluation of the impact of family preservation and support services |
Contracts (surveys, site visits, research and evaluation) |
Date-phased |
ACF/CB, CORE, OPRE, ASPE |
Linkage with budget: ACF has identified eight program objectives to provide a framework for individual programs and program activities to collaborate and direct their efforts to achieve ACF-wide cross-cutting program goals. This approach enables ACF partners in State, Tribal, and local governments and nonprofit and private agencies to use the various program resources within ACF to provide early childhood enrichment, and to increase the economic and social well-being and productivity of families. ACF does not have a direct relationship with beneficiaries and in many cases has a tertiary relationship through States and State grantees.
The following Program & Financing (P&F) schedules have been aggregated:
The following activities within the Children and Families Services Programs P&F schedule have been aggregated:
The following activities within a P&F schedule are free-standing:
The following have been consolidated combining activities from more than one P&F schedule:
Cross walk of ACF goals and objectives with the budget:
The budget structure is a program-based account structure that allows ACF to assign amounts to the agency's strategic goals based on the activities of the program line-item. In the budget justifications, the budget narrative is consistent with the goals and objectives in the performance plan. It discusses which strategic goal(s) each budget line-item supports and includes selected performance measures in the narratives. A number of budget line items and their associated funds apply to more than one strategic goal or objective. In the table that follows, these line items have been listed under each relevant objective with selected measures.
To avoid duplicative counting, the dollar amounts are only associated with one appearance of their line item, usually where the associated measures most directly relate to the statutory purpose of the particular funding amount (except for Social Services Research, which has been distributed in a rough approximation of its allocation). In their appearances elsewhere, the dollar amounts are left blank and indicated with an asterisk. This table is for presentation and overview purposes, not for budgeting or performance analysis. The selected measures are representative and not intended to fully define the performance associated with the total budget under that category. Allocation of funding subtotals for each specific measure or performance goal within the objectives is not realistic. In the case of "parental responsibility" (child support enforcement), dollars collected have been substituted for collection rate (the measurement dimension for the corresponding APP target) to provide uniformity to the table. A column has been added which identifies the budget program account number. Budget and other dollar figures are in millions. The budget linkage table on the following pages is not a formal budget presentation.
(not for budget analysis)
(dollars in millions)
|
GPRA ACF STRATEGIC GOALS and Objectives With selected performance measures (Program Activity) |
Program/Budget Line Items
|
Budget Program Account No. |
FY 2000
|
FY 2001 |
FY 2002 | |
|
I. INCREASE ECONOMIC INDEPENDENCE & PRODUCTIVITY FOR FAMILIES (1.1-4.1) |
Strengthening Fatherhood |
0 |
0 |
60.0 | ||
|
Projects of National Significance |
0 |
0 |
4.0 | |||
|
1. Increase Employment |
Subtotal |
0.0 |
0.0 |
64.0 | ||
|
TANF performance measure
(1.1) By FY 00, increase the % of adult TANF recipients who become newly employed . By FY 01, increase the % of adult TANF recipients who become newly employed . By FY 02, increase the % of adult TANF recipients who become newly employed. |
State Family Assistance Grants (TANF) |
1552 |
16488.7 |
16488.7 |
16488.7 | |
|
State Penalties |
1552 |
0 |
0 |
(10.0) | ||
|
Family Assistance Grants to Territories |
1552 |
77.9 |
77.9 |
77.9 | ||
|
Matching Grants to Territories |
1552 |
15.0 |
15.0 |
15.0 | ||
|
Supp Grants for Population Increases |
1552 |
*** |
*** |
*** | ||
|
Tribal Work Programs |
1552 |
7.6 |
7.6 |
7.6 | ||
|
Social Services Research |
1536 |
3.5 |
11.4 |
3.6 | ||
|
State and Local Welfare Administration |
1501 |
16.7 |
1.0 |
0 | ||
|
TANF Bonus for Decreased Illegitimacy |
1552 |
100.0 |
100.0 |
100.0 | ||
|
TANF High Performance Bonus Reward |
1552 |
*** |
*** |
*** | ||
|
Emergency Assistance |
1501 |
94.0 |
37.0 |
0 | ||
|
Welfare Research |
1536 |
15.0 |
15.0 |
15.0 | ||
|
TANF/welfare subtotal: |
16818.4 |
16753.6 |
16697.8 | |||
|
Refugee Performance Measure (1.4) Increase the number of refugees entering employment from ORR-funded employment related services by 5% annually. (Baseline: In 1997, there were 46,800 refugees entering employment.) FY 00 target: 54,176; FY 01 target: 56,885; FY 02 target: 59,730 |
Transitional, Med Svcs - Refugee Resettlement |
1503 |
220.7 |
225.2 |
227.3 | |
|
Employment Services - Refugee Resettlement |
1503 |
143.9 |
143.6 |
143.6 | ||
|
Targeted Assistance – Refugee Resettlement |
1503 |
49.5 |
49.5 |
495 | ||
|
Preventive Health – Refugees |
1503 |
4.8 |
4.8 |
4.8 | ||
|
Victims of Torture |
1503 |
7.3 |
10.0 |
10.0 | ||
|
Victims of Trafficking |
0 |
5.0 |
10.0 | |||
|
Repatriation |
1501 |
.8 |
1.0 |
1.0 | ||
|
Refugee subtotal: |
427.0 |
434.1 |
446.2 | |||
|
SSBG (1.5). Maintain at the FY 1998 baseline the number of child recipients of daycare services that are funded in whole or in part by SSBG funds FY 01 and FY 02 targets: 2,399,827 children |
Social Services Block Grant |
1534 |
1775.0 |
1725.0 |
1700.0 | |
|
Social Services Block Grant subtotal |
1775.0 |
1725.0 |
1700.0 | |||
|
Developmental Disabilities (DD) State Grants* |
1536 |
* |
* |
* | ||
|
Total funding per objective |
19020.4 |
18912.7 |
18908.0 | |||
|
2. Increase Independent Living |
DD – State Grants |
1536 |
65.7 |
67.8 |
67.8 | |
|
Developmental disabilities performance measure (2.1-2.2) FY 00: 2132 people with DD own or rent their homes FY 01: 36,000 people with DD own or rent their homes FY 02: 37,000 of people with DD owning or renting their own homes |
Social Services Research |
1536 |
0.3 |
0.2 |
0.2 | |
|
DD – Protection and Advocacy * |
1536 |
28.1 |
33.0 |
33.0 | ||
|
DD – University Affiliated Projects |
1536 |
18.2 |
21.8 |
21.8 | ||
|
DD – Special Projects |
1536 |
10.2 |
10.9 |
10.7 | ||
|
DD Subtotal |
122.2 |
133.5 |
133.3 | |||
|
Individual Development Accounts |
1536 |
10.0 |
25.0 |
25.0 | ||
|
Total funding per objective |
132.5 |
158.7 |
158.5 | |||
|
3. Increase Parental Responsibility | ||||||
|
Child support enforcement performance measure (3.1) FY 00: Increase the IV-D collection rate for current support to 71% FY 01: Increase collection rate for current support from the FY 99 baseline of 52% to 54%. FY 02: Increase the IV-D collection rate for current support to 55%. |
Federal Incentive Payments - Child Support |
1501 |
396.0 |
416.0 |
450.0 | |
|
State Administrative Costs - Child Support |
1501 |
2806.5 |
3247.8 |
3413.8 | ||
|
Federal Parent Locator Service |
1552 |
26.0 |
26.5 |
27.0 | ||
|
Access and Visitation - Child Support |
1501 |
10.0 |
10.0 |
10.0 | ||
|
CSE Hold Harmless |
1501 |
10.2 |
10.0 |
10.0 | ||
|
Payments to Territories |
1501 |
19.1 |
23.0 |
23.0 | ||
|
Social Services Research |
1536 |
0 |
1.0 |
1.0 | ||
|
Total funding per objective |
3267.8 |
3734.3 |
3934.8 | |||
|
4. Increase Affordable Child Care | ||||||
|
Child care affordability performance measure (4.1) FY 01: Increase the percentage of potentially eligible children who receive CCDF subsidies from the FY 1998 baseline of 10% to 12.5%. FY 02: Increase the percentage of eligible children… to 13% |
Child Care and Development Block Grant |
1515 |
1172.7 |
1990.0 |
1790.0 | |
|
Social Services Research |
1536 |
.5 |
.9 |
.5 | ||
|
Child Care Mandatory |
1550 |
1177.5 |
1177.5 |
1177.5 | ||
|
Child Care Matching |
1550 |
1136.2 |
1331.7 |
1478.3 | ||
|
Tribal Mandatory |
1550 |
47.3 |
51.3 |
54.3 | ||
|
AFDC/JOBS Child Care |
1501 |
1.0 |
2.0 |
0 | ||
|
After School Certificates |
0 |
0 |
400.0 | |||
|
Research and Evaluation Fund |
1536 |
10.0 |
10.0 |
10.0 | ||
|
Training & Tech. Assist.-CC Entitlement |
1550 |
5.9 |
6.4 |
6.8 | ||
|
Early Learning Fund |
1536 |
0 |
20.0 |
0 | ||
|
Total funding per objective |
3551.1 |
4589.8 |
4917.4 | |||
|
II. IMPROVE HEALTHY DEVELOPMENT, SAFETY & WELL-BEING OF CHILDREN & YOUTH(5-7) |
||||||
|
Head Start |
1536 |
3866.2 |
6199.8 |
6324.8 | ||
|
5. Increase the Quality of Child Care to Promote Early Childhood Development |
(1400.0) |
|||||
|
Head Start subtotal |
3866.2 |
6199.8 |
6324.8 | |||
|
Child care quality performance measure (5.1-5.2) FY 00: Increase by 1% the number of child care facilities that are accredited by a nationally recognized early childhood development professional Organization. FY 01: Increase by an additional 1% the number of child care facilities… FY 02: Increase by an additional 1%, the number of child care facilities… |
Child Care and Development Block Grant* |
1515 |
* |
* |
* | |
|
Child Care Entitlement* |
1550 |
* |
* |
* | ||
|
Research and Evaluation Fund |
1536 |
* |
* |
* | ||
|
Child Care Matching* |
1550 |
* |
* |
* | ||
|
Training & Tech. Assist.-CC Entitlement |
1550 |
* |
* |
* | ||
|
Social Service Research |
1536 |
1.5 |
2.5 |
1.5 | ||
|
Total funding per objective |
3867.7 |
6202.3 |
6326.3 | |||
|
6. Improve the Health Status of Children | ||||||
|
Head Start (Health) performance measure (6.1) FY 00: 90% Head Start children receive needed med treatment. FY 01: 92% Head Start children receive needed med treatment. FY 02: 94% Head Start children receive needed med treatment. |
||||||
|
Head Start |
1536 |
* |
* |
* | ||
|
Total funding per objective |
* |
* |
* | |||
|
7. Increase Safety & Well-Being of Children & Youth | ||||||
|
Child welfare performance measure (7.1) FY 00: 46,000 children are adopted from the public foster care system. (Baseline: 1996: 28,000) FY 01: 51,000 children are adopted from the public foster care system FY 02: 56,000 children are adopted from the public foster care system . . |
Adoption Assistance |
1545 |
1020.1 |
1197.6 |
1426.0 | |
|
Child Welfare Services |
1536 |
292.0 |
292.0 |
292.0 | ||
|
Promoting Safe and Stable Families |
1512 |
295.0 |
305.0 |
505.0 | ||
|
Mentoring Children of Prisoners |
1512 |
0 |
0 |
67.0 | ||
|
Foster Care |
1545 |
4537.2 |
5063.5 |
5055.0 | ||
|
Child Welfare Tribal Initiative |
1545 |
0 |
0 |
0 | ||
|
Child Welfare Training |
1536 |
7.0 |
7.0 |
7.0 | ||
|
Child Welfare Longitudinal Study |
1553 |
6.0 |
6.0 |
6.0 | ||
|
Training/Tech Assistance - CRTA |
1553 |
13.0 |
13.2 |
14.0 | ||
|
Adoption Opportunities |
1536 |
27.4 |
27.4 |
27.4 | ||
|
Adoption Incentives |
1536 |
41.8 |
43.0 |
43.0 | ||
|
Child Abuse State Grants |
1536 |
21.0 |
21.0 |
21.0 | ||
|
Abandoned Infants |
1536 |
12.2 |
12.2 |
12.2 | ||
|
Community-Based Resource Centers |
1536 |
32.8 |
32.8 |
32.8 | ||
|
Child Abuse Discretionary |
1536 |
18.0 |
33.7 |
18.0 | ||
|
Independent Living/Foster Care/Adoptions |
1545 |
140.0 |
140.0 |
200.0 | ||
|
Child Welfare subtotal |
6463.4 |
7194.4 |
7726.4 | |||
|
Youth performance measure (7.4) FY 00: Maintain at 95% the proportion of youth living in safe and appropriate settings after receiving ACF-funded services. (Baseline: 1997 data equals 82%) FY 01: Increase to 96% the proportion of youth.... FY 02: Maintain at 96% the proportion of youth.... |
Runaway and Homeless Youth (RHY) |
1536 |
43.7 |
69.1 |
69.1 | |
|
Transitional Living: Homeless Youth |
1536 |
20.5 |
0 |
0 | ||
|
Maternity Group Homes |
1536 |
0 |
0 |
33.0 | ||
|
Ed/Prevention: RHY Sexual Abuse |
1536 |
15.0 |
15.0 |
15.0 | ||
|
Youth Programs subtotal |
79.2 |
84.1 |
117.1 | |||
|
Family Violence* |
8605 |
* |
* |
* | ||
|
Developmental Disabilities - State Grants* |
1536 |
* |
* |
* | ||
|
Developmental Disabilities -P&A* |
1536 |
* |
* |
* | ||
|
Social Services Research |
1536 |
0.2 |
0.1 |
0.1 | ||
|
Total funding per objective |
6542.8 |
7278.6 |
7843.6 | |||
|
III. INCREASE HEALTH & PROSPERITY OF COMMUNITIES AND TRIBES (8) |
Compassion Capital Fund |
0 |
0 |
89.0 | ||
|
8. Build Healthy, Safe & Supportive Communities & Tribes |
Subtotal |
0 |
0 |
89.0 | ||
|
CSBG performance measure (8.1) FY 00: $1.38 billion in non-federal funds brought into low-income communities (1% increase over previous year) FY 01: $1.39 billion in non-federal funds brought into low-income communities (1% increase over previous year). FY 02: $1.40 billion in non-federal funds brought into low-income communities (1% increase over previous year). |
||||||
|
Community Services Block Grant |
1536 |
527.6 |
600.0 |
600.0 | ||
|
National Youth Sports Program |
1536 |
15.0 |
16.0 |
0 | ||
|
Community Food and Nutrition |
1536 |
6.3 |
6.3 |
0 | ||
|
Community Services Discretionary |
1536 |
35.4 |
35.4 |
30.5 | ||
|
Community Services Subtotal |
584.3 |
657.7 |
630.5 | |||
|
Domestic Violence performance measure (8.2) FY 00: Increase the number of Federally recognized Indian Tribes that have family violence prevention Programs to 174. FY 01: Increase to 189 the number of Federally recognized Tribes… FY 02 Increase to 205 the number of Federally recognized Tribes … |
||||||
|
Social Services Research |
1536 |
0.5 |
0 |
0 | ||
|
Family Violence Prevention |
8605 |
101.1 |
116.9 |
116.9 | ||
|
Domestic Violence Hotline |
8605 |
1.9 |
2.2 |
2.2 | ||
|
DD – Protection and Advocacy |
1536 |
* |
* |
* | ||
|
Domestic Violence Subtotal |
103.5 |
119.1 |
119.1 | |||
|
LIHEAP performance measure (8.3) |
||||||
|
FY 00: 75% of grantees have set a goal for the participation rate of eligible households with at least one member age 5 years or under. FY 01: 75% of grantees have set a goal for the participation rate of eligible households with at least one member age 5 years or under… FY 02: 75% of grantees that have set a goal for the participation rate of eligible households having at least one member 5 years or under are successful in meeting that goal. |
LIHEAP |
1502 |
2,000.0 |
1700.0 |
1700.0 | |
|
Social Services Research |
1536 |
0 |
0.5 |
0 | ||
|
LIHEAP subtotal |
2000.0 |
1700.5 |
1700.0 | |||
|
Native American performance measure (8.4) |
||||||
|
FY 00: Increase from the current level of 1400 visits to 1450 the number of site visits by Tribal contractors to the diverse Native American population w/particular emphasis on urban Native organizations, rural, and non-Federally recognizedTribes. FY 01: Increase to 1500 site visits … FY 02: Maintain at the current level of 1500 site visits … |
Native Americans Programs |
1536 |
35.4 |
46.0 |
44.4 | |
|
Native Americans subtotal |
35.4 |
46.0 |
44.4 | |||
|
Total funding per objective |
2723.2 |
2523.3 |
2583.0 | |||
|
IV. BUILD A RESULTS-ORIENTED ORGANIZATION (9-10) |
||||||
|
9. Streamline ACF Organizational Layers |
Federal Administration |
1536 |
147.8 |
163.9 |
171.9 | |
|
Streamlining performance measure FY 00: Improve ACF manager-to-staff ratio to 1:8. (Baseline 1:4.6) FY 01: Each ACF staff member participate in at least one training FY 02: Each ACF staff member participate in at least one training |
Faith Based Center |
3.0 | ||||
|
10. Improve Automated Data and Management Systems |
Federal Administration * |
1536 |
* |
* |
* | |
|
Automation performance measure |
||||||
|
FY 00: Replace audit system; provide a user reports retrieval capability. FY 01: Develop and implement GATES II… FY 02: Develop and implement GATES II, which will capture and validate grant information submitted by grantees using the Web. |
||||||
|
Total funding per objectives 9 and 10 |
147.8 |
163.9 |
174.9 | |||
|
TOTAL ACF PROGRAM & ADMINISTRATIVE FUNDING:** |
39253.0 |
43563.6 |
44846.5 | |||
|
* Item with multiple citations, counted once only. ** These totals include obligation levels for Child Support Enforcement Programs rather than Budget Authority. | ||||||