WaterNews
for the week of October 1, 2002
WaterNews is a weekly on-line publication that announces publications,
policies, and activities of the U.S. Environmental Protection Agency's
Office of Water.
Inside this week's WaterNews:
Log
on to EPAs Year of Clean Water website
National
Water Monitoring Day - October 18
Deputy
Assistant Administrator will speak to State Drinking Water
Administrators
EPA
releases Water Infrastructure Gap Analysis Call for National Forum with
Stakeholders
EPA
Reports 2000 National Water Quality Inventory
Shows Little or No Change
in Nations Water Quality
See
what's new in EnviroMapper for WATER Version 2.0!
Log on to EPAs Year of Clean Water website
Log on to http://www.epa.gov/water/yearofcleanwater/
to learn what the nation is doing in honor of the Clean Water Act.
National Water Monitoring Day - October 18
Administrator Christie Whitman is encouraging everyone to participate
in local water quality monitoring activities as she announced Oct. 18 to
be recognized as the first National Water Monitoring Day.
For more information log on to www.epa.gov/water/yearofcleanwater
http://www.epa.gov/
Deputy Assistant Administrator will speak to State Drinking Water
Administrators
Office of Water Deputy Assistant Administrator Benjamin Grumbles,
speaking today at the Association of State Drinking Water Administrators
conference in Salt Lake City, Utah, discussed present and future
challenges.
For more information please visit http://www.asdwa.org/ 
EPA releases Water Infrastructure Gap Analysis Call for National Forum
with Stakeholders
During the Water Environment Federation's 75th Annual Conference in
Chicago, U.S. Environmental Protection Agency Administrator Christie
Whitman today called for a national forum early next year that will bring
together prominent experts and stakeholders so that they can have the
opportunity to discuss innovative approaches on how to best meet
infrastructure challenges. EPA today released the "Clean Water and
Drinking Water Infrastructure Gap Analysis" on the estimated funding needs
of our nation's water pipes and plants.
"This report looks at infrastructure in the broad sense -- everything
it takes to deliver clean, safe water to America's homes and businesses
and then remove and treat the waste water that results," said Whitman.
"From the simplest pipe to the most complex treatment system, we looked at
the entire picture."
Assuming no growth in revenues, the total need for clean water -- in
both capital and operations and maintenance -- exceeds $270 billion over
20 years. For drinking water, the gap approaches $265 billion for the same
period. The size of the gap can be reduced substantially if a real growth
in revenues is projected over the same period. Assuming a three percent
annual real growth in revenues, for example, the gap shrinks by nearly 90
percent on the clean water side and by about 80 percent on the drinking
water side.
"The actual gap may end up somewhere in between these numbers -- and
there are an enormous number of considerations that will go into
determining where the gap ends up. The important thing about this report
is that it enables us to engage the discussion with a better understanding
of what the dimensions of the challenge really are," Whitman said.
For fiscal year 2003, the Administration has already proposed the
largest combined request for the state drinking water and clean water
revolving loan funds in history -- $2.1 billion. Whitman said that meeting
the challenge will require the harnessing of the power of the public and
private sectors both for financing and for the development of new
technologies and innovations.
For a copy of the "Gap Analysis" log on http://www.epa.gov/owm/featinfo.htm
EPA Reports 2000 National Water Quality Inventory
Shows Little or
No Change In Nations Water Quality
EPA today released its biennial national summary of water quality,
based on water monitoring findings reported by the states, territories,
jurisdictions and Tribes in 2000 under Section 305(b) of the Clean Water
Act. The information in this report applies only to the waters that were
assessed for one or more of the uses, such as swimming, fishing, and fish
consumption, designated for them by the states.
States assessed 19% of the nation's 3.7 million total stream miles, 43%
of its 40.6 million acres of lakes, ponds and reservoirs, and 36% of its
87,300 estuary square miles for this report. EPA reports that 39% of
assessed stream miles, 45% of assessed lake acres, and 51% of assessed
estuary square miles in the nation were found to be impaired for one or
more uses.
EPA found that the percentage of assessed stream and estuary waters
found to be impaired has increased somewhat from the last report in 1998,
although that difference is more likely due to changes in assessment
approaches than actual water quality changes. Many states are choosing to
use higher quality data than in the past in making their assessments,
discarding older or less quality-assured data. They are also moving toward
more comprehensive examination of fish tissue and issuing statewide
advisories limiting the consumption of certain species of fish. Mercury,
which originates from air transport from power generating facilities and
incinerators, mining, natural rock weathering, and other sources, was
cited in approximately 2,240 of the nation's 2,800 fish consumption
advisories reported in 2000 and is reported as a leading cause of
impairment in U.S. lakes and estuaries.
Of the nearly 700,000 of assessed stream miles, 39% or
269,258 stream miles were found to be impaired for one or more uses.
Pathogens (such as fecal bacteria) and siltation were cited as leading
causes of impairment in assessed stream miles. Major sources of these and
other stressors in assessed streams include runoff from agricultural land
and hydrologic modifications such as dam building, dredging, and channel
straightening.
In the nation's 17.3 million assessed lake acres, 45%
or 7.7 million acres were found to be impaired for one or more uses.
Nutrients, metals (primarily mercury) and siltation were the top three
causes of impairment in assessed lake acres. Major sources of these and
other stressors in assessed lakes include runoff from agricultural land,
hydrologic modifications, and runoff from urban areas and storm sewer
discharges.
About 31,000 square miles of estuaries were assessed
by the states, and of these, 51%, or 15,676 square miles, were found to be
impaired for one or more uses. Metals (primarily mercury), pesticides, and
oxygen-demanding substances were reported as the top three causes of
impairment in assessed estuary square miles. Major sources of these and
other stressors in assessed estuaries include municipal sewage treatment
plants, runoff from urban areas and storm sewer discharges, and industrial
discharges.
According to G. Tracy Mehan, EPA Assistant Administrator for water,
this report points out the need for more effective controls to address the
nation's water quality problems, especially those originating from
diffuse, non-permitted sources such as runoff from agricultural and urban
areas, as well as air deposition. As in the past, these non-point sources
continue to dominate as sources of pollution. "EPA and the states need to
work together as partners to solve this problem and implement more
effective solutions," said Mehan.
EPA is working to improve identification and cleanup of impaired waters
through the Clean Water Act Section 303(d) program. This program calls for
participation of the public in the identification of impaired waters and
in the development of pollution "budgets" used to restore the health of
those waters. EPA is also developing a national monitoring strategy to
improve water quality assessment and reporting and ensure that state water
quality findings are comprehensive and comparable among states and over
time. Under the Clean Water Act, states have primary responsibility for
water quality monitoring.
This 2000 National Water Quality Inventory is the 13th in a series
published since 1975. New EPA guidance issued in November 2001 calls for
future reports to include information on impaired waters as reported by
the states under Section 303(d) of the Clean Water Act.
The National Water Quality Inventory: 2000 Report is available
on the web at http://www.epa.gov/305b/2000report/
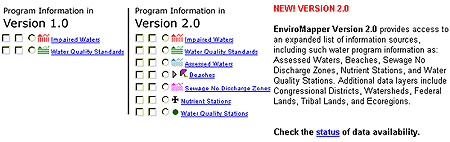
See what's new in EnviroMapper for WATER Version 2.0!
EnviroMapper Version 2.0 has a new, improved interface
and provides access to an expanded list of information sources, including
water program information (Assessed Waters, Beaches, Sewage No Discharge
Zones, Nutrient Stations, and Water Quality Stations). Additional data
layers has been include. The data layers are, Congressional Districts,
Watersheds, Federal Lands, Tribal Lands, and Ecoregions. For more
information, please visit http://www.epa.gov/waters/enviromapper/v2new.html.
WaterNews
Home
|