|
| To gain a better understanding of the funding
challenge facing the clean water and drinking water
industries, the Environmental Protection Agency conducted a
study to identify whether there is a quantifiable "gap"
between current levels of spending and projected water
investment needs over the 20 year period from 2000 to 2019.
|
| The General Accounting Office also released a
recent report on Water Infrastructure: Information on
Financing, Capital Planning, and Privatization. Both reports
were requested by Congress to help with planning federal
funding for water. |
| EPA's Clean Water and Drinking Water
Infrastructure Gap Analysis found that a significant funding
gap could develop if the nation's utilities maintain current
spending and operations practices. |
|
The Gap Analysis presents the projected funding gap over
the 20–year period in two ways: a "no revenue growth" scenario
that compares the projected need to current spending levels;
and a "revenue growth" scenario that assumes spending will
increase by 3 percent per year. This annual increase
represents a real rate of growth of 3 percent over and above
the rate of inflation — a projection which is consistent with
long-term growth estimates of the economy, according to EPA.
|
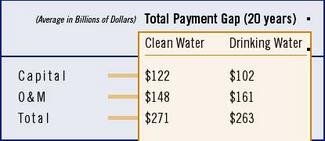
| Under the "no revenue growth" scenario, the
analysis estimates a total capital payments gap of $122
billion, or about $6 billion per year, for clean water and
$102 billion, or about $5 billion per year, for drinking
water. The O&M gap is estimated at $148 billion, or $7
billion per year, for clean water and $161 billion, or $8
billion per year, for drinking water. |
| Under the "revenue growth" scenario, the capital
gap is $21 billion, or about $1 billion per year for clean
water and $45 billion, or about $2 billion per year, for
drinking water. The O&M gap is estimated at $10 billion,
or $0.5 billion per year, for clean water, while no O&M
funding gap would occur for drinking water. |
| Each of these numbers represents an average
within a range of estimates. Under the assumptions used to
calculate the funding gaps, some of the models predict that
total spending will exceed the total need over the next 20
years. |
| In broad terms, the gap analysis concludes that
clean water and drinking water systems will need to use some
combination of increased spending and innovative management
practices to meet projected needs. |
| EPA acknowledged that its study understates
future spending and ignores other measures, such as asset
management processes or capacity development, that systems
could adopt to reduce both capital and O&M costs. |
| In reality, increasing needs will likely prompt
increased spending, EPA said. However, the analysis presents
an approximate indication of the funding gap that will result
if the nation's utilities ignore the challenge posed by an
aging infrastructure network. |
| |
| In developing its Gap Analysis, EPA noted that
further research would help better quantify the infrastructure
gap. For example: |
• A better inventory of the nation's clean water
and drinking water capital stock and its condition is needed.
That includes developing an improved picture of the remaining
life of capital assets such as treatment plants, piping
networks and storage systems. Such information would greatly
improve decision-making about investment needs for
maintaining, upgrading, and expanding infrastructure.
• The
relationship between O&M needs and capital stock is not
fully understood. A more refined approach than the one adopted
in the Gap Report would investigate how O&M needs vary as
a function of gross (not net) capital stock and the age or
condition of the capital stock. These data, other than in
purely speculative form, are not yet available.
• Clean
water and drinking water systems will incur significant costs
over the next 20 years as they expand capacity to serve
current and future growth. Methods for estimating capital
investment needs associated with growth and changes in service
standards were excluded from the analysis. |
|
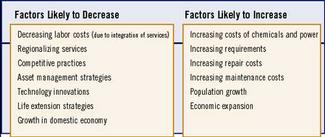
| A Qulitative Assesment of the
Sensitivity of the Gap Estimate |
According to EPA, its analysis would benefit from research
into an array of issues that ultimately will determine, or at
least influence, the scale of future capital investment needs.
These issues will also determine how future capital investment
needs are met. More research is needed on a variety of topics.
For example: |
• How implementation of best management
practices, including asset management and capacity
development, would benefit the funding gap.
•
Restructuring, integrating, and combining water and wastewater
utilities to generate better economies of scale.
• Pricing
policies and their effect on demand for water
•
Demographic shifts within the United States
Efficiencies
gained or lost due to the installation of the latest
technology
• Trends in operating costs — for example, the
cost of chemicals and energy
• Criticality analysis —
which components of a system should take precedence for
investment due to age, condition, and importance) |
| Copies of the Gap Analysis and the Needs Surveys
are available from the Safe Drinking Water Hotline at
800-426-4791, the Office of Water Resource Center at
800-832-7828, and on the Internet at www.epa.gov/ow. |
| |
| Congress asked GAO to examine several issues
relating to the funding available to help meet the capital
investment needs of the nation's drinking water and wastewater
facilities. Given the broad scope of the request, GAO agreed
to provide the information in two reports. The first Water
Utility Financing and Planning report, issued in November
2001, addressed the amounts and sources of federal and state
financial assistance for drinking water and wastewater
infrastructure during fiscal years 1991 through 2000. |
| This second report, issued in September,
examines how the amount of money generated through user
charges and other local funding sources compare with the cost
of providing service at public and private drinking water and
wastewater utilities serving populations greater than 10,000.
It also discusses how such utilities manage existing capital
assets and plan for needed capital improvements, and what
factors influence private companies' interest in assuming the
operation or ownership of publicly owned drinking water and
wastewater facilities. |
|
| No Revenue Growth Scenario: 2000 -
2019 |
GAO found the amount of funds obtained from user charges
and other local sources of revenue was less than the full cost
of providing service — including operation and maintenance,
debt service, depreciation, and taxes — for over a quarter of
drinking water utilities and more than 4 out of 10 wastewater
utilities in their most recent fiscal year. |

|
| Revenue Growth Scenario: 2000 -
2019 |
While revenues from user charges and other local sources
were adequate to cover at least operation and maintenance
costs for nearly all of the utilities; an estimated 29 percent
of the utilities deferred maintenance because of insufficient
funding. Revenues from user charges accounted for most of
utilities' locally generated funds — at least three quarters
of all funds from local sources for at least three-quarters of
utilities. |
| GAO's survey found that more than a quarter of
utilities lacked plans recommended by utility associations for
managing their existing capital assets, but nearly all had
plans that identify future capital improvement needs. Among
the utilities that had plans for managing their existing
assets, more than half did not cover all their assets or
omitted key plan elements, such as an assessment of the
assets' physical condition. |
| In addition, while most utilities had a
preventive rehabilitation and replacement program for their
pipelines, for about 60 percent of the drinking water
utilities and 65 percent of the wastewater utilities, the
actual rate of rehabilitation and replacement in recent years
was less than their desired levels, and many had deferred
maintenance, capital expenditures, or both. |
| Many utilities also had plans for financing
their future capital needs, but nearly half believed that
their projected funding over the next 5 to 10 years would not
be sufficient to meet their needs. |
| GAO found that revenues from user charges
exceeded the cost of service at an estimated 39 percent of the
drinking water utilities and 33 percent of the wastewater
utilities. (For the purpose of this analysis, GAO defined a
utility's cost of service as operation and maintenance
expenses, taxes, depreciation, and debt service.) |
| When revenues from user charges were combined
with funding from other local sources, such as hook-up and
connection fees and sales of services to other utilities, an
estimated 71 percent of the drinking water utilities and 59
percent of the wastewater utilities covered their cost of
providing service. |
| According to GAO's survey results, about 85
percent of drinking water utilities and 82 percent of
wastewater utilities covered at least the operation and
maintenance portion of the cost of providing service using
revenues from user charges alone. Moreover, adding other
locally generated funds to the user charges, about 93 percent
of the utilities covered their operation and maintenance
costs. |
| GAO found that more than half of utilities whose
revenues from user charges and other local sources did not
cover their cost of providing service raised their rates two
times or less during the 10-year period from 1992 to 2001.
Overall, GAO found no statistically significant differences in
the frequency of rate increases between the utilities that did
not cover their costs and those that did. |
| A significant percentage of drinking water and
wastewater utilities—about 27 percent and 31 percent,
respectively—did not have plans for managing their existing
capital assets, although some utilities were in the process of
developing such plans. |
| Further, of the utilities with plans, more than
half did not include all of their assets or omitted one or
more key elements recommended by industry associations; for
example, 16 percent of drinking water utilities' plans and 21
percent of wastewater utilities' plans did not include
information on the condition level at which the utility
intends to maintain the assets. GAO found no statistical
differences among utilities of different sizes with regard to
the inclusion or exclusion of any of the key elements in their
asset management plans. However, GAO found that the plans
developed by privately owned drinking water utilities tended
to be more comprehensive than those developed by publicly
owned utilities. |
| According to GAO's survey results, some
utilities had significant portions of pipelines in poor
condition; for example, more than one-third of the utilities
had 20 percent or more of their pipelines nearing the end of
their useful life. Nevertheless, for about 60 percent of
drinking water utilities and 65 percent of wastewater
utilities, the actual levels of pipeline rehabilitation and
replacement in recent years were less than the utilities'
desired levels. |
| For example, GAO's survey indicates that roughly
half of the utilities actually rehabilitated or replaced 1
percent or less of their pipelines annually, even though an
estimated 89 percent of drinking water utilities and 76
percent of wastewater utilities believed that a higher level
of rehabilitation and replacement should be occurring. |
| Further, in each of three
categories—maintenance, minor capital improvements, and major
capital improvements—about one-third or so of the utilities
had deferred expenditures in their most recent fiscal years,
and 20 percent had deferred expenditures in all three
categories. With one exception, there were no statistically
significant differences among utilities of different sizes;
however, GAO found that public drinking water utilities were
more likely than their privately owned counterparts to defer
maintenance and major capital projects. |
| Copies of the General Accounting Office report
on Water Infrastructure: Information on Financing, Capital
Planning, and Privatization, can be downloaded in PDF format
at http://www.gao.gov/. |
| WaterWorld November,
2002 |