 |
|

Reform of federal
transportation financing has led to an improvement in the
condition of the nation’s roadways, though the nation’s street
and road networks could have improved even more had a stronger
emphasis been placed on repair and rehabilitation.
To view the .pdf, click here.
To view the slideshow, click here. |
|
|
|
 |
|

Despite the gains that have been made in
traffic safety programs in the U.S. over the last several
decades through a crackdown on drunk driving, increased
seatbelt usage, and the more widespread use of airbags,
traffic crashes are still the leading cause of death for
Americans between the ages of 4 and 33. The reauthorization of the
nation’s surface transportation funding bill, TEA-21 offers a
significant new opportunity to improve traffic safety and save
lives.
To view the .pdf, click here.
To view the slideshow, click here. |
|
|
|
 |
|

Nationwide, over the ten years of the Congestion
Mitigation and Air Quality (CMAQ) program, only 81% of the
apportioned funds to the states have been obligated to CMAQ, a
program which overall receives less than 6 cents of every
TEA-21 dollar available to the states. Setting aside
California and New York (the biggest recipients), the
remaining 48 states and the District of Columbia had an
average obligation rate of only 77.7
percent.
To view the .pdf, click here.
To view the slideshow, click here. |
|
|
|
 |
|

The bridge
program provides federal assistance to repair or replace aging
bridge infrastructure. Even though over 80,000 bridges are
still dangerously unsafe, bridge repair remains a low priority
in many states, and billions of dollars in bridge program
funding has been diverted to other uses.
To view the .pdf, click here.
To view the slideshow, click here. |
|
|
|
 |
|

Recent reports from the Federal
Highway Administration and the American Association of State
Highway and Transportation Officials suggest that problems
with transportation project delays will not be solved by
diluting widely-supported environmental laws. Instead, the
studies indicate that project delivery can best be
“streamlined” by addressing intrinsic flaws in the
transportation planning process. The most effective strategy
to speed project delivery is one of the fundamental principles
of the very environmental regulations under attack – involving
stakeholders early, often and
substantively.
To view the .pdf file, click here.
To view
the slideshow, click here. |
|
|
|
 |
|

The fifth
installment in STPP's “Decoding Transportation Policy &
Practice” series explains the process that allows states to
under- and overfund federal programs. The newest release
explores the implications of the growing loophole on how
states are spending federal transportation dollars.
To view the .pdf file, click here.
To view the slideshow, click here. |
|
|
|
 |
|

National Census figures
released last week show that Americans are enduring longer
commutes, and fewer of them are able to use transit, walking,
or other means to avoid the drive. The average trip to
work is up more than three minutes since 1990 to 25.5 minutes,
and a higher portion of commuters are driving alone to work.
In this decoder, we analyze the new data and explore travel
behavior not covered by the Census.
To view the .pdf file, click here. |
|
|
|
 |
|

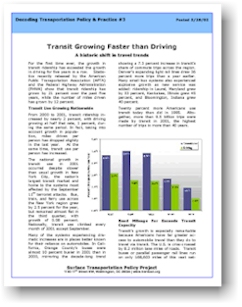
The American love affair with the car seems to be
slowing down, as transit ridership outpaced the growth in
driving for the sixth year in a row. This new addition to the
“Decoding Transportation Policy & Practice” series
explores the upward trend in transit use first reported by
STPP last month. This
analysis of information from the Federal Highway
Administration (FHWA) and the American Public Transportation
Association (APTA) shows that increased automobile use has
failed to keep pace with population growth, while transit
trip-making reached its highest level in 40
years.
To view the .pdf file,
click here. |
|
|
|
|
|
|

Highway interests often
back up their calls for more road-building by citing the
statistic that roadway capacity in the U.S. has grown by just
2 percent in the last ten years. This new decoder explains why
that figure greatly misrepresents the capacity of our nation's
surface transportation infrastructure.
To view the .pdf file,
click here.
To view the slideshow, click here. |
|
|
|
|
|
|
|

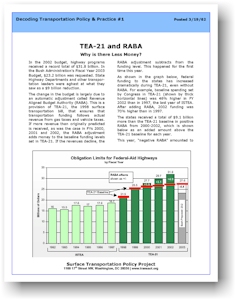
Our first issue examines
the complexities of Revenue Aligned Budget Authority, or RABA,
and why this means that federal transportation funding is
projected to decline $9.1 billion next year.
To view the .pdf file,
click here.
|
|
|
|
|
