|
Executive
Summary
- Overview
-
Summary
of 2002 Transportation Funding Ballot Measures
- The
Shift Toward Voter-Approved Measures
- Table
1: 1957 State Motor Fuel Taxes Adjusted for Inflation to
2002
- Table
2: Trend in Selected Revenue Sources for Transportation
Features
- General
Evaluation Criteria for Local Transportation Funding
Measures
- Table
3: States with Constitutional or Statutory Provisions Restricting
Expenditure of State Gasoline Tax Revenues to Highways
- Evaluating
Five Transportation Funding Measures in Depth
- Recommendations
Overview:
.
Voters across the country are
increasingly being asked to approve new funding measures for
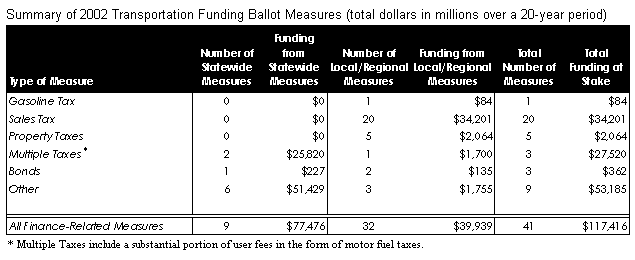
transportation at the polls. In 2002, as many as 41 transportation
measures appearing on the ballot could — if approved — be worth as
much as $117 billion in new funding over the next 20 years. This
emerging trend marks a significant shift in the traditional method
of financing transportation projects and programs – away from
legislatively-approved user fees (e.g. gasoline taxes) and towards
voter-approved general revenue taxes (e.g. sales taxes, general fund
budget revenues, bonds, etc.). The move towards voter-approved
transportation financing is found to be a product of two trends: (1)
the reluctance to increase traditional "user fee" revenues,
especially state gasoline taxes that have failed to keep pace with
inflation; and (2) the demand for more public transit projects which
are difficult to finance from traditional user
fees.
This report places these ballot
measures in the broader context of transportation finance,
recognizing that each of these funding measures varies greatly in
terms of effectiveness, equity, balance, and ability to meet stated
goals. The report also sets forth five criteria to help voters and
policy-makers evaluate pending and future ballot measures through an
in-depth review provided by five case studies. The report recommends
(1) broader public involvement in the initial development of
transportation ballot measures, (2) an end to the "trust us"
approach of failing to specify projects or dedicate locked-in
funding categories, (3) the elimination of restrictions on the
expenditure of state gasoline taxes on public transit, and (4) more
emphasis on coordinated land use planning and growth management as
part of larger transportation ballot measures. Further
recommendations are made for improving the content, consistency,
accountability and overall public support for future transportation
financing measures presented to voters.
Next year, Congress will debate the
reauthorization of the federal surface transportation law, known as
TEA-21, a law that increased federal funding commitments to state
and local governments by more than 45 percent. While the substantial
growth in federal investment under TEA-21 is a matter of record,
recent efforts by state and local governments to increase
transportation funding are much less described and understood. This
report is intended to provide some insights into what is now
occurring at the state and local level — where roughly three out of
every four transportation dollars nationwide are now raised — by
examining selected funding measures that are appearing before
voters. .
These funding measures
provide a glimpse into the changing alignments governing how the
nation’s transportation infrastructure needs are financed,
contradicting popular assertions that users pay for all the
improvements to these systems. While some observers assert that the
nation’s surface transportation infrastructure is funded by "user
fees" – taxes on fuels, tires, vehicle sales, registrations, etc. –
the reality is that these systems are only partially funded by users
of the system. This report shows that there is now a trend away from
user fees, where direct users in the future may carry even a smaller
share of the costs of maintaining and expanding our transportation
systems. Of the 41 transportation funding measures on the ballot
this year, only four attempt to increase state taxes on users, with
all of the other measures proposing to increase general taxes
directly or indirectly in support of future transportation
improvements. .
The financing of
our nation’s transportation system relies on a complex arrangement
of user taxes and fees as well as general fund taxes that,
collectively, underpin the expansion and maintenance of our nation’s
bridges, highway, street and sidewalk networks and our public
transportation systems. Prompted by the growing number of ballot
measures appearing before the voter in 2002, this report examines
some of the trends in transportation finance to provide some context
for voters in reviewing pending ballot measures as well as for
policy-makers at the federal and state level who next year will be
considering new financial commitments to transportation
infrastructure
The Shift Toward Voter-Approved
Measures .
The 41 transportation funding measures on the ballot in 2002
are evidence of a new trend away from asking direct users of the
system to finance future infrastructure needs. This shift towards an
increasing prevalence of voter-approved local tax and bond measures
and a declining reliance on so-called user fees needs to be more
closely examined and analyzed by transportation interests. Overall,
there appear to be two main reasons for this
trend:
· The growing
reluctance to increase traditional transportation user fees such
as state motor fuel taxes; .
· The growing
popularity of public transit which is difficult to finance
through traditional "user fee" methods like state motor fuel
taxes. .
Table 1 shows the
relative purchasing power of federal and state motor fuel taxes,
adjusted for inflation, over the last 35 years. Interestingly,
federal fuel tax rates have outpaced inflation over time, while
state fuel tax rates have fallen substantially behind, by about 50
percent.
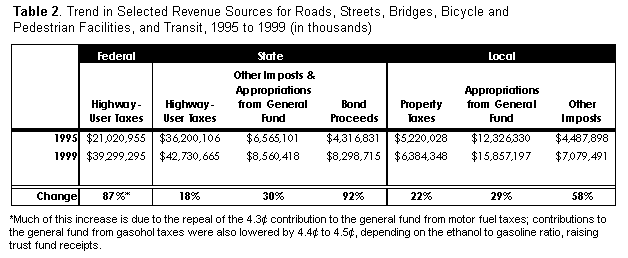
To illustrate this point
during the most recent five-year period, Table 2 shows revenue
growth for federal and state motor fuel taxes during the period
1995-1999. It is noteworthy that revenues from state fuel taxes
largely follow driving rates, as measured by vehicle miles traveled
(VMT). The growth in federal revenues – nearly seven times the
growth in VMT – reflects the 1998 Congressional commitment to
increase transportation spending under TEA-21. This suggests that
while federal commitments were rising, state governments – both
governors and legislators – generally chose not to increase motor
fuel taxes in support of transportation investment. In fact, after
TEA-21, only six states increased their gasoline taxes faster than
the rate of inflation – most didn’t increase gas taxes and five
states actually decreased them. At the same time, the growth in
non-user fee revenues outpaced even the growth in state motor fuel
tax revenues.
Since state governments
have been reluctant to pursue increases in traditional
transportation user fees, local governments have been forced to turn
to the general taxpayer – and often the voter – to support
transportation infrastructure. Historically, local governments have
not been given access by their states to user fees, such as motor
fuel taxes, to finance transportation improvements. In addition to
the difficulty local areas confront in gaining access to user fees,
many state constitutions and statutes limit the expenditure of
transportation user fees for anything other than highway
improvements (see Table 3). In light of this development many local
officials are asking state governments to open up state gasoline tax
revenues and transportation trust funds for use on public transit
and other local transportation projects. There is an increasing
belief that states should not continue to sequester state
transportation trust funds for their own uses, excluding the
legitimate transportation needs of local governments, while asking
local governments for additional project funding for the state
system.
In many markets, particularly urbanized
areas, local decision-makers have also not been receiving their
"fair share" of revenues from the user fees that are generated in
their areas, as state allocation decisions over both federal and
state funds often move resources disproportionately to other parts
of their respective states or state policies work against local
control over project selection when resources are provided. As a
result, localities are forced to turn to the general taxpayer and
general taxes to support additional highway and street investment –
including some state-owned roadways –as well as for alternative
transportation investments, such as public transit. The
transportation funding measures appearing before voters in 2002
animate these circumstances, as local officials seek increased local
funding support for transportation. The pending measures also
underscore the view that increased investment in public
transportation is seen as a high priority all across the
nation.
| Table 1. 1957 State Motor Fuel Taxes
Adjusted for Inflation to 2002 (cents) |
|
| |
1957
State Motor Fuel Tax |
1957
State Motor Fuel Tax Adjusted for Inflation to 2002 |
2002
Actual State Motor Fuel Tax |
Difference Between Actual and Inflation Adjusted 1957
State Motor Fuel Tax |
| Alabama |
7.0 |
37.9 |
18.0 |
-19.9 |
| Alaska* |
5.0 |
25.5 |
8.0 |
8.0 |
| Arizona |
5.0 |
27.1 |
18.0 |
-9.1 |
| Arkansas |
6.5 |
35.2 |
21.7 |
-13.5 |
| California |
6.0 |
32.5 |
18.0 |
-14.5 |
| Colorado |
6.0 |
32.5 |
22.0 |
-10.5 |
| Connecticut |
6.0 |
32.5 |
25.0 |
-7.5 |
| Delaware |
5.0 |
27.1 |
23.0 |
-4.1 |
| District of
Columbia |
6.0 |
32.5 |
20.0 |
-12.5 |
| Florida |
7.0 |
37.9 |
13.9 |
-24.0 |
| Georgia |
6.5 |
35.2 |
7.5 |
-27.7 |
| Hawaii* |
5.0 |
25.5 |
16.0 |
16.0 |
| Idaho |
6.0 |
32.5 |
26.0 |
-6.5 |
| Illinois |
5.0 |
27.1 |
19.3 |
-7.8 |
| Indiana |
4.0 |
21.7 |
15.0 |
-6.7 |
| Iowa |
6.0 |
32.5 |
20.0 |
-12.5 |
| Kansas |
5.0 |
27.1 |
21.0 |
-6.1 |
| Kentucky |
7.0 |
37.9 |
16.4 |
-21.5 |
| Louisiana |
7.0 |
37.9 |
20.0 |
-17.9 |
| Maine |
7.0 |
37.9 |
22.0 |
-15.9 |
| Maryland |
6.0 |
32.5 |
23.5 |
-9.0 |
| Massachusetts |
5.0 |
27.1 |
21.0 |
-6.1 |
| Michigan |
6.0 |
32.5 |
19.0 |
-13.5 |
| Minnesota |
5.0 |
27.1 |
20.0 |
-7.1 |
| Mississippi |
7.0 |
37.9 |
18.4 |
-19.5 |
| Missouri |
3.0 |
16.3 |
17.1 |
0.8 |
| Montana |
7.0 |
37.9 |
27.0 |
-10.9 |
| Nebraska |
6.0 |
32.5 |
25.4 |
-7.1 |
| Nevada |
6.0 |
32.5 |
24.0 |
-8.5 |
| New Hampshire |
5.0 |
27.1 |
19.0 |
-8.1 |
| New Jersey |
4.0 |
21.7 |
14.5 |
-7.2 |
| New Mexico |
6.0 |
32.5 |
18.0 |
-14.5 |
| New York |
4.0 |
21.7 |
22.6 |
0.9 |
| North Carolina |
7.0 |
37.9 |
24.5 |
-13.5 |
| North Dakota |
6.0 |
32.5 |
21.0 |
-11.5 |
| Ohio |
5.0 |
27.1 |
22.0 |
-5.1 |
| Oklahoma |
6.5 |
35.2 |
17.0 |
-18.2 |
| Oregon |
6.0 |
32.5 |
24.0 |
-8.5 |
| Pennsylvania |
6.0 |
32.5 |
26.6 |
-5.9 |
| Rhode Island |
4.0 |
21.7 |
29.0 |
7.3 |
| South Carolina |
7.0 |
37.9 |
16.0 |
-21.9 |
| South Dakota |
5.0 |
27.1 |
22.0 |
-5.1 |
| Tennessee |
7.0 |
37.9 |
21.4 |
-16.5 |
| Texas |
5.0 |
27.1 |
20.0 |
-7.1 |
| Utah |
5.0 |
27.1 |
24.8 |
-2.3 |
| Vermont |
5.5 |
29.8 |
20.0 |
-9.8 |
| Virginia |
6.0 |
32.5 |
17.5 |
-15.0 |
| Washington |
6.5 |
35.2 |
23.0 |
-12.2 |
| West Virginia |
6.0 |
32.5 |
25.4 |
-7.2 |
| Wisconsin |
6.0 |
32.5 |
27.3 |
-5.2 |
| Wyoming |
5.0 |
27.1 |
14.0 |
-13.1 |
| |
|
|
|
0.0 |
| Average |
5.7 |
31.0 |
20.3 |
-9.7 |
|
|
|
|
|
|
|
|
|
|
| *Alaska and Hawaii became
states after 1957.
The state gas taxes shown are for
1959 |
The longer term implications
of this growth in local transportation ballot measures are
significant, and ominous. If states are not willing to address the
need to increase state gas taxes to fund projects, including public
transit, and continue to shift the burden to local property, sales
and general taxes, they will displace resources needed to fund other
core functions of local government—schools, police, fire protection,
parks and recreation etc. This report seeks to call attention to
these developments in transportation finance and invite discussion
on its longer-term implications.
General Evaluation
Criteria for Local Transportation Funding Measures
This analysis of 41
transportation funding measures initiated across the country in 2002
seeks to provide voters some guidance on how to evaluate them for
their effectiveness, equity, and balance. The measures on the
ballot, if approved, could raise as much as $117 billion for
transportation projects and operations over the next 20 years. This
report poses the following questions to evaluate the
measures:
(1) Where Will the
Revenue Come From?
The source of revenue for
transportation funding measures is becoming a critical question for
transportation financing in general and local voter-approved
measures in particular. While traditional "user fees" such as
gasoline taxes promote more efficient use of the transportation
system, their popularity appears to be waning among state
policymakers. While federal gasoline taxes have kept pace with
inflation since 1957 (just after the inception of the Interstate
highway program), state gasoline taxes have not. Local sales taxes
and other sources, including bonds, are increasingly being used to
finance local transportation projects and, in effect, help offset
the shortfall in state gasoline tax revenues. While sales taxes and
gasoline taxes are regressive, both also have inherent advantages
and disadvantages. Sales taxes are increasingly popular in part
because they are far more flexible than gasoline taxes and can fund
public transit operations. So-called GARVEE bonds are a newer
innovation that promise future transportation revenues as payment
for retiring bond debt – unfortunately they have negatively impacted
state transportation budgets, and should be avoided until
significant structural flaws in the financing mechanism can be
worked out.
(2) How Will the Revenues Be
Spent?
How revenues from a transportation
funding measure are spent is typically the most controversial aspect
of any financing effort. Local funding measures – particularly sales
taxes – are often the most flexible source of funding for public
transit operations. The public and many interest groups respond well
to both a balance of projects – with a strong emphasis on public
transit in metropolitan areas – along with an assurance that the
money will be spent on specific projects or program types. Voters
must also consider whether revenue is tied to specific projects or
programs. The "trust us" approach of failing to specify either
project or program categories is far from ideal. A significant
problem on the expenditure side is the lack of ongoing maintenance
and operations funding for both road and public transit, and the
frequent absence of any land use planning criteria or incentives for
local growth patterns that will protect the public’s infrastructure
investments. San Mateo County, California, presents an excellent
case study in the use of transportation funds as incentives for
better land use thereby reducing future needs for costly new
transportation infrastructure.
| Table 3. States with Constitutional or
Statutory Provisions Restricting Expenditure of State Gasoline
Tax Revenues to Highways |
|
|
| |
Constitutional or Statutory Restriction on State
Gasoline Tax Expenditures |
| Alabama |
Constitutional |
| Alaska |
Statutory |
| Arizona |
Constitutional |
| Arkansas |
Statutory |
| Colorado |
Constitutional |
| Georgia |
Constitutional |
| Idaho |
Constitutional |
| Indiana |
Statutory |
| Iowa |
Constitutional |
| Kansas |
Constitutional |
| Kentucky |
Constitutional |
| Maine |
Constitutional |
| Minnesota |
Constitutional |
| Mississippi |
Statutory |
| Missouri |
Constitutional |
| Montana |
Statutory |
| Nebraska |
Statutory |
| Nevada |
Constitutional |
| New Hampshire |
Constitutional |
| New Mexico |
Statutory |
| North Dakota |
Constitutional |
| Ohio |
Constitutional |
| Oregon |
Constitutional |
| Pennsylvania |
Constitutional |
| South Dakota |
Constitutional |
| Tennessee |
Statutory |
| Utah |
Constitutional |
| Washington |
Constitutional |
| West Virginia |
Constitutional |
| Wyoming |
Constitutional |
(3) What Provisions for
Oversight and Accountability Have Been Established?
Third-party monitoring is
critical to ensure that transportation agencies and taxing
authorities are accountable to users of the system and to their
fiscal sponsors. Oversight committees should include a broad
representation of agency staff, elected officials, stakeholders,
interest groups and users of the system (the disabled, senior
citizens etc.). Performance measures should be built into the
funding measures to gauge the effectiveness of projects and programs
in attaining public goals such as mobility, safety, air quality
improvement, and traffic congestion relief. Sunset clauses to limit
the life of the funding measures and require winning renewed support
from voters after 10, 20 or 30 years also adds additional
accountability assurances.
(4) How Do Proposed
Projects Relate to Existing Plans and Processes? .
Projects and programs funded via
transportation ballot measures must reflect, rather than bypass or
ignore, the planning process and existing plans. Under ISTEA and
TEA-21, regions and states must produce continually updated
short-term and long-term transportation plans. These plans run the
gamut from a wish-list of projects, to detailed descriptions of
proposed infrastructure changes or additions, including an analysis
of those proposed projects’ impacts on regional air
quality.
Projects or programs
contained in ballot measures should relate to and reflect those
existing plans or processes. While ballot measures serve as an
important mechanism by which citizens can voice their opinions about
what the state or region’s transportation system should look like,
the authors of such measures must consider the plans already in
place. Failing to do so could have detrimental impacts on agency
budgets and efforts to improve mobility, safety, or air
quality.
(5) Is the Proposed
Initiative at the Appropriate Level of Government?
.
Finally, the voter must consider whether the proposed project
or program will be administered at the appropriate level of
government. Regional planning has gotten somewhat of a boost within
recent legislation. Transportation problems and needs, like so many
other issues today, no longer follow the political lines and
boundaries that were established hundreds of years ago. While
regions vary throughout the country, they are typically comprised of
a traditional urban core and its multiplicity of outlying suburbs –
often also encompassing several counties.
The federal
transportation funding laws, ISTEA and TEA-21, greatly strengthened
the regional transportation planning process. Those laws gave
Metropolitan Planning Organizations (MPOs) increased funding and
expanded authority to select projects and mandates for new planning
initiatives in their regions in an effort to ensure that the
transportation infrastructure would reflect regional needs and land
use patterns. While a regional approach to transportation planning
may be imperfect, it is no doubt an improvement over state-driven
programs, which often don’t reflect regional needs. A regional
approach is also sometimes an improvement over a purely
locally-based method, which may not be coordinated with other
regional projects or goals.
Evaluating Five
Transportation Funding Measures in Depth
In addition to an overall
analysis of historical trends and a snapshot of 2002
transportation-related ballot measures, this report analyzes five
measures in greater detail to illustrate how they could be evaluated
for effectiveness, equity, and balance. The five were selected based
on geographical distribution (one in the West, one in the Northwest,
one in the South, one in the Midwest and one in the Mid-Atlantic
region of the U.S.), scope (two statewide, one regional, two local),
and anticipated impact. Of the five chosen for in-depth analysis,
Alameda County’s Measure B transportation sales tax was approved in
November 2000 and Missouri’s Proposition B was rejected by voters in
August 2002. The three remaining measures — the Miami-Dade County
sales tax in Florida, Referendum 51 in Washington State, and
northern Virginia’s regional sales tax referendum – will all appear
on the ballot November 5, 2002. Initial findings once the five
evaluation criteria are applied to the measures can be summarized as
follows:
(1) Alameda
County, California: the passage of Alameda County’s Measure
B sales tax in November 2000 presents a useful yardstick by
which to judge other financing measures. Though using a more
regressive sales tax, great care was taken to ensure that the
measure’s programs benefited lower income residents by
dedicating one-third of revenues to public transit operations.
Additional dedicated funding categories provided revenues for
bicycle and pedestrian safety, land use incentives, local street
and road repair, and new public transit and highway capital
projects. The eventual measure won a rare show of unanimous
support from a broad range of stakeholders and the public took
notice, approving Measure B with 81.5 percent
support.
(2) State of
Missouri: the failure of Missouri’s Proposition B in August
2002 by nearly a 3-to-1 margin was seen as a rejection of a
poorly assembled plan that amounted to an effort to pay down
previous funding obligations. The proposition would have set
aside 13 percent of its funding for public transit and other
"multimodal" measures, an amount that critics and many voters
felt was too little to make much of an impact. The measure would
have increased the state gasoline tax by four cents and the
state sales and use tax on vehicles by a half percent. The
general sales tax would have generated about 60 percent of the
total revenue for the measure. The measure also failed to
devolve much of its revenues down to the regional and local
level and asked the voters to believe in the "trust us"
approach.
(3) Miami-Dade
County, Florida: a half cent sales tax measure on the
November ballot will fund a variety of transportation projects
including rail transit, bus transit, road repairs, highway
widenings, sidewalks, bikeways and neighborhood-based
improvements. The measure grew out of a unique and impressive
community-based effort to identify the most pressing
transportation problems countywide.
(4) Northern
Virginia: the sales tax referendum appearing on the November
5th ballot has been broadly debated on many if not all of this
report’s evaluation criteria. Among these are the failure to
lock in dedicated funding streams (i.e. almost half of the
funding follows the "trust us" approach), the lack of any
provision for performance measures or coordinated land use
planning, and the problems that a subregional measure poses for
the plans and processes already in place at the regional level –
particularly for the entire region’s air quality
conformity.
(5) State of
Washington: Though drawing from a variety of revenue
sources, including a heavy reliance on user fees, Referendum 51
has drawn vocal opposition from a broad cross section of public
interest groups for failing to spend enough of its funding on a
wider range of transportation choices. The groups are asking for
at least one-third of the measure’s funding to be dedicated to
transportation choices (public transit and other alternatives to
solo driving) and a greater focus on traffic safety projects.
Other analysts point out that the measure is almost exclusively
focused on capital projects influenced more by politics than
sound policy, with little funding included for project
maintenance or repairs.
While a total of 41
transportation funding measures are appearing on the ballot in 2002,
the ones selected provide a great deal of insight into the trends
and issues that prove to be consistent throughout each.
Recommendations
While local
transportation funding measures will vary widely according to the
different transportation needs of any given region or state, the
following seven recommendations can provide an important guide for
improving the content, consistency, accountability and overall
public support for future transportation financing measures
presented to voters.
(1) Make Traditional User Fees – Especially
State Gasoline Taxes – More Flexible: As of 2002, 30 states
have prohibitions in their state constitutions or statutes on the
expenditure of state gasoline taxes on public transportation
services. These restrictions are arcane, outdated and are a large
part of the reason voters are turning to ballot measures to help
fund public transit.
(2) Index Gasoline
Taxes to Inflation: If
politicians are unwilling to raise gasoline taxes, states need to
begin indexing gasoline taxes to at least match the increase in
the consumer price index. Gasoline taxes may not play the dominant
role in raising transportation revenues that they once did, but
they should be maintained as an important part of the "user fee"
financing structure.
(3) Develop New User
Fees to Supplement Gasoline Taxes: While gasoline taxes are important in terms of being a
"user fee," it’s clear that their purchasing power and their
political viability are eroding quickly. New forms of user fees
must be developed as a means of providing additional
transportation revenues and maximizing economic efficiency in the
use of the transportation network. Possible user fees include road
and bridge tolls, congestion pricing charges, a "vehicle miles
traveled" (VMT) fee based on the distance driven, and energy taxes
on vehicles with minimal fuel efficiency.
(4) Avoid the "Trust
Us" Approach: One of the
biggest problems that both stakeholder groups and many voters have
with local financing measures is that they necessitate a basic
trust of government and public agencies. One way to get around
this mistrust is to end or discourage the practice of allowing
large parts of funding measures to be left unaccounted for until
after the election. At the very least, funding measures should
specify specific program categories and purposes that funding will
be distributed among. Measures should also contain performance
measures and statistical analysis to substantiate promised
benefits.
(5) Require Greater
Stakeholder Involvement:
Stakeholders and members of public interest groups should be
closely involved in the development of transportation funding
measures early on. An additional mechanism to ensure ongoing
public involvement and encourage the trust of the voters (and the
good will it takes to return to the voters in subsequent
elections) is to establish citizen oversight committees that
consist of both citizen appointees as well as specific interest
groups. A good model is Alameda County’s Measure B approved in
2000 that contained both a citizen advisory committee as well as a
citizens’ watchdog committee.
(6) Apply a Social
Equity Test for Non-User Fees: Since general fund revenues are typically spent on health
care, education and other social service programs, voters and
officials must apply an "equity test" for non-user fee financing
of transportation. The simple question is "who benefits and who
pays?" In the case of poorer families paying sales taxes, it
stands to reason that poorer families should also benefit from the
programs and projects in the tax expenditure plan.
(7) Encourage or
Require Land Use Incentives in Funding Measures: The missing component of all too many
transportation financing measures is growth management and land
use. Additional transportation investments will do nothing to meet
future transportation needs if growth pressures and land use
decisions are not closely coordinated. This must become a routine
component of any responsible transportation finance measure and
can help win additional voter and stakeholder
support.
This year’s transportation funding
measures appearing on the ballot mark a significant shift in how the
nation’s transportation infrastructure needs are being financed.
While some form of user fees (e.g. gasoline taxes) will continue to
play an important role in transportation finance in the near future,
the trend towards voter-approved measures looks to be only getting
stronger. It is vital for transportation interests and
decisionmakers to understand why this trend is happening, to do what
they can to improve the content and consistency of the measures in
terms of integrating them with existing transportation plans and
processes, and perhaps most importantly re-orient traditional state
and federal funding sources towards better supporting the trend
toward better transportation choices.
|
