Sprawl Report 2001 As discussed in the last chapter, our reliance on cars and trucks has led to severe air pollution problems and a significant public health threat, but the good news is that we can do something about it. By investing in public transit choices, we can enhance the quality of life in our communities and ensure that we all breathe cleaner air. Opportunities to Invest in Transit and Clean Up the Air In 1991, with the passage of the Intermodal Surface Transportation and Efficiency Act (ISTEA), lawmakers finally made the connection between transportation and air pollution. The Act recognized the strong connection between air pollution and transportation by designating billions of dollars for projects designed to help areas meet the standards for smog and carbon monoxide (the so-called CMAQ or Congestion Mitigation and Air Quality program). In 1998, Congress reauthorized and strengthened this transportation law by passing TEA-21, the Transportation Equity Act for the 21st Century. TEA-21 built upon the successes of ISTEA and represented a step forward for more-friendly treatment of public transportation choices. In addition to CMAQ, some of the more important features of TEA-21 include the following: The Transportation Enhancements program funds transportation projects that strengthen the cultural, aesthetic or environmental benefits of a given transit program.
The good news is that under TEA-21, funding levels for these programs aimed at less-polluting public transit choices, including the enhancement program, CMAQ and transit, all increased slightly, while spending on new roads declined.(34) While TEA-21 has made great strides in improving the availability and quality of less-polluting transportation choices, we still have a long way to go to balance the historic discrepancy of expenditures on roads vs. public transit (see chart at right). We must continue to increase investments in clean public transit, and offer transportation choices as a way to enhance both quality of life and the quality of the air we breathe. Investing in Transportation Choices Giving people more transportation choices can dramatically lower automobile use, reducing air pollution and the accompanying effects on public health. In fact, according to a study done by the Centers for Disease Control and Prevention in Atlanta, providing more transportation choices during the 1996 Olympics reduced traffic by 22 percent, air pollution by 28 percent and asthma attacks by up to 42 percent.(35)
Conversely, limiting transportation choices while disproportionately funding new highway construction leads to more sprawling development, continued environmental degradation and air pollution that threatens public health. By examining the transportation funding in the areas with the most smog from cars and trucks, we can see what these places are doing about the problem. This grading examines the transportation funding priorities of the states containing all or part of our 50 largest cities, again standardized by applying a per-person calculation. Unfortunately, data on transportation spending by all levels of government is not available at the city level. Because transportation spending is determined by the states, data is kept at that level. Using state-level data is sufficient to show general trends, and that is what we do in this report. In a few cases, however, the use of state level data produces anomalies that need explanation. For example, in Texas we know that Dallas is investing more in public transit choices, such as Dallas Area Rapid Transit (DART), than Houston. However, because there is not reliable data at the city level, we cannot quantify the difference in transit investments between these two major cities. Policy changes that would keep transportation spending data at the city level would help planners make better decisions. This grading analyzes states that contain all or part of one of the 50 largest cities (those used in the first ranking). The information on transit funding comes from the Federal Transit Administration's National Transit Database(36) and the information on highway spending comes from the Federal Highway Administration.(37) The per-person calculations (transit spending per city resident[38] and highway expenditures per person[39]) are based on population numbers from the Census Bureau.(40) All numbers are for 1998. Based on the amount spent per city resident on transit for every $100 dollars spent on highways per person statewide, we used the following grading scale:
Connection Between Spending on Transportation and Least-Polluted Cities By comparing pollution from cars and trucks per person to transit spending per person, you'll notice a striking connection. New York state, for example, receives an "A" for its spending on public transit, and is the only state in this grading that spends more money on alternatives than on new roads. At the same time, as shown by the first grading, the New York City metropolitan area received the best grade of all the cities for the lowest amount of smog per person from cars and trucks. Oklahoma, where Oklahoma City had the most smog from cars and trucks per person, spends a paltry $5.80 per person on public transit to every $100 it spends on highway and road construction. This makes Oklahoma one of the lowest graded states in terms of spending on transportation choices vs. roads. The fact that seven of the 12 cities with the best grades for lowest rates of smog per person from cars and trucks are located in five of the highest graded states for spending on clean transportation choices demonstrates the power of public transit as a tool in combating air pollution. Equalizing Transit and Highway Spending Can Reduce Air Pollution
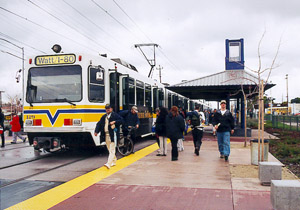
The example set by New York demonstrates that in equalizing spending between public transit and highways, states have a potent tool in the effort to reduce air pollution. Unfortunately, most states still are not using this funding tool as vigorously as they can. With the exception of New York, no states in this report have even equalized funding, and only eight states spend at least 50 percent of the amount of money on public transit as they do on roads. Even those states that spend at least half as much on transit as on highways are not doing enough. Consider the example of California, which spends $56 per person on public transit for every $100 on highways. While the higher level of spending on transit does help explain the fact that the three California cities (Sacramento, San Francisco and Los Angeles) showed relatively lower levels of smog from cars and trucks per person than cities in other states, this does not alter the fact that these California cities are still quite polluted. For each resident of Los Angeles, approximately 65 pounds of smog comes from cars and trucks annually. These high levels of pollution per person actually helps make Los Angeles the number one overall most smog polluted city in the country. Clearly, California needs to take better advantage of transit investments-a proven tool for reducing smog. Additionally, in 1998, 27 percent of the funds for transit agencies in Washington state came from the Motor Vehicle Excise Tax (MVET). In 2000, the MVET was repealed, and the state legislature has not come up with a permanent replacement. Consequently, just to keep up with 1998 levels, there's currently a $200 million-a-year hole in transit funding in Washington state. Texas is another example of a state that needs to do more. While the investments in Dallas' DART system are important and should be continued, other areas of the state, like Houston, are suffering. Houston does compare somewhat favorably to other areas based on their smog per person from cars and trucks. At the same time, it is one of the most smog polluted cities in the country, according to the American Lung Association. Texas can do more to combat this pollution by investing in clean transportation choices. Funding Choices: The Problem or The Solution Funding choices can be either the problem or the solution. By investing in clean transportation choices we can enhance the quality of life in our communities and ensure that we all breathe cleaner air. Comparing the highway vs. transit spending of states not only shows us how we have compounded air pollution problems across the country, but also lets us see what needs to be done to fix the problem. States that want to reduce their air pollution and curb sprawl will have to increase funding for public transit, rather than continue to fund more highways. Debates over transportation spending in the coming years should focus on a realignment of transportation spending, at both the federal and state level, which would balance investments in highways and transit.
|