Summary of Traffic Stops Statistics Across North Carolina
Frank R Baumgartner and Thomas Harley
November 14, 2023
This page presents summary statistics for the 20 largest police agencies in North Carolina. This page shows statistics for the entire state, and the links at the left point the user to pages for individual police departments.
Each report is identically formatted and shows the same information as the state-wide report below. Data come from the SBI-122 forms as reported to the state. Thanks to Thomas Harley, UNC '23 (Economics, Political Science) and current master's degree student, for compiling these reports based on a template Baumgartner and he developed jointly.
Each report provides information allowing an assessment of various elements concerning racial and gender disparities in policing as well as trends over time and other relevant factors.
Please contact Prof. Frank R. Baumgartner at frankb@unc.edu for any questions or with comments.
The following report compiles and presents statistical summaries of traffic stops statistics drawn from the NC State Bureau of Investigation database to which each police agency reports their statistics each month. Data in this report cover the period of 2002 through 2020. The data exclude checkpoint stops because such stops are not recorded systematically. The data also include only the driver of the vehicle, excluding any passengers. Passenger information is generally recorded only in the event of an adverse outcome (e.g., search, arrest).
This report provides the following summary statistics:
First is a table providing summary statistics on numbers of stops, searches, contraband hits, and arrests, as well as relevant rates of these outcomes. This is followed by a series of graphics displaying department and officer level data.
| Summary of outcomes | ||
|---|---|---|
| Stops | 24,980,776 | |
| Traffic Safety Stops | 13,365,910 | |
| Searches | 763,343 | |
| Hits | 280,152 | |
| Arrests | 500,040 | |
| Arrest From Hit From Search | 105,784 | |
| Consent Searches | 346,475 | |
| Arrest From Hit From Consent Search | 20,759 | |
| Probable Cause Searches | 264,963 | |
| Arrest From Hit From Probable Cause Search | 54,326 | |
| Percent Traffic Safety Stops | 53.50% | |
| Search Rate Per Stop | 3.06% | |
| Hit Rate Per Search | 33.48% | |
| Arrest Rate Per Hit | 38.85% | |
| Hit-and-Arrest Rate Per Search | 13.86% | |
| Hit-and-Arrest Rate Per Probable Cause Search | 20.50% | |
| Hit-and-Arrest Rate Per Consent Search | 5.99% | |
| Arrest Rate Per Stop | 2.00% | |
| Hit-and-Arrest Rate Per Stop | 0.42% | |
Numbers at top of the table show raw values; numbers below are the percentages based on the numbers above.
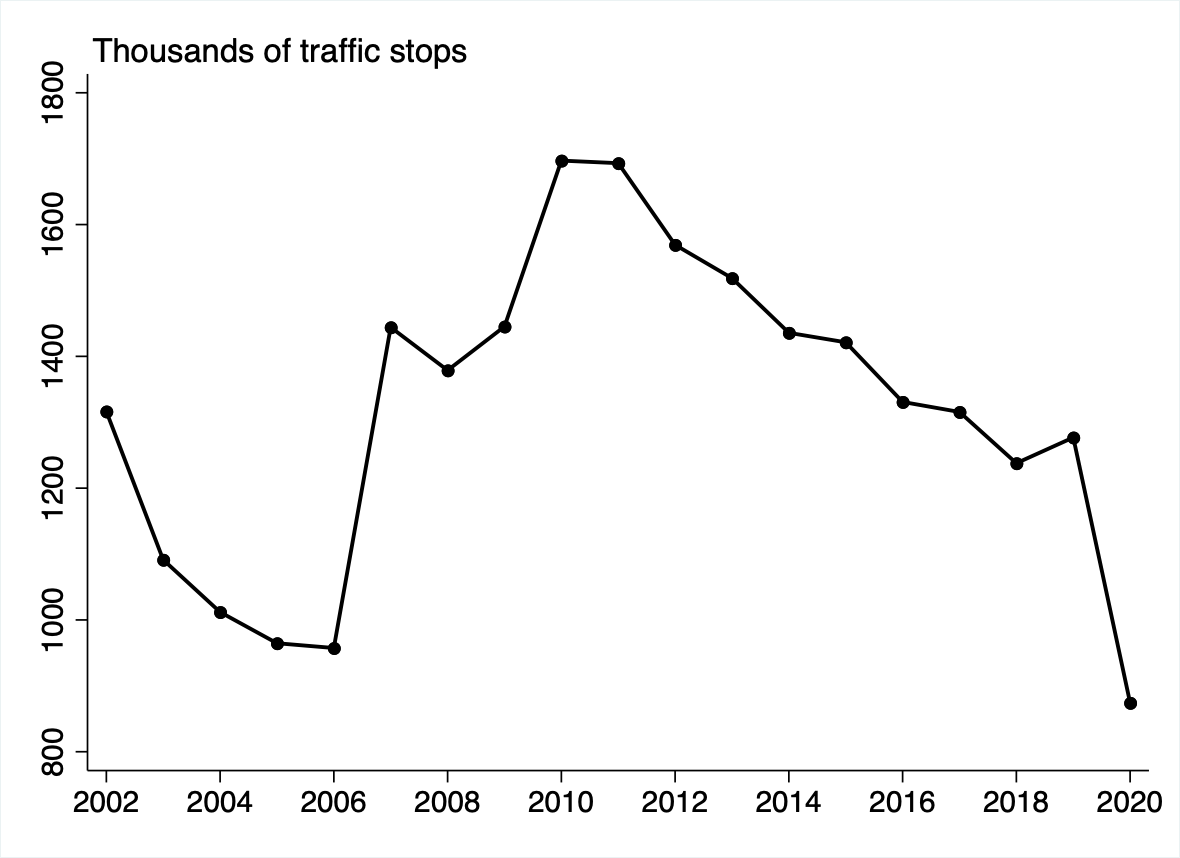
Figure 1 shows the total number of stops per year from 2002-2020. Numbers range from approximately 1 million (in 2006) to 1.7 million (2010 and 2011). There is a sharp drop associated with the global pandemic in 2020.
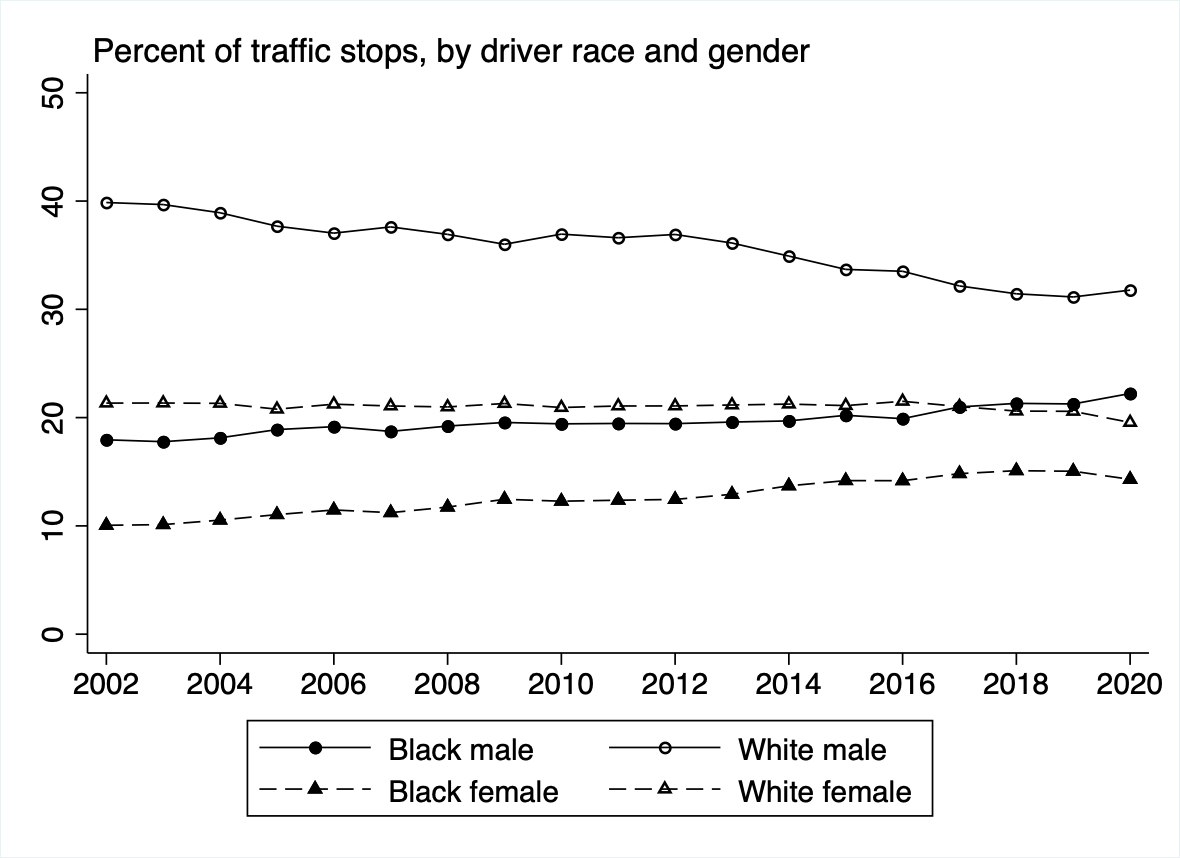
Figure 2 shows the total number of traffic stops by race and gender from 2002-2020. For example, in 2002, roughly 40% of total traffic stops were of white males, roughly 21% of stops were of white females, roughly 18% were of black males, and roughly 10% were of black females. White male driver’s share of those stopped decreased over the timeframe, while both black males and females slightly increased as a proportion of total stops.
Figure 3. Percent of stops for “safety” purposes (speeding, stop sign, DUI, unsafe movement)
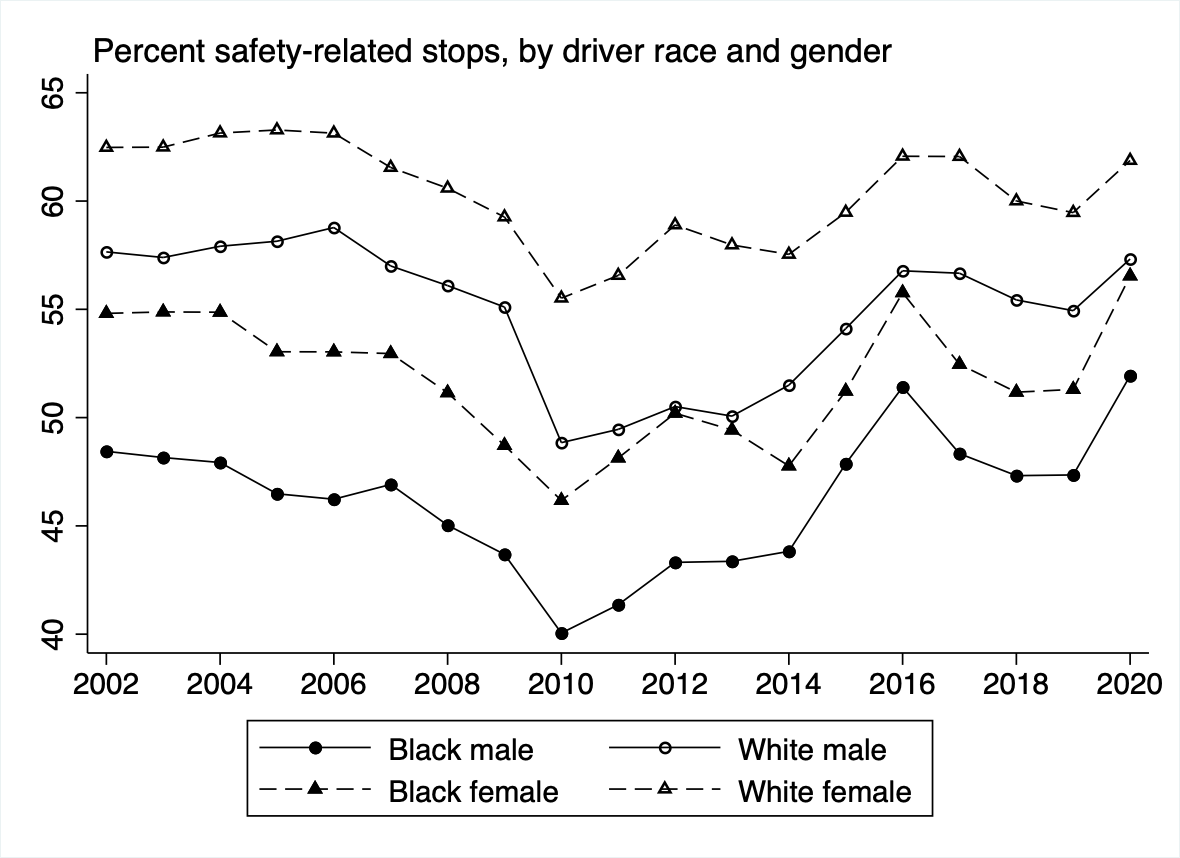
Figure 3 shows the percentage of traffic stops that are considered safety-related for each respective race and gender grouping, from 2002-2020. Safety-related spots are composed of stops due to speeding, stop sign violations, DWI, and unsafe movement. Stops for violations other than this are classified as non-safety related. These are composed of non-moving violations such as equipment violations and expired tags. For this reason, non-safety-related stops can be considered to be used as informal criminal investigations. Each race and gender grouping follows a similar trend from 2002-2020. White females consistently have the highest percentage of stops classified as safety-related, while black males have the lowest. In most years, a majority of stops of black male drivers are non-safety related, with 2016 and 2020 being the only exceptions.
Figure 4. Percent of stops resulting in a search, by race-gender category
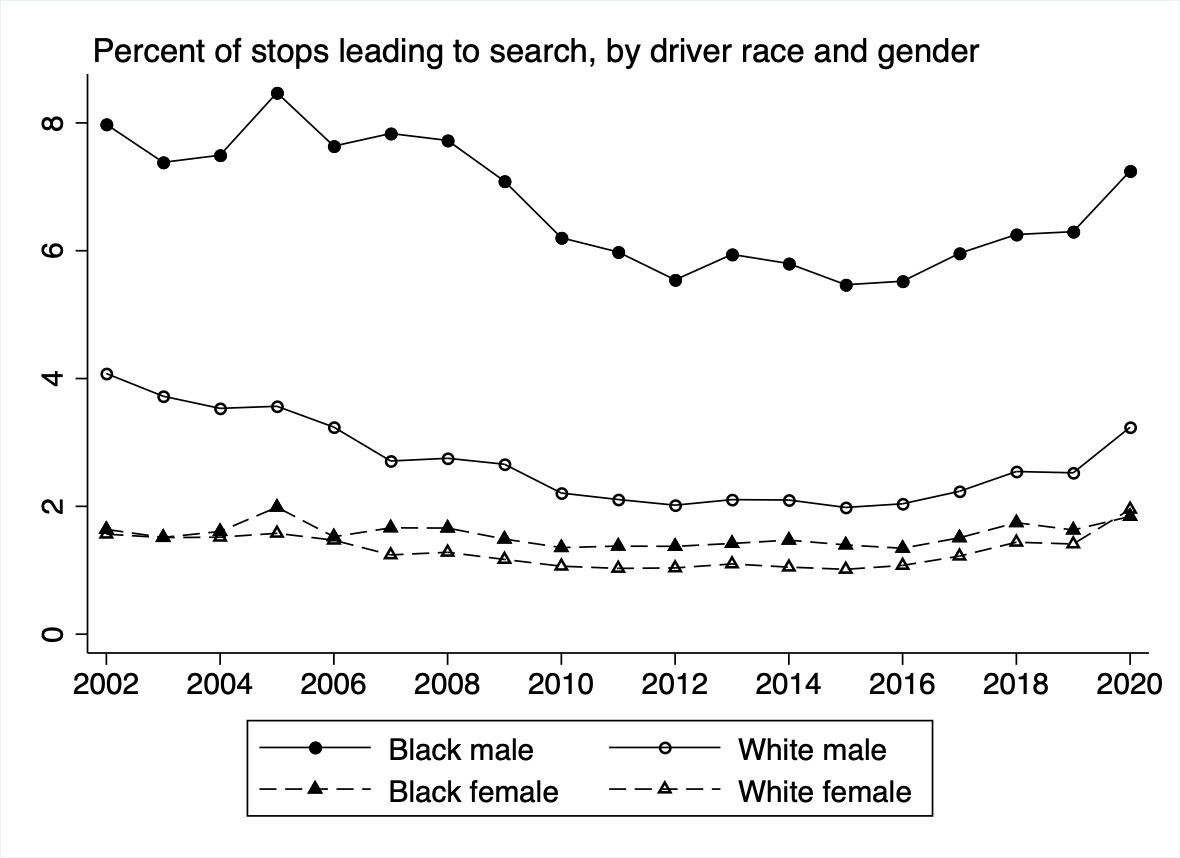
Figure 4 shows the percent of traffic stops that result in a search for each respective race and gender grouping, from 2002-2020. The Figure indicates that most traffic stops do not result in a search, with all categories being searched at less than a 10% rate across the time period. Black males were searched at the highest rate, ranging from 6 to 8% across the time period. This is roughly twice as often as the second most searched group, white males, who were searched in roughly 3 to 4% of stops. White and black female drivers experienced similar levels of search rates over the time period, with both groups being searched at a lower rate than white and black males.
Figure 5. Percent of stops resulting in arrest, by race-gender category
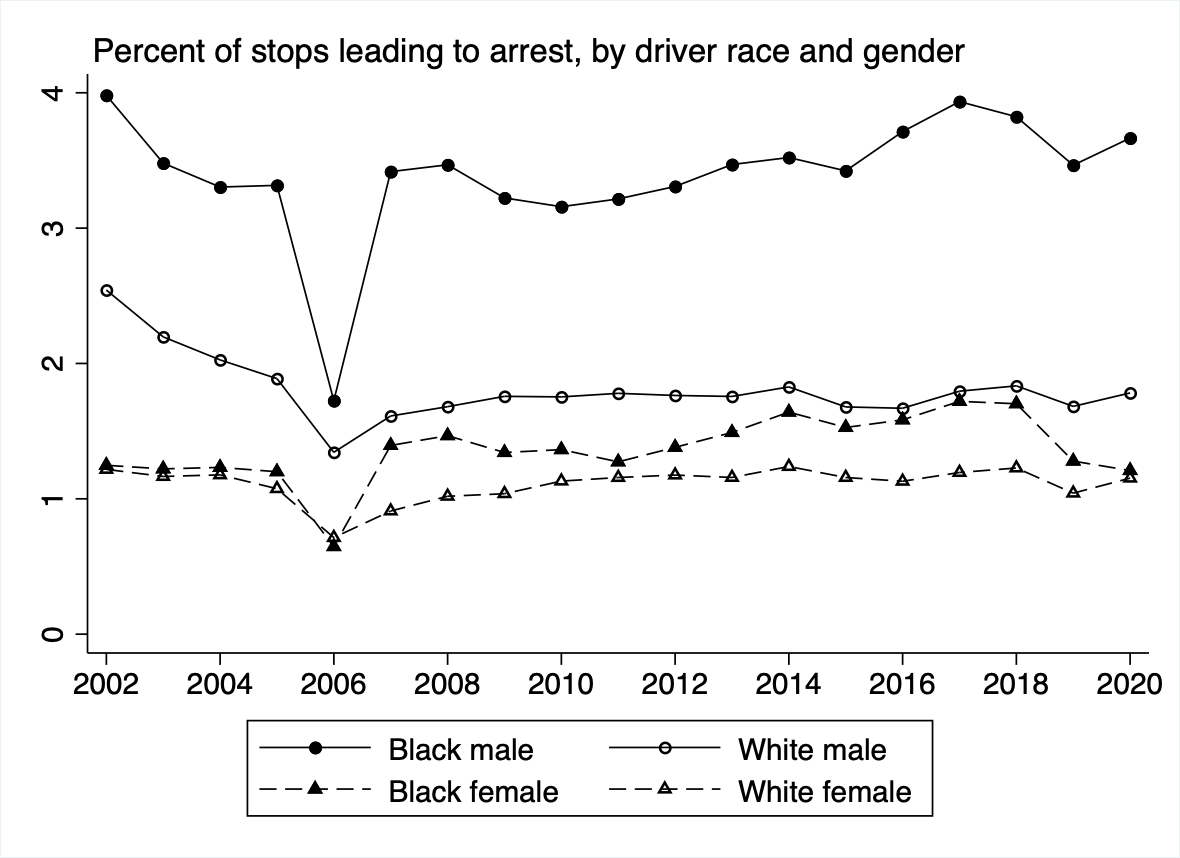
Figure 5 shows the percent of traffic stops that result in an arrest for each respective race and gender grouping, from 2002-2020. Across the board, arrest rates are consistently very low, at under 5% for all categories across the time period. Black males are arrested at the highest rate, and white males are arrested at roughly half the rate. Females, regardless of race, are arrested at lower rates than males, with black females being arrested at a marginally higher rate. The arrest rates for all race and gender groupings have stayed relatively steady over the time period, with no significant divergence from the trend other than in 2006, when arrest rates dropped more sharply. This is a result of incomplete arrest data for the year.
Figure 6. Percent of searches resulting in contraband, by race-gender category
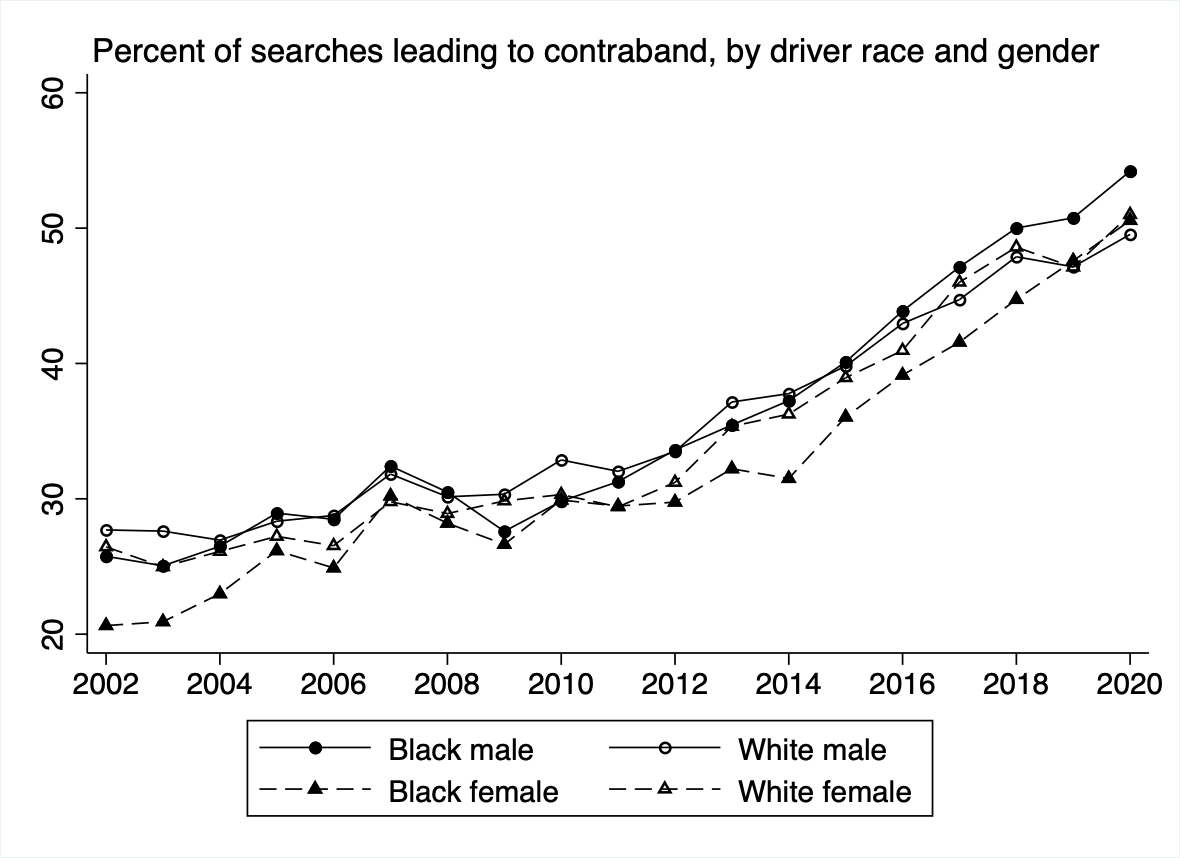
Figure 6 shows the percent of searches that result in the finding of contraband for each respective race and gender grouping, from 2002-2020. Across the time period, there is a clear upward trend in contraband hits per search. In 2002, the rate of contraband discovery was between 20% and 30% for all categories, and this steadily increased until 2020, in which contraband was discovered between 45% and 55% of searches. The percent of searches leading to contraband is extremely similar for each of the race and gender categories, increasing at an effectively identical rate across the time period.
Figure 7. Percent of searches resulting in contraband and arrest, by race-gender category
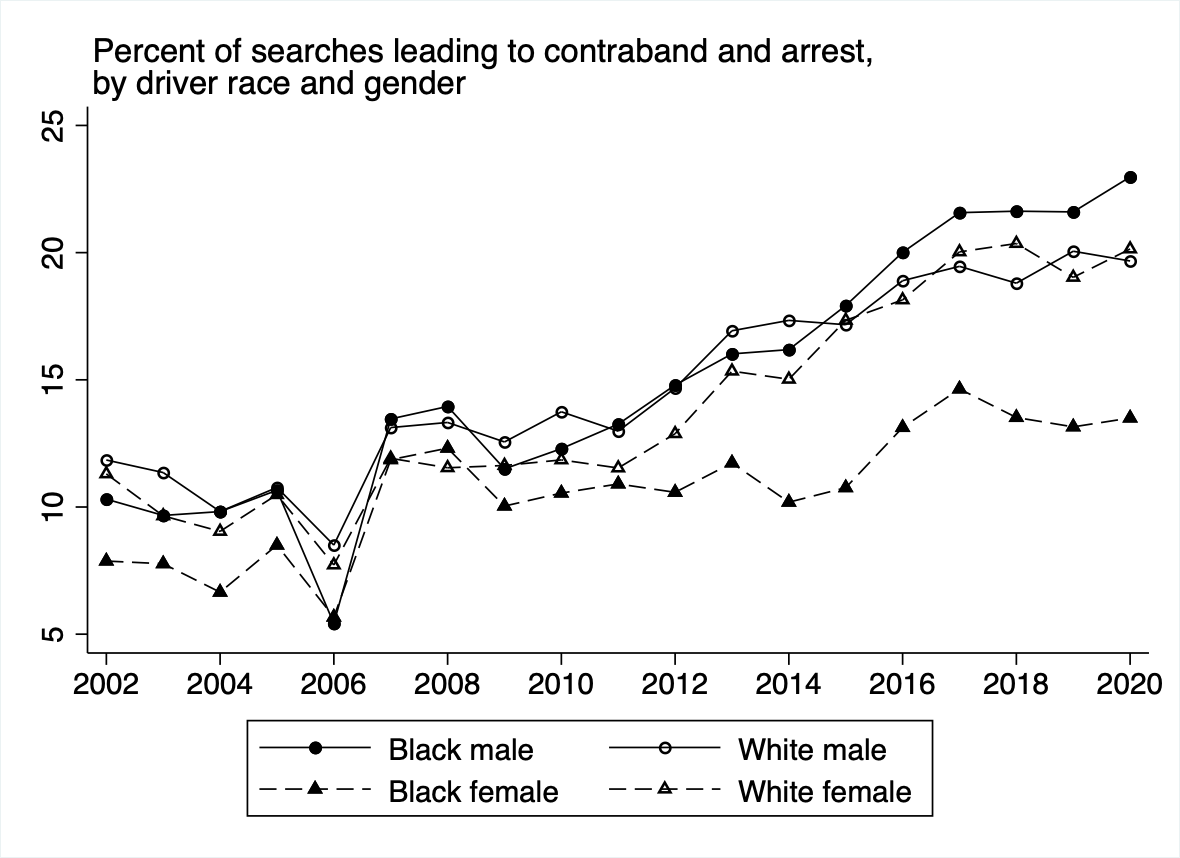
Figure 7 shows the percent of searches that resulted in the discovery of contraband and an arrest for each respective race and gender grouping, from 2002-2020. Note that in many instances, contraband hits do not lead to arrest due to it being found in small amounts. As seen in the Figure, the rate of contraband hit and arrest per search has steadily increased across the time period for all categories. Black males, white males, and white females all have maintained similar rates, increasing from a roughly 10% rate of contraband and arrest per search to a rate of roughly 20%. The rate for black females has also increased over the time period, but to a lesser degree, resulting in a significant gap between their outcomes and the rest of the gender/race categories by 2020, with only 15% of their searches resulting in contraband and arrest. The percent of searches leading to contraband and arrest sharply dropped in 2006, and this is a result of incomplete arrest data.
Figure 8. Percent of stops resulting in contraband and arrest, by race-gender category

Figure 8 shows the percent of stops that resulted in the discovery of contraband and an arrest for each respective race and gender grouping, from 2002-2020. The rates are very low for each category. White males, white females, and black females all have rates of less than 0.5% across the time period with very little variation. The rates for black males have increased slightly, from 0.8% of stops in 2002 to 1.5% of stops in 2020 resulting in contraband and arrest. Overall, for all race and gender categories, traffic stops are overwhelmingly unlikely to result in contraband and arrest. The percent of stops leading to contraband and arrest for black males sharply dropped in 2006, and this is a result of incomplete arrest data.
Figure 9. Percent of consent searches resulting in contraband and arrest, by race-gender category
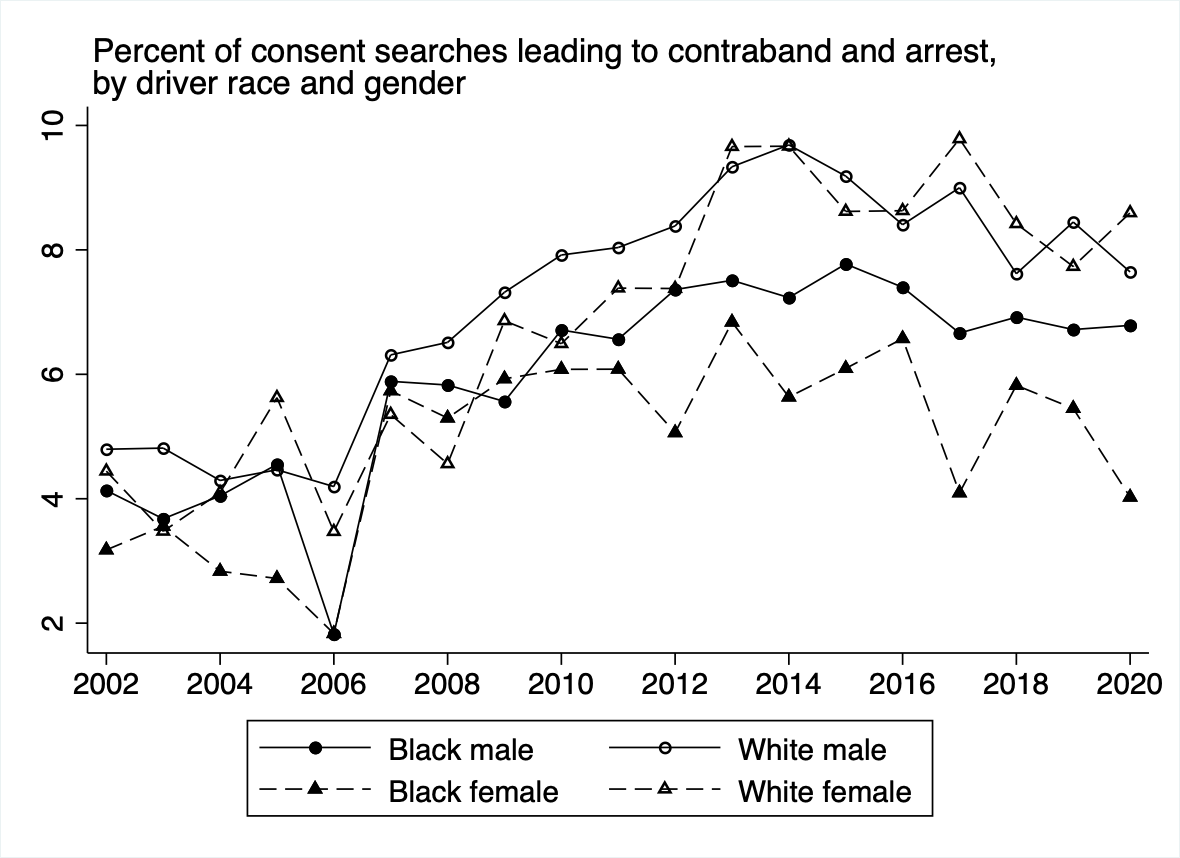
Figure 9 shows the rate of a contraband hit and an arrest for consent searches of each respective race and gender grouping, from 2002-2020. Consent searches are warrantless searches in which the stopped person gives permission (either verbal or written, varying by department) to the officer to search their vehicle. The percent of consent searches resulting in contraband and arrest have increased for each of the respective categories across the time period, except for black females. In 2002, the rates for all categories were quite similar, ranging from 3-5%. In 2020, consent searches of white males and white females result in contraband and arrest roughly 8% of the time. Consent searches of black males result in contraband and arrest 6% of the time. The rate for black females did not increase significantly across the time period, and is the lowest of all categories at about 4% in 2020. The percent of consent searches leading to contraband and arrest sharply dropped in 2006, and this is a result of incomplete arrest data.
Figure 10. Percent of probable cause searches resulting in contraband and arrest, by race-gender category
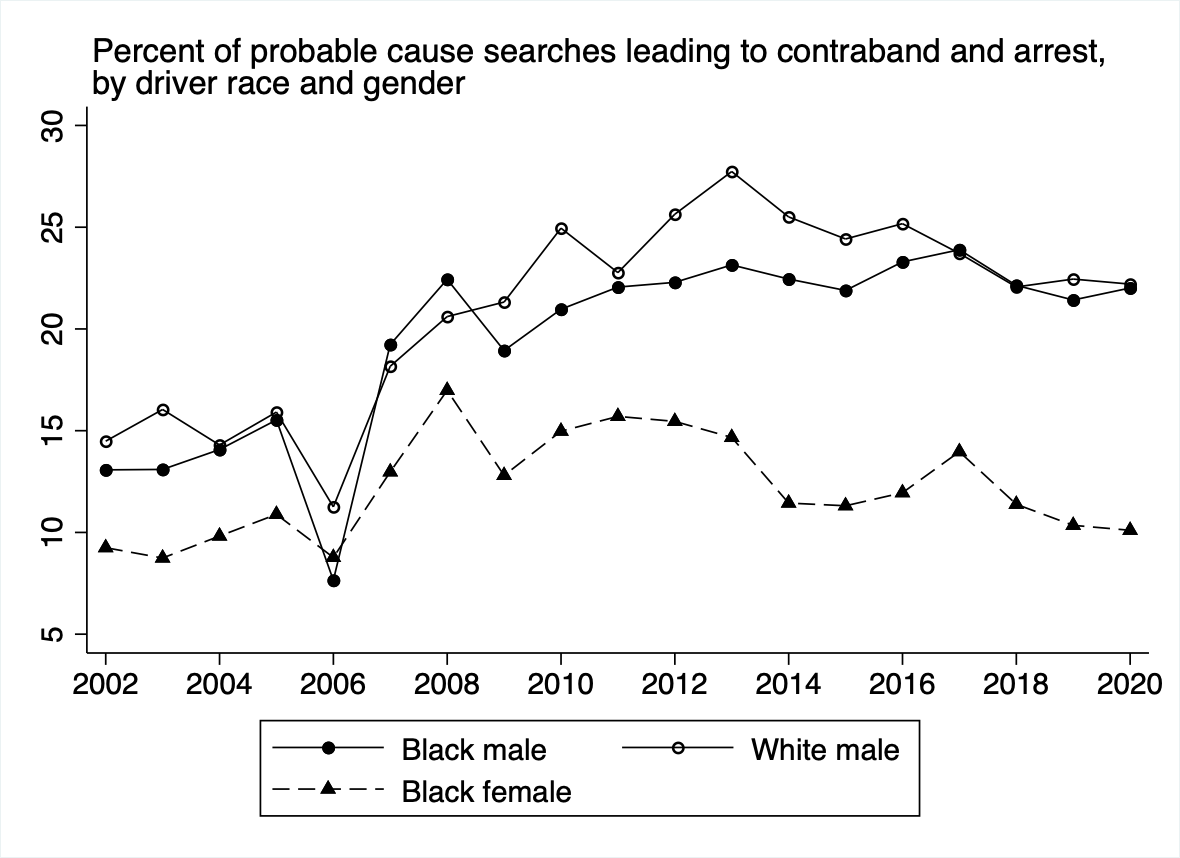
Figure 10 shows the rate of discovery of contraband and an arrest for consent searches of each respective race and gender grouping, from 2002-2020. The Figure does not include white females because there is insufficient data. A probable cause search is a warrantless search of the vehicle which can be conducted if the officer reasonably believes that the person has committed a crime. The searched person does not have to consent to a probable cause search for it to be conducted. The Figure shows that across the time period, a majority of probable cause searches do not result in contraband or arrest. The rate of a contraband hit and an arrest from a probable cause search for black males and white males increased slightly from 2002-2020, from roughly 15% to 20%. Probable cause searches of black females result in contraband and arrest at a lower rate, and there was not much growth in this percentage across the time period. In both 2002 and 2020, the probable cause searches yielded contraband and an arrest roughly 10% of the time. The percent of probable cause searches leading to contraband and arrest sharply dropped in 2006, and this is a result of incomplete arrest data.
Figure 11. Percent of contraband hits resulting in arrest, by race-gender category
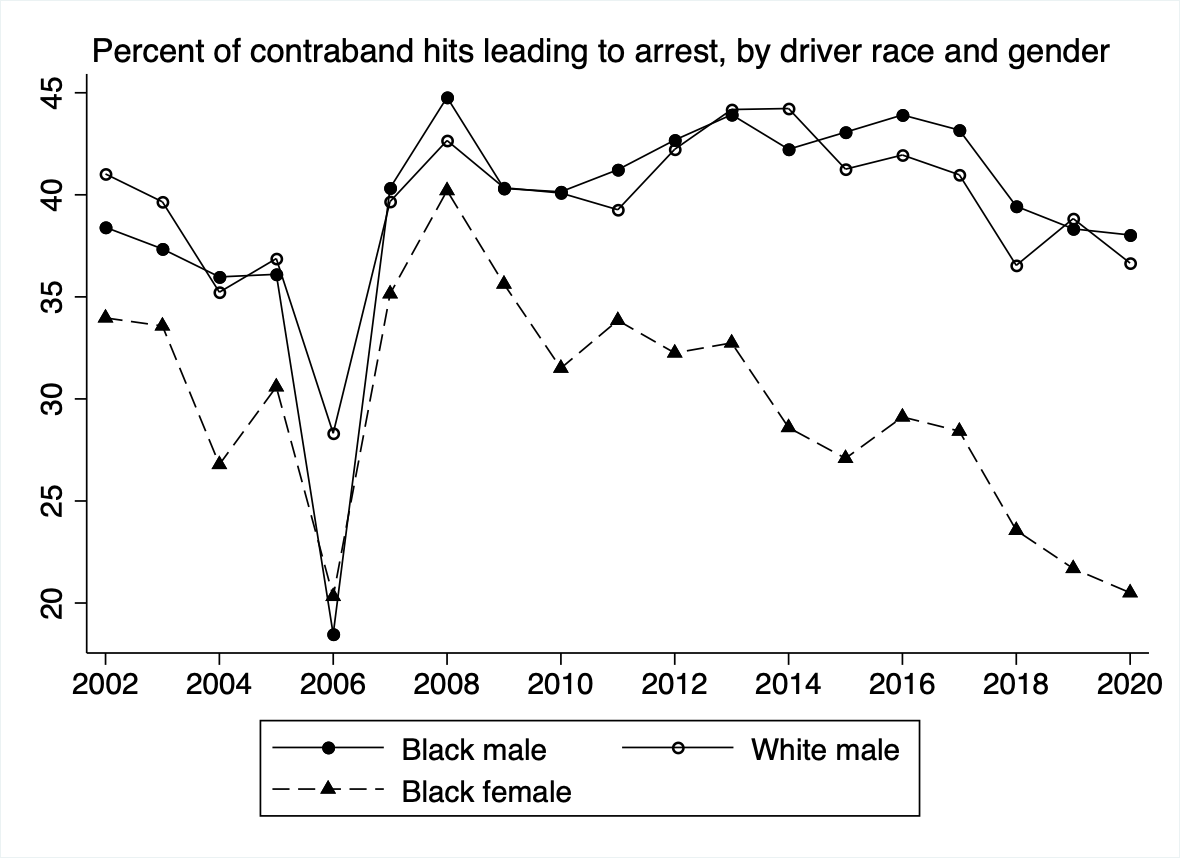
Figure 11 shows the percentage of contraband hits that result in an arrest for each respective race and gender grouping, from 2002-2020. The Figure does not include white females because there is insufficient data. The Figure indicates that a majority of contraband hits do not result in arrests. This is explained by the fact that the contraband is often found in very small amounts. Black and white males are arrested at similar rates across the time period, at roughly 40%, although there is significant variation on a year to year basis. Black females are arrested in a lower percentage of contraband hits, and this rate of arrests to contraband hits has decreased from 2002 to 2020, from around 35% to 20%. There is a dramatic decrease in arrest rates in 2006, and this is a result of incomplete arrest data for this year.
Figure 12. Black-White Ratio of search rates and arrest rates, for males
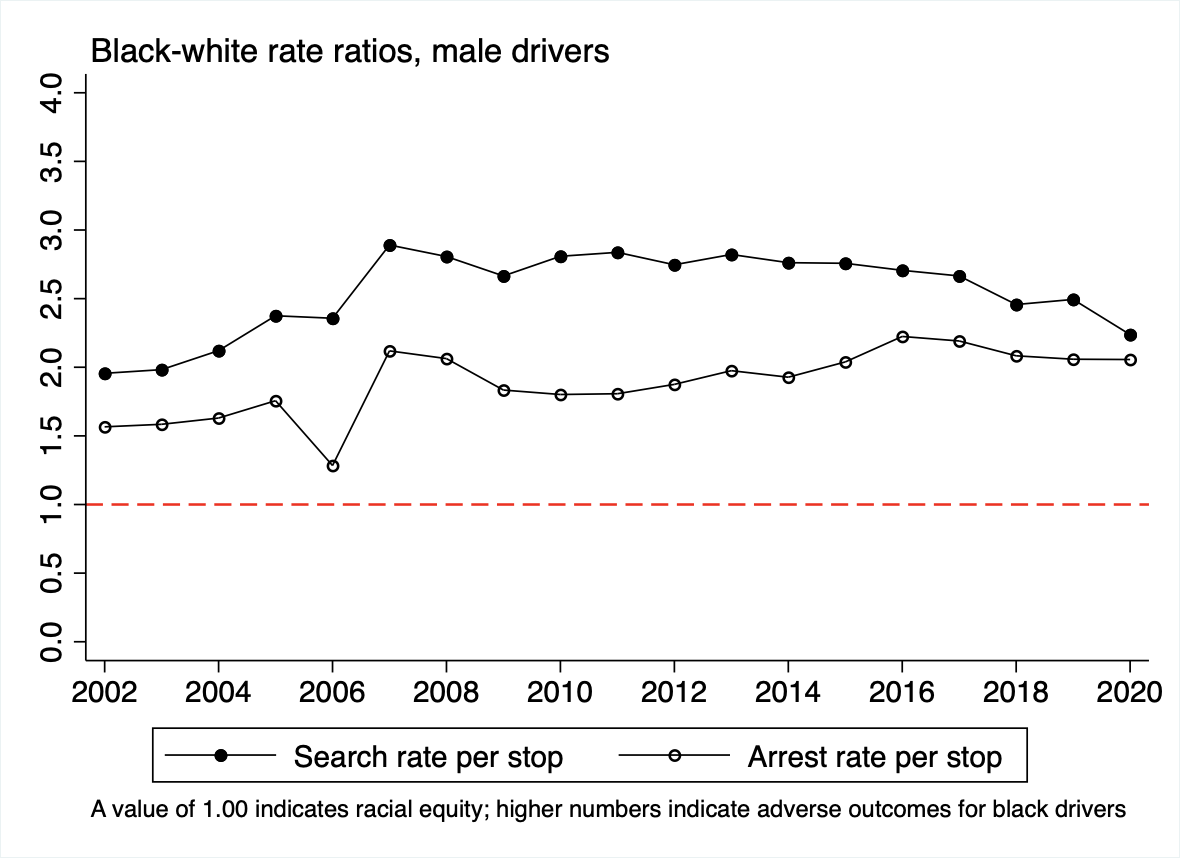
Figure 12 compares the search rate and arrest rate of black males and white males from 2002-2020. The search rate ratio is the search rate of black males divided by the search rate of white males, while the arrest rate ratio is the arrest rate of black males divided by the arrest rate of white males. A search rate ratio of 1.0 would indicate that black and white males are both searched in an equal percentage of their respective traffic stops. This similarly applies for the arrest rate ratios. Across the time period, the search rate ratio is consistently at 2.0 or higher, peaking at 2.9 in 2007. This means that black males are searched much more frequently than white males. The arrest rate ratio is on average lower, at around 1.5 across the time period. This means that black males are arrested at a greater rate than white males, but not to the degree that they are disproportionately searched. There is a sharp decrease in arrest rate ratio in 2006, and this is a result of incomplete arrest data for this year.
Figure 13. Black-White Ratio of search rates and arrest rates, for females
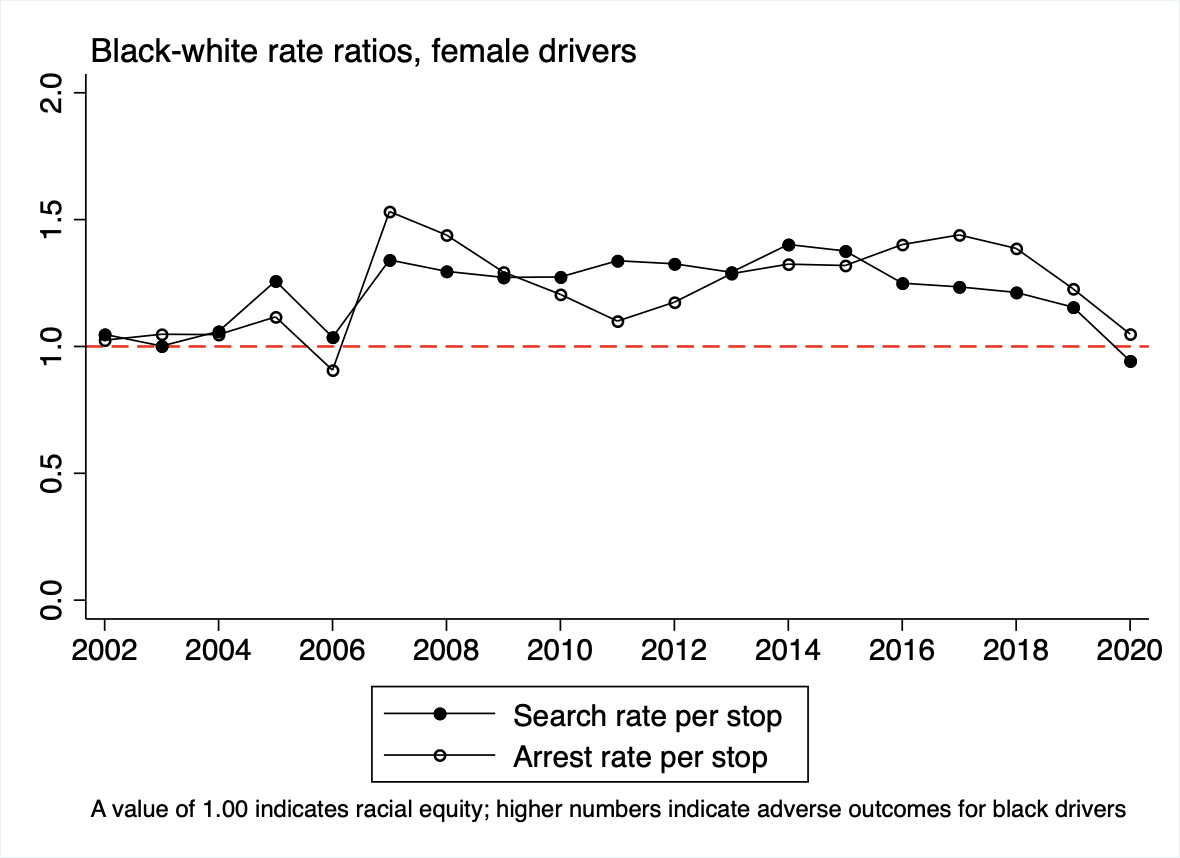
Figure 13 compares the search rate and arrest rate of black females and white females from 2002-2020. The search rate ratio is the search rate of black females divided by the search rate of white females, while the arrest rate ratio is the arrest rate of black females divided by the arrest rate of white females. A search rate ratio of 1.0 would indicate that black and white females are both searched in an equal percentage of their respective traffic stops. The search rate ratio and arrest rate ratio are relatively similar across the time period, ranging from 1.0 to 1.5. This indicates that black females are searched and arrested at a marginally higher rate than white females, and there is not a significant racial disparity between search rates and arrest rates. In both 2002 and 2020, both the search rate ratio and arrest rate ratio are roughly 1.0, indicating equitable traffic stop outcomes for white and black females.
Figure 14. Summary of stops by hour over the week: Stops, percent safety-related, percent ending in citation, search, and arrest
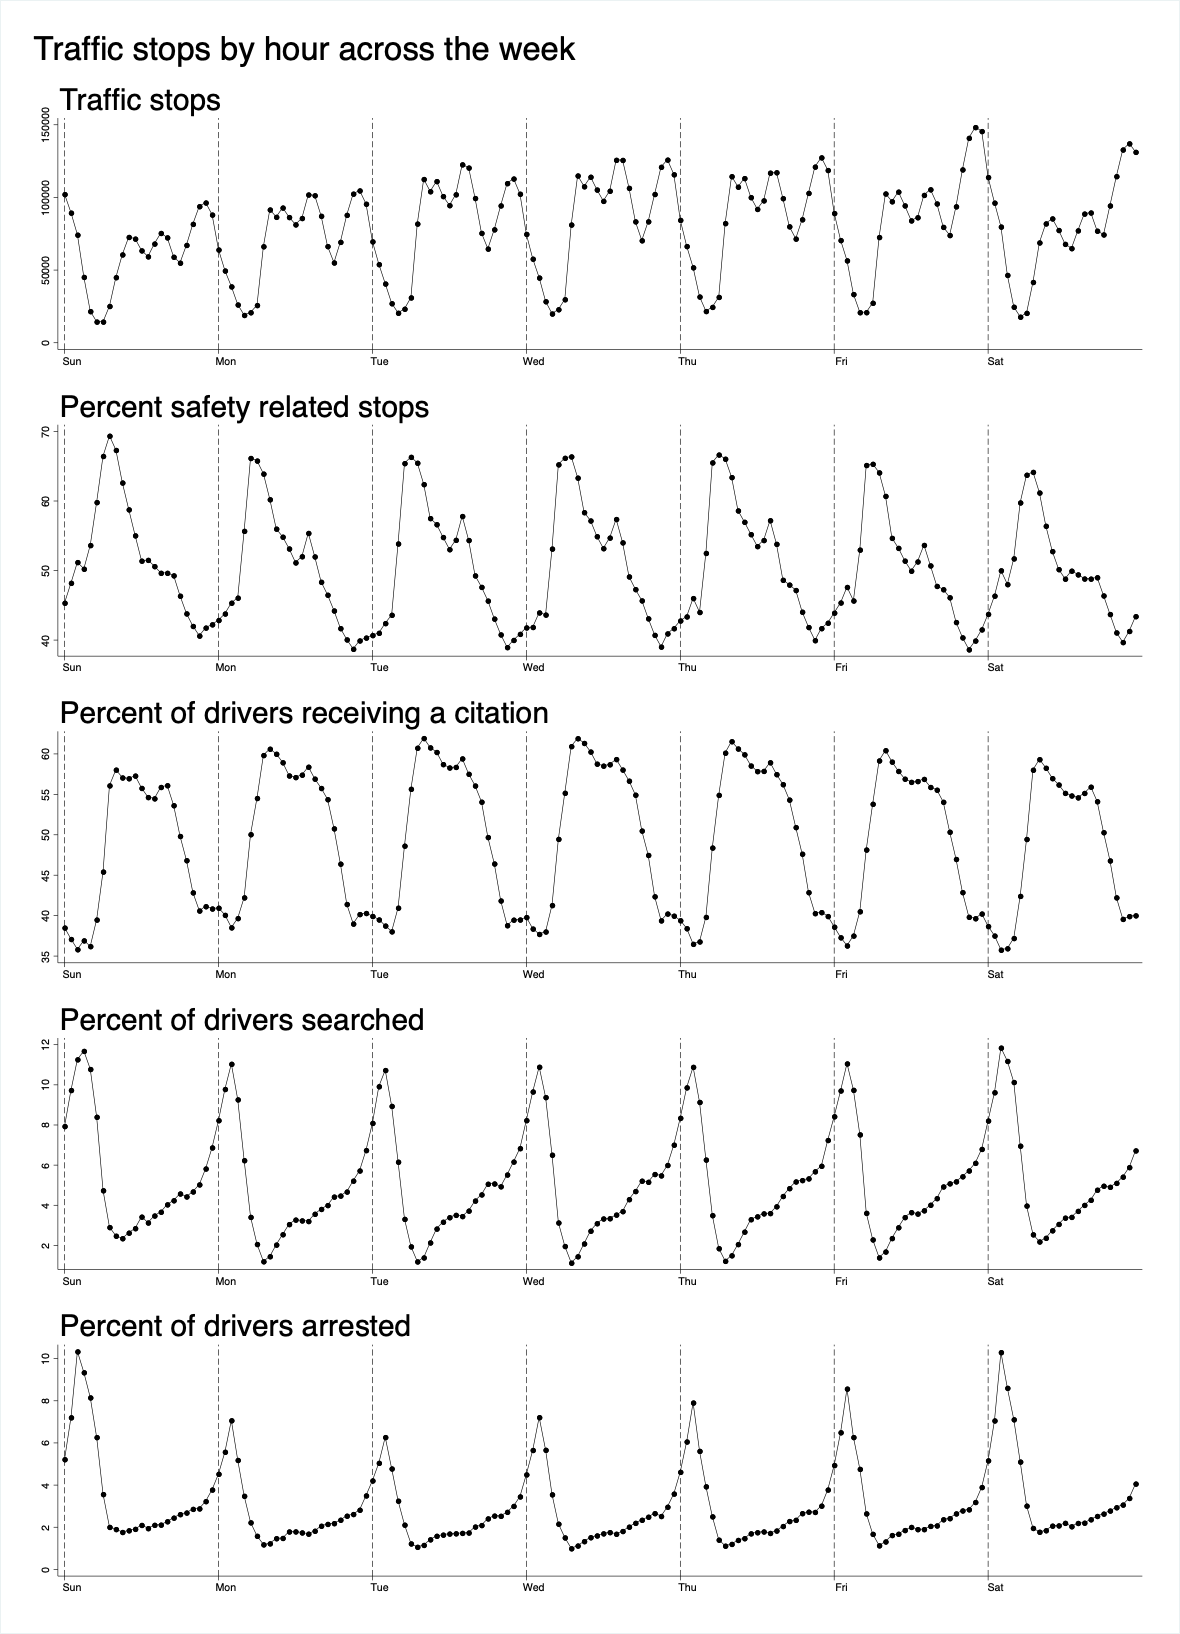
Figure 14 displays the number of traffic stops, the percent of safety related stops, the percentage of drivers receiving a citation, the percentage of drivers searched, and the percentage of drivers arrested across the hours of the week. The Figure indicates that there is not much variation between the days of the week in regard to these measures, and instead shows that the variation is seen within the hours of the day. There are a few noticeable trends throughout the week, however. Stops increase on Friday nights and Saturday nights, and search and arrest rates are slightly higher in the very early morning (directly after midnight) on Saturdays and Sundays.
Figure 15. Summary of stops by hour over the day: Stops, percent safety-related, percent ending in citation, search, and arrest
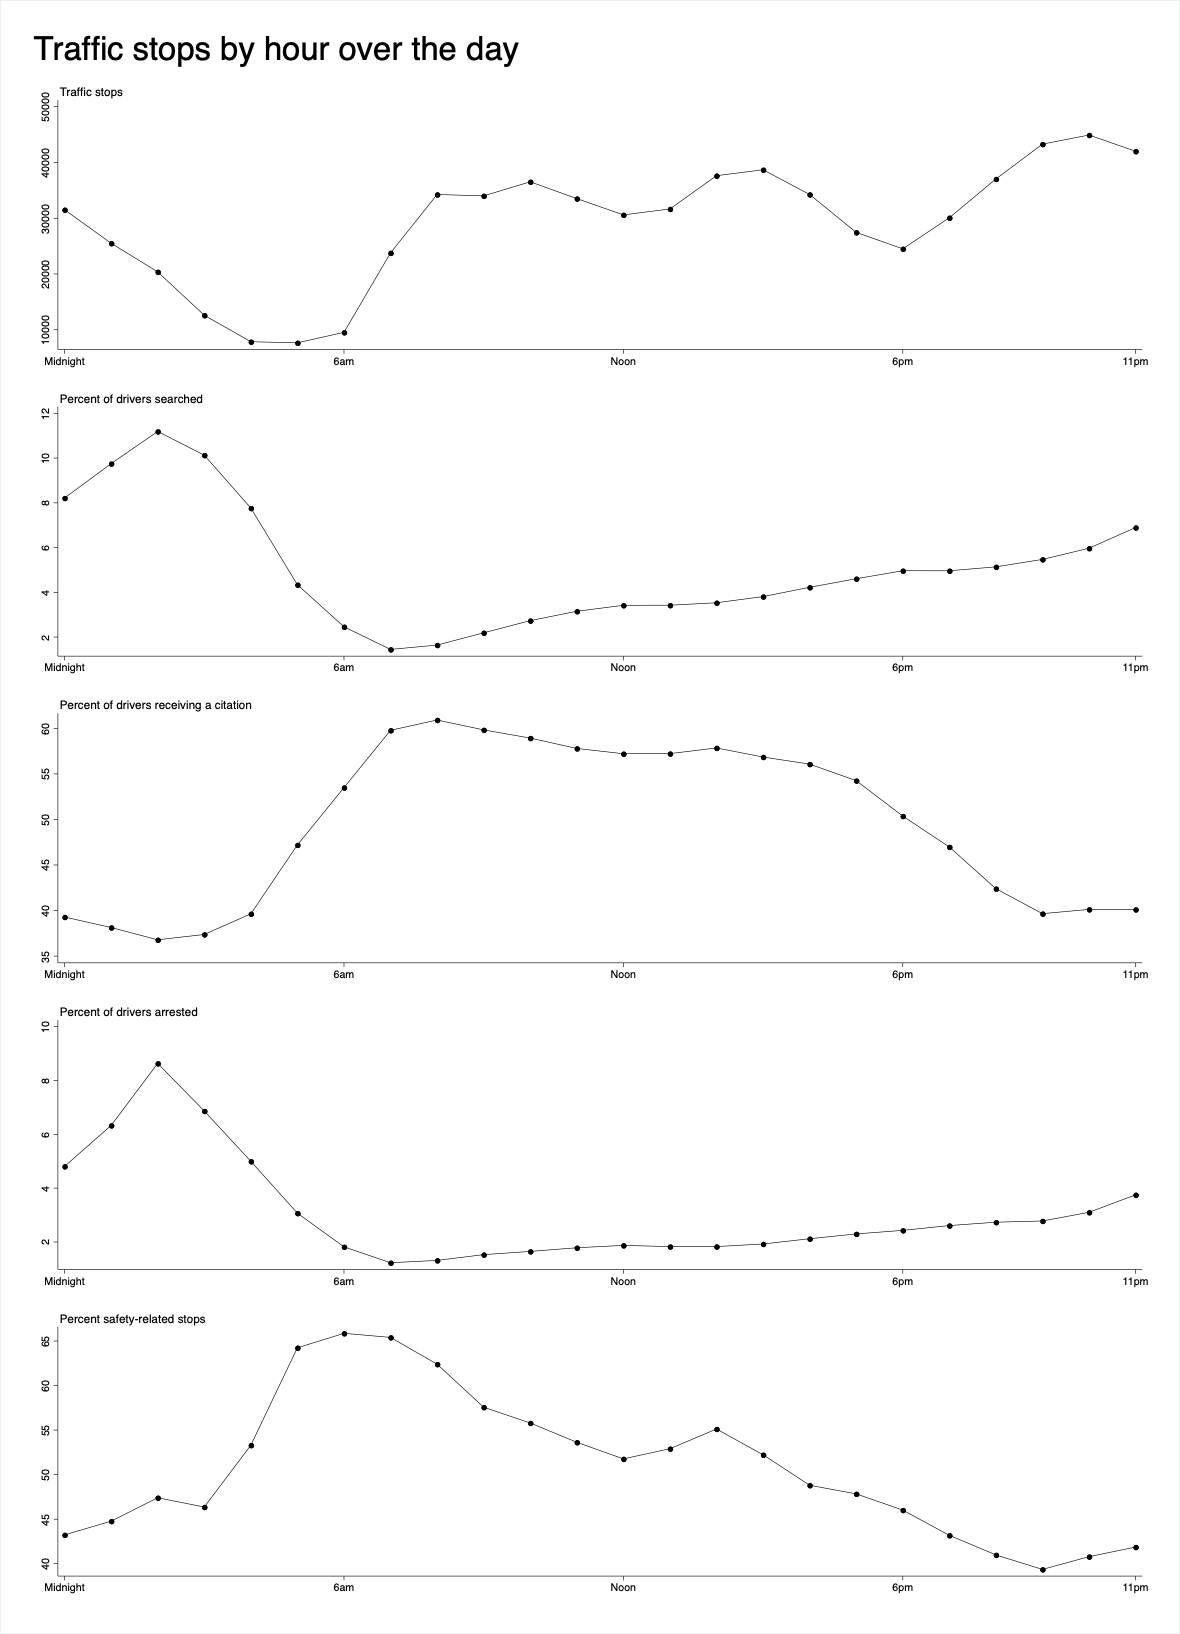
Figure 15 displays the number of traffic stops, the percent of safety related stops, and the percent of drivers searched, given a citation, and arrested by hour of day. There are a number of clear trends indicated in the Figure. The frequency of a traffic stop is lowest in the early hours of the morning, from around 4 to 6AM. The number of traffic stops increases until 8AM, at which the frequency is similar until around 6PM. For the rest of the evening until around 11PM, the number of traffic stops increases to the highest frequency, and at this point the number begins to decrease again.
The percentages of drivers searched and arrested both have a similar trend across the time of day. Drivers are both searched and arrested at the highest rate in the few hours after midnight, and then these rates of search and arrest decrease dramatically until 6AM. After 6AM, the rate of both search and arrest is maintained at extremely low percentages until it begins to increase at 10PM.
The percentage of drivers receiving a citation follows an opposite trend of search and arrest rates. The rate of citations given is at its lowest from 9PM to 3AM, and then in the following hours steadily increases to a consistent rate which is maintained until around 5PM.
The percent of safety-related stops varies throughout the day, reaching its highest point at 6AM and then steadily decreasing for the rest of the day until a minimum is reached in the hours around midnight. From midnight to 6AM the rate increases, with dramatic increases in the percentage of safety-related stops indicated from 3AM to 5AM.
Figure 16. Hourly breakdown of percent of stops by race-gender category
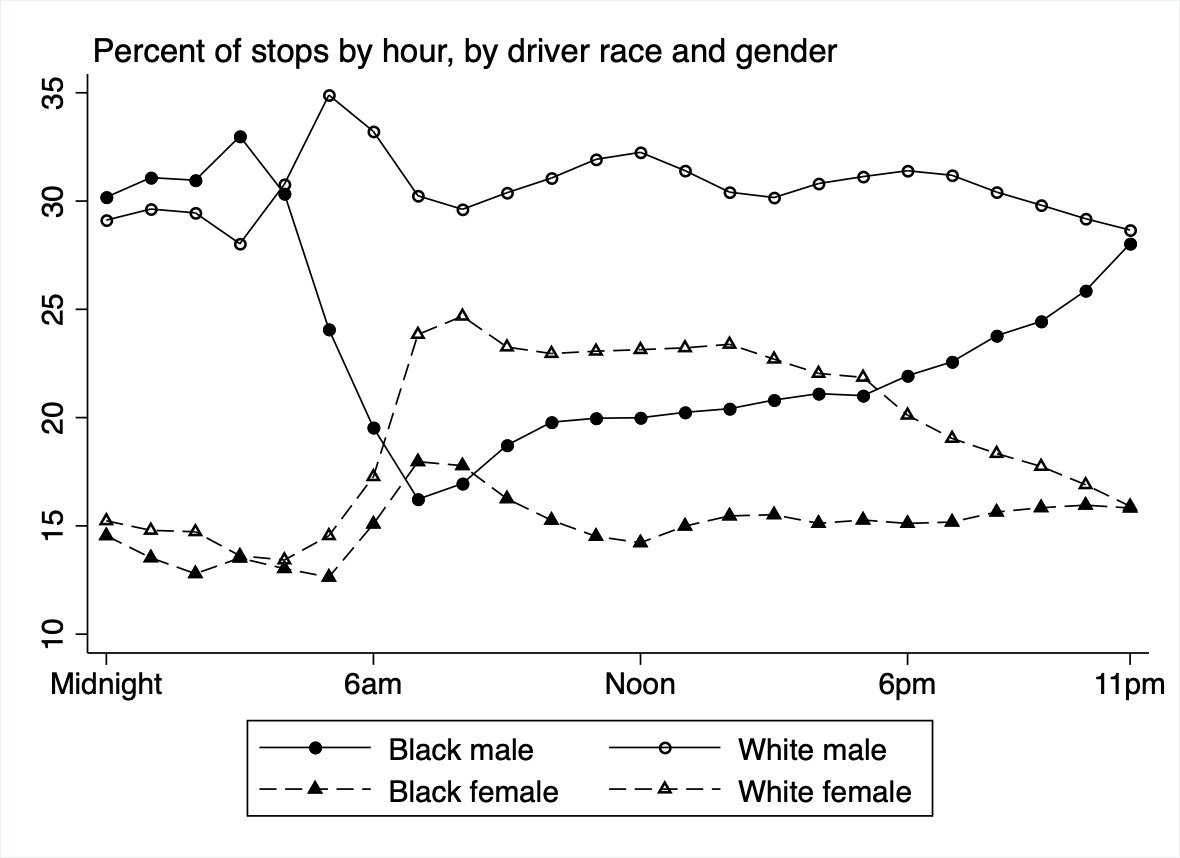
Figure 16 displays the share of overall stops represented by the respective race and gender categories by hour of day. The Figure indicates that black males are much more likely to be stopped during the nighttime hours directly before and after midnight than they are to be stopped during the daytime. At 3AM, black males reach a high of 33% of those that are pulled over, and by 7AM their share of stops decreases to 16%, and stays at a much lower proportion of stops throughout the daytime hours. White males, in contrast, make up a relatively consistent share of the overall traffic stops throughout the day. There are no significant variations during the daytime or nighttime. Black females and white females consistently make up a lower share of the total traffic stops by hour of the day. Black females make up a relatively consistent share of traffic stops throughout the day, while white females represent a greater percentage of stops during the daytime hours than during the nighttime hours.
Figure 17. Hourly breakdown of percent of stops related to traffic safety, by race-gender category
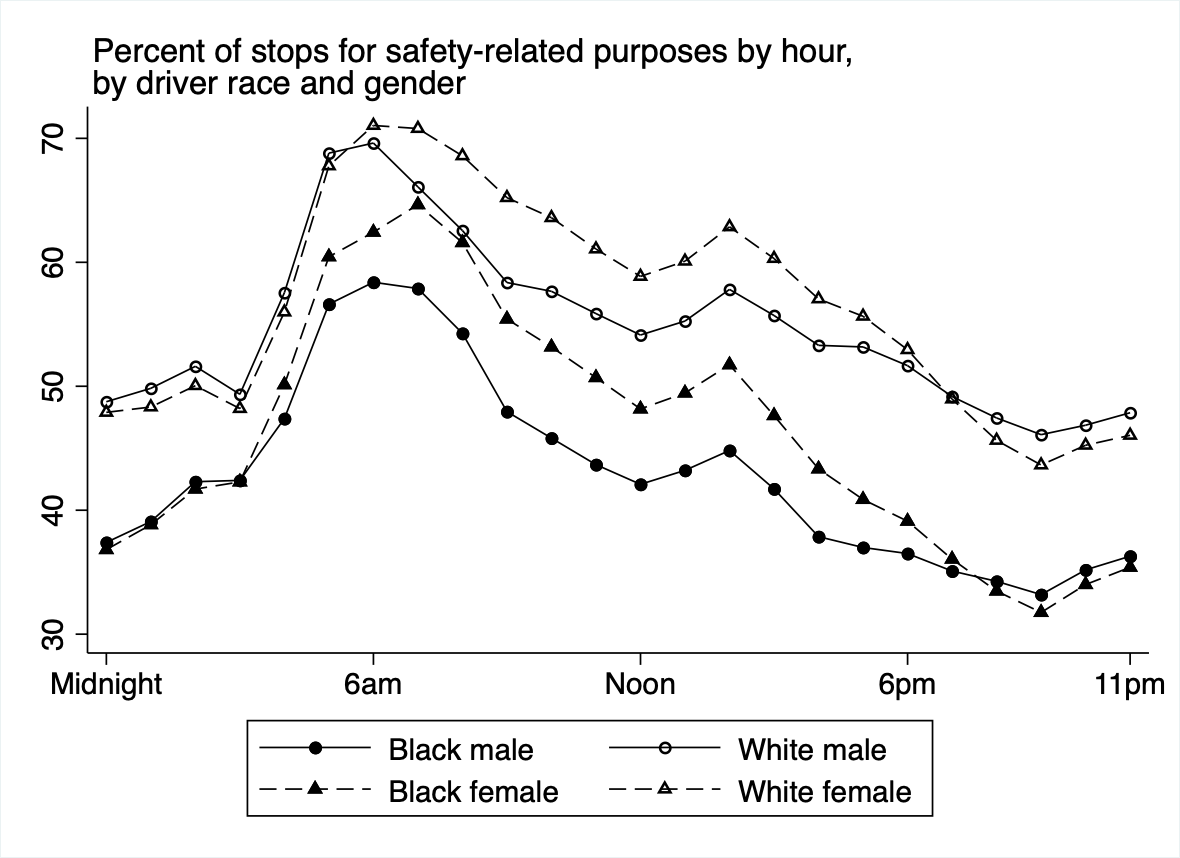
Figure 17 displays the percentage of stops that are for safety-related purposes for each race and gender category, by hour of the day. Safety-related purposes refer to traffic stops that are meant to prevent moving violations, and effectively keep the road safe. Stops that are not safety-related are often used for investigatory purposes, in which case the officer is generally seeking to conduct an informal criminal investigation of the driver. As evidenced in the Figure, black males are much less likely to be stopped for safety-related purposes than white males throughout the course of the day. In turn, this means that black males are more likely to be subjected to investigative stops that are not for moving violations. These stops are most common during the nighttime hours, when the percentage of safety-related stops are lowest. This pattern also applies for black females as compared to white females. At any given hour of the day, black drivers are significantly more likely to be stopped for a non safety-related purpose than white drivers.
Figure 18. Hourly breakdown of percent of stops resulting in search, by race-gender category
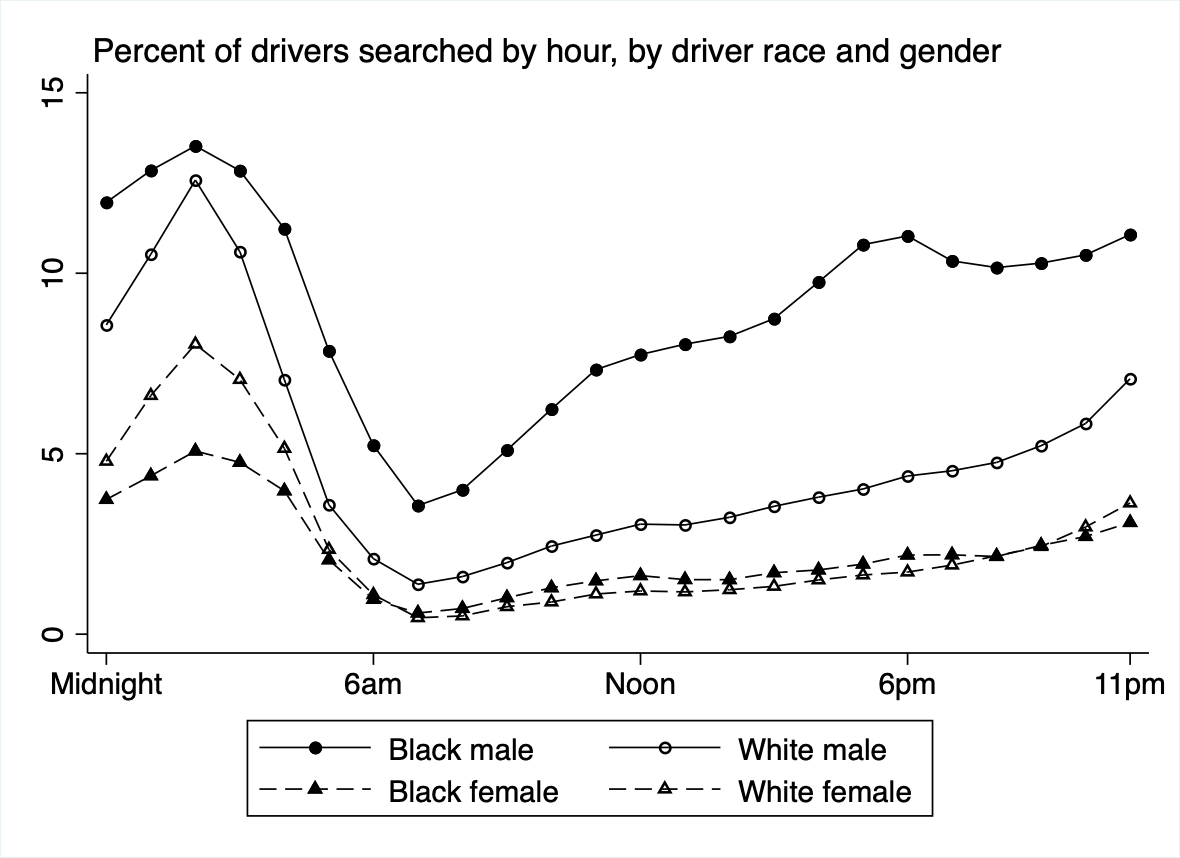
Figure 18 displays the percentage of traffic stops which result in a search for each race and gender category, by hour of the day. Black males are searched at the highest rate regardless of time of day, but the time of day does play a role in the rate at which they are searched. During the nighttime hours before and after midnight, black males are most likely to be searched during a traffic stop, and this search rate decreases during the daytime hours. This pattern applies for all of the gender and race categories. During daytime hours, however, black males are still significantly more likely to be searched than other race and gender categories. Throughout the day, white males are searched at a lower rate than black males, and females, regardless of race, are searched at a lower rate than males. The Figure also indicates that a majority of stops do not result in a search regardless of race and gender category or time of day.
Figure 19. Hourly breakdown of percent of stops resulting in arrest, by race-gender category
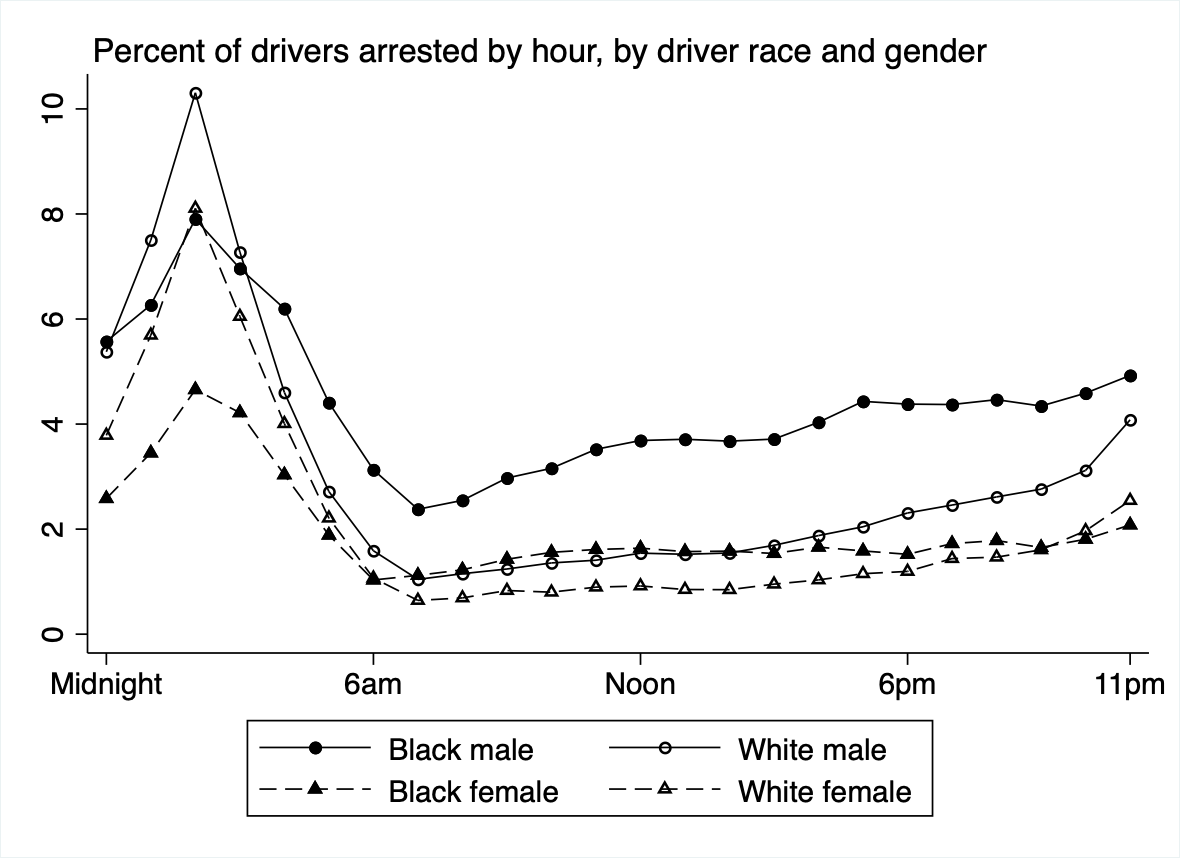
Figure 19 displays the percentage of traffic stops which result in an arrest for each race and gender category, by hour of the day. For all categories, drivers are more likely to be arrested during nighttime hours, specifically the hours directly after midnight. Stops are most likely to result in an arrest at 2AM. During the hours directly after midnight , white males are more likely to be arrested than black males, but this trend is reversed as the day progresses. Black males are significantly more likely to be arrested than white males from 4AM until 11PM, which constitutes a large majority of the day. The Figure also indicates that a large majority of stops do not result in an arrest regardless of race and gender category or time of day.
Figure 20. Number of stops by officer
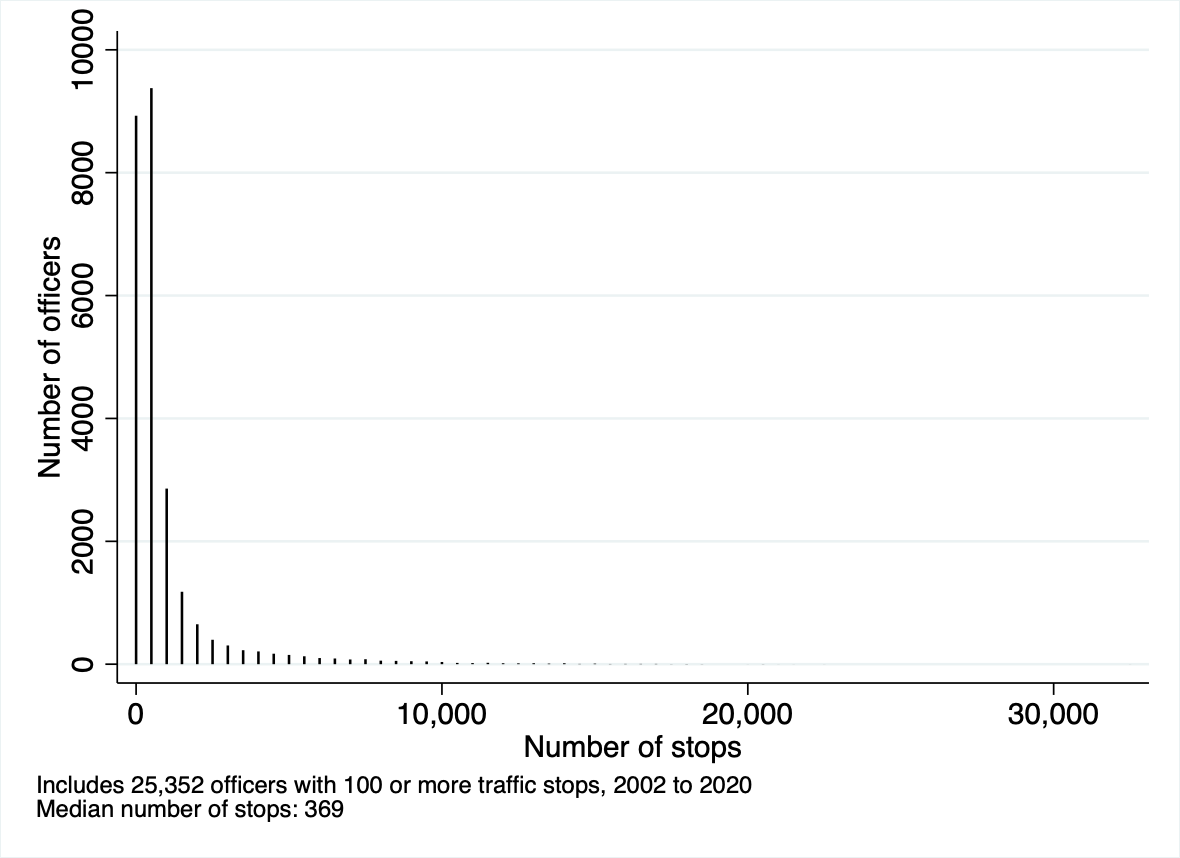
Figure 20 displays the distribution of number of stops by officer across the 2002-2020 time period. All officers displayed have over 100 traffic stops. Roughly 21,000 of the 25,352 officers included in the data have less than 1500 traffic stops.
Figure 21. Percent black of drivers pulled over by officer
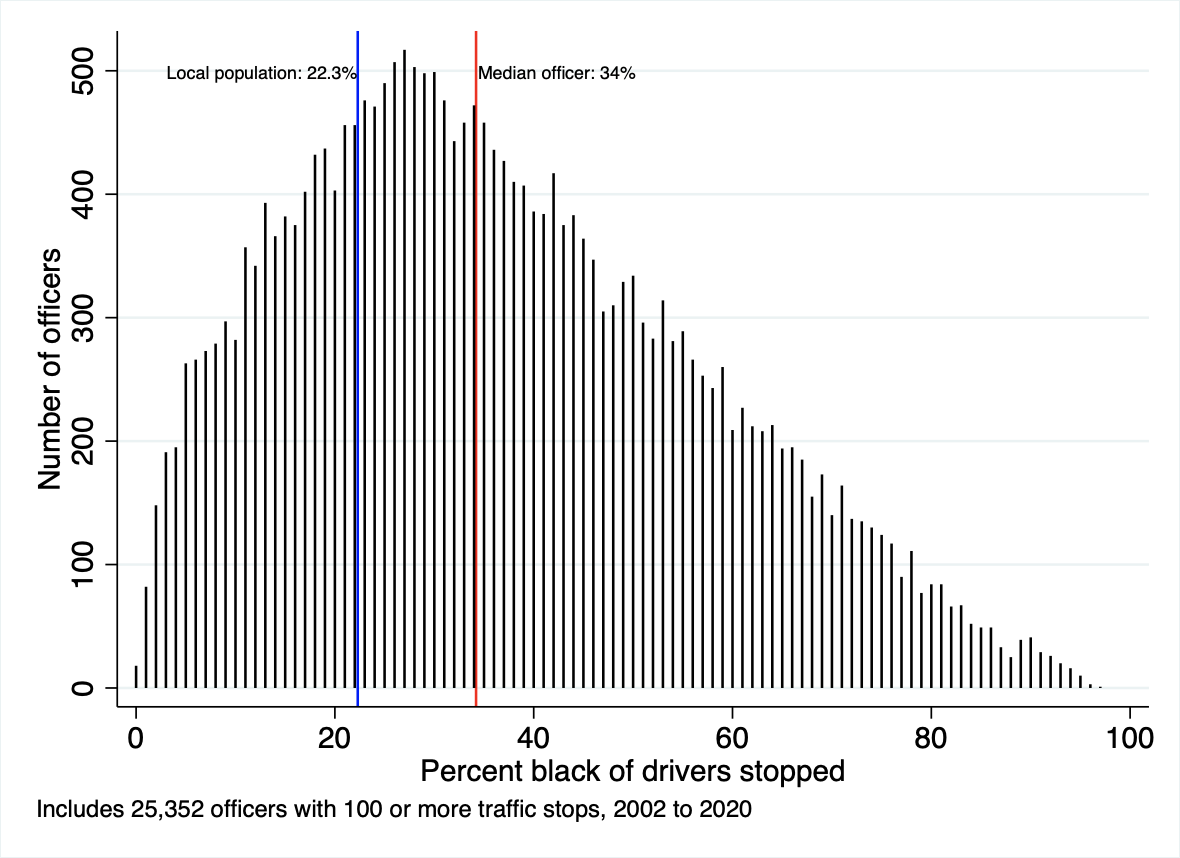
Figure 21 displays the percentage of stopped drivers that are black for individual officers across North Carolina police departments, from 2002-2020. The distribution includes officers with greater than 100 traffic stops. For the median officer, 34% of stops are of black drivers, while black people only make up 22.3% of the population in the state. This means that a majority of officers are stopping black drivers at a rate disproportionate to their share of the population. This disparity between stop behavior and population data is often greater, with black drivers composing more than 50% of stops for a significant portion of officers. At the far right, the Figure shows that there are 1,155 officers whose mix of drivers stopped is more than 75% black.
Figure 22. Officer search rates by race
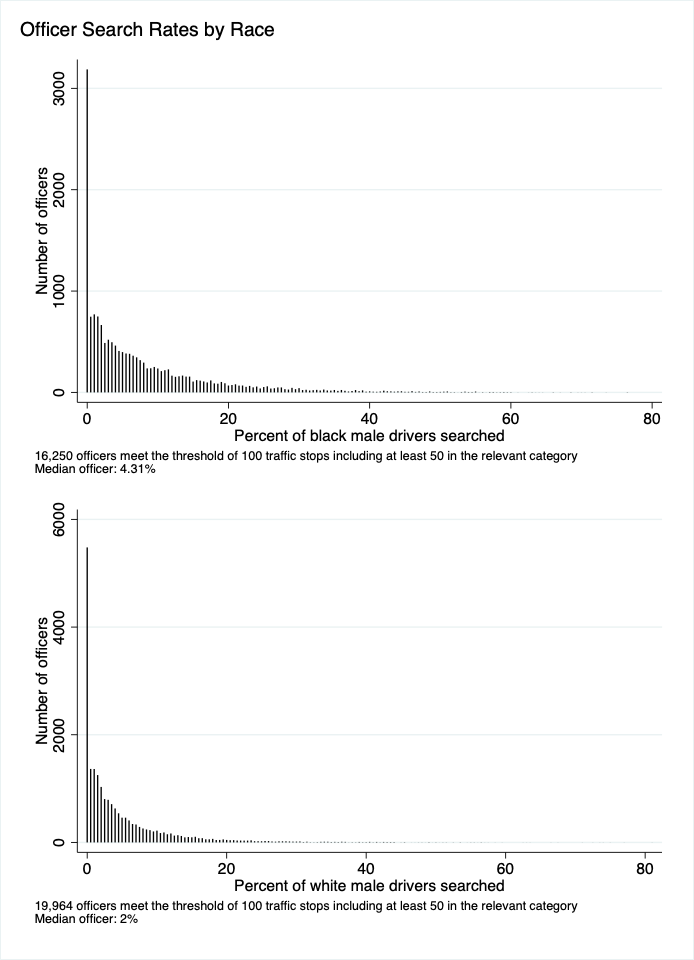
Figure 22 displays the search rates of individual officers for the given race and gender category. The criteria for an officer’s inclusion is 100 or more traffic stops, as well as at least 50 stops of the specified race and gender category, from 2002-2020. In the first graph, the median officer has a search rate of 4.31%, meaning that black male drivers are searched in 4.31% of traffic stops. Many officers search black drivers at rates that are significantly higher than this median value, meaning that searches occur more often for certain officers in traffic stops involving black males. For white male drivers, the median officer has a search rate of 2%. This indicates that the median officer in North Carolina is searching black males at a higher rate than they are searching white males.
Figure 23. Black-White Ratio of search rates by officer, for males
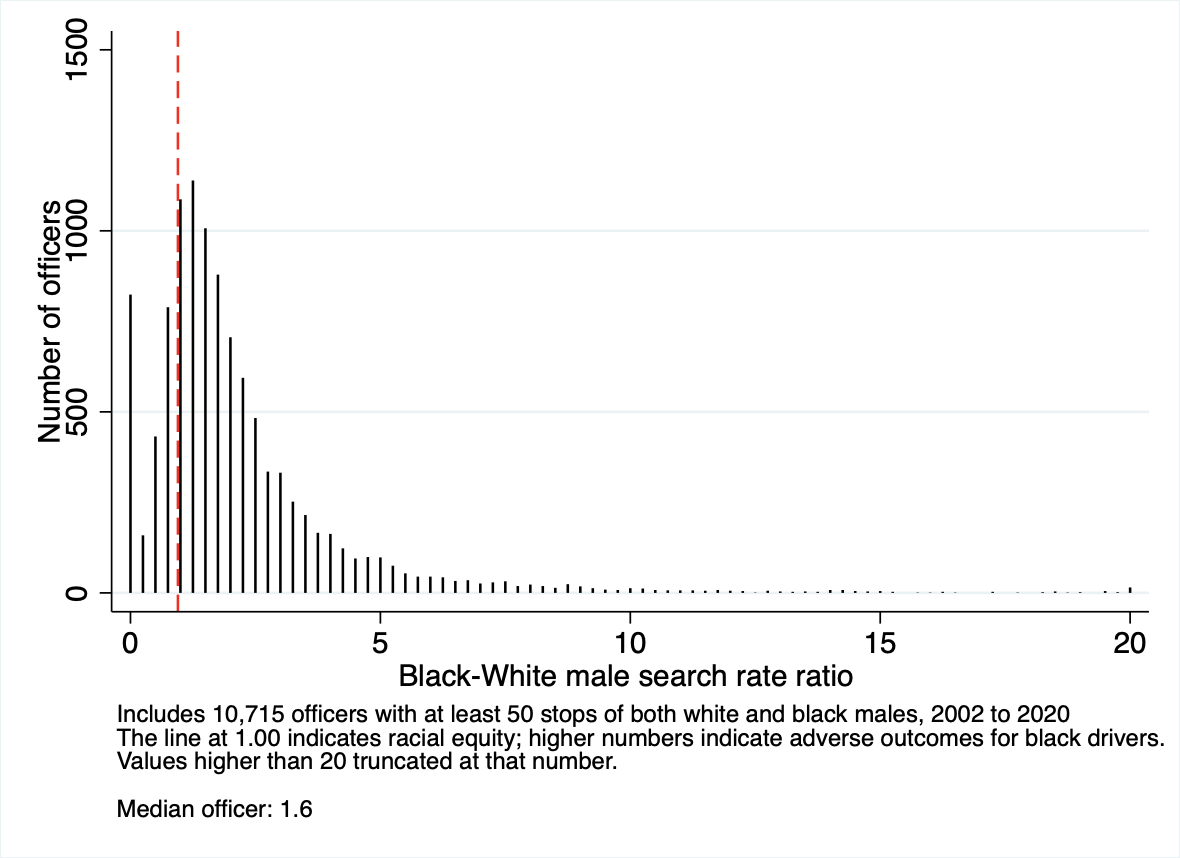
Figure 23 displays the distribution of black-white male search rate ratios across the officers which meet the criteria. The criteria for an officer’s inclusion is 50 traffic stops of both white males and black males, from 2002-2020. The “Black-white male search rate ratio” can be interpreted as an officer’s search rate of black male drivers divided by their search rate of white male drivers. An racially equitable outcome would therefore be 1, meaning that black and white male drivers are searched in an equal percentage of traffic stops. The median officer instead has a search rate ratio of 1.6, meaning that the median officer searches black male drivers at a higher rate than white male drivers. A significant number of officers have search-rate ratios that are much higher than the median, with some searching black male drivers at 5 or more times the rate of white male drivers.
Figure 24. Search rate versus hit rate by Officer
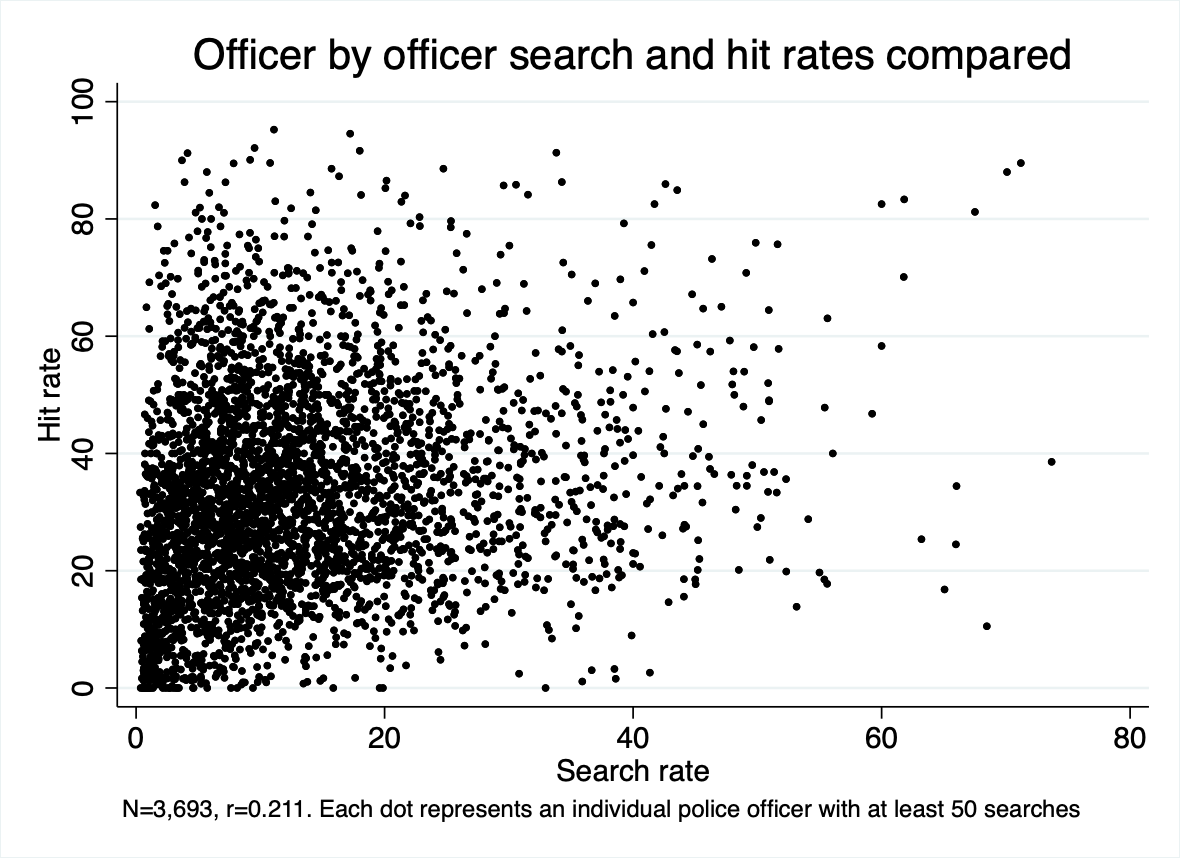
Figure 24 presents the hit rates and search rates of individual officers who meet the criteria. As evidenced by the low correlation, there is great variability in both the propensity of individual officers to search drivers and their success in finding contraband. One might expect that when officers have a high search rate but a low hit rate, that their supervisors would advise them to adjust their search rate in order to avoid so many fruitless searches. Similarly, for officers with low search rates but high hit rates, one might expect supervisors to instruct them to conduct more searches because they are being too cautious. Such a learning process would generate relative consistent hit rates; where officers are too high, they would be advised to do more searches, and where too low, to conduct fewer. The Figure shows clearly that this is not happening. Search and hit rates range from low to high, with a very low correlation between the two. Certain officers search drivers at extremely high rates but have very low hit rates, meaning that their threshold of suspicion is likely too low. Other officers search at a much lower rate and have very high hit rates, showing that their threshold of suspicion may be too high. Overall, the Figure shows that officers are not gravitating towards a single common range of hit rates. This suggests that the departments across North Carolina do not seem to hold their officers to a common standard of search rate success. Rather, each officer decides for him or herself how aggressive to be in searching, with virtually no guarantee that more searches will lead to lower hit rates, or that fewer searches will be targeted on those most likely to have contraband.