Suspect Citizens
What 20 Million Traffic Stops Tell Us About Policing and Race
Frank R. Baumgartner, Derek A. Epp, and Kelsey Shoub
Cambridge University Press, 2018
Winner, C. Herman Pritchett Best Book Award from the APSA Organized Section on Law and Courts, 2019
Data and Resources
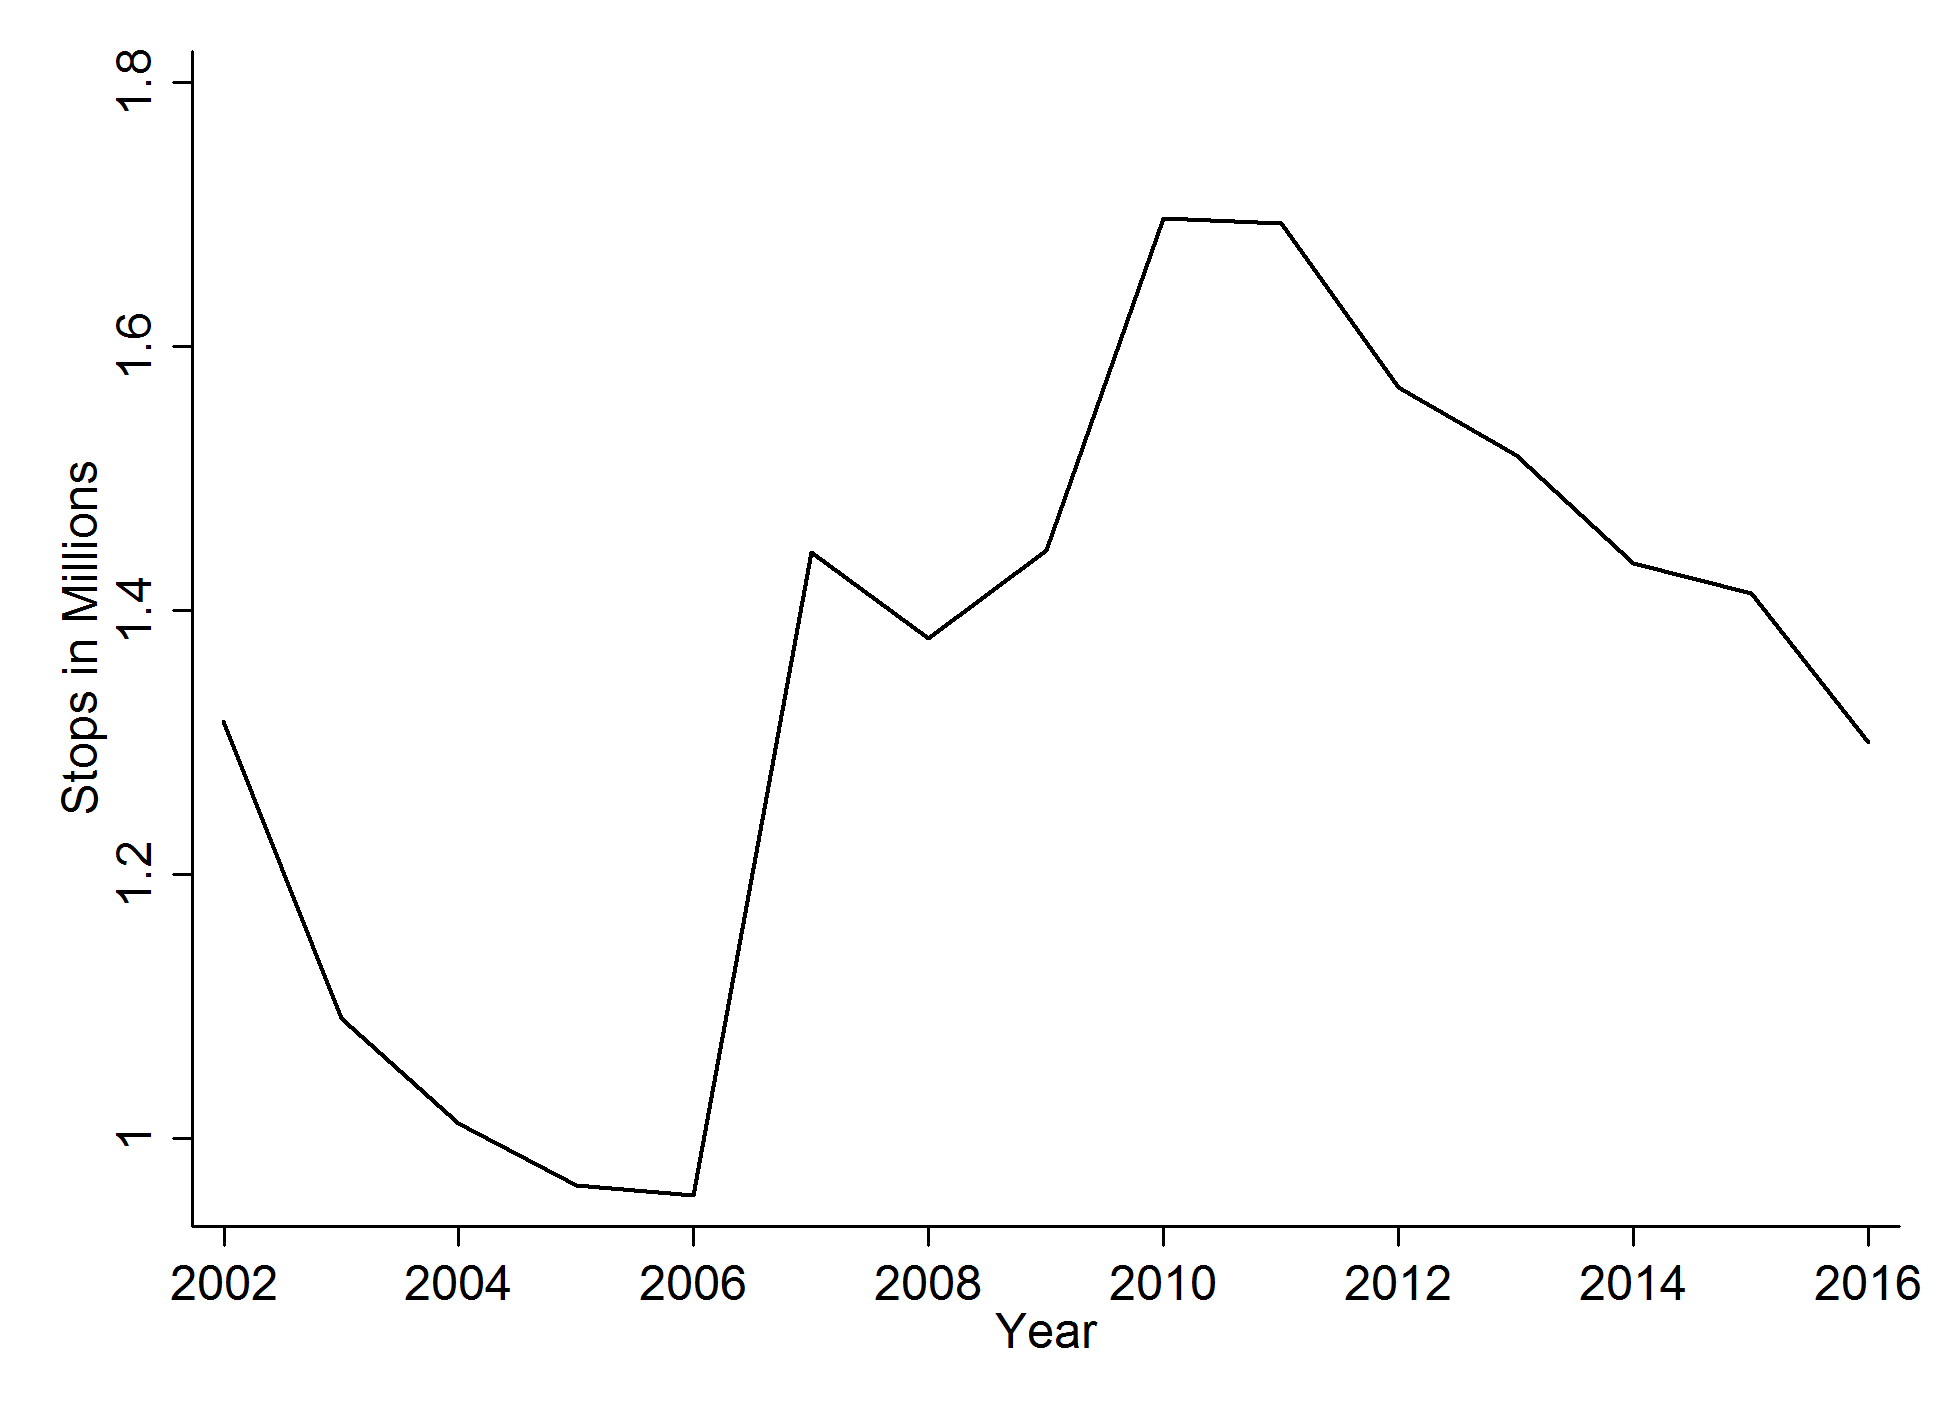
Our main database is a large rectangular Stata .dta file with all 20 million records. It is a large file, and may not run on all computers. It is unlikely to run on a laptop. Indeed it is too large for us to host directly on this web site. Please click here to go to Kelsey Shoub's Dataverse page for our book. This page includes four files:
--- NC_TrafficStops_2002-2016.zip is the most complete file, directly as downloaded from the State of North Carolina database.
--- Codebook.tab provides a codebook in XLSX format explaining all the variables provided in the state database.
--- CleaningFullData_19May2017.do is a Stata command (do) file which takes the first file above directly from the format provided by the state and creates the Stata files we use.
--- NC_TrafficStops_2002-2016_Clean_5June2017(1).zip is the version used in the book. This differs from the file above in the following ways: a) it drops observations from 2000 and 2001, since during this period the law applied only to the State Highway Patrol; b) it drops passengers and checkpoint stops, since these stops are included only if they resulted in an adverse outcome such as a search. We recommend use of this file for most purposes.
To get updates after 2016, please contact the State directly:
Mathew Landon
North Carolina Traffic Stop Program
North Carolina State Bureau of Investigation
919-582-8678 (Direct)
mlandon@ncsbi.gov
Other databases:
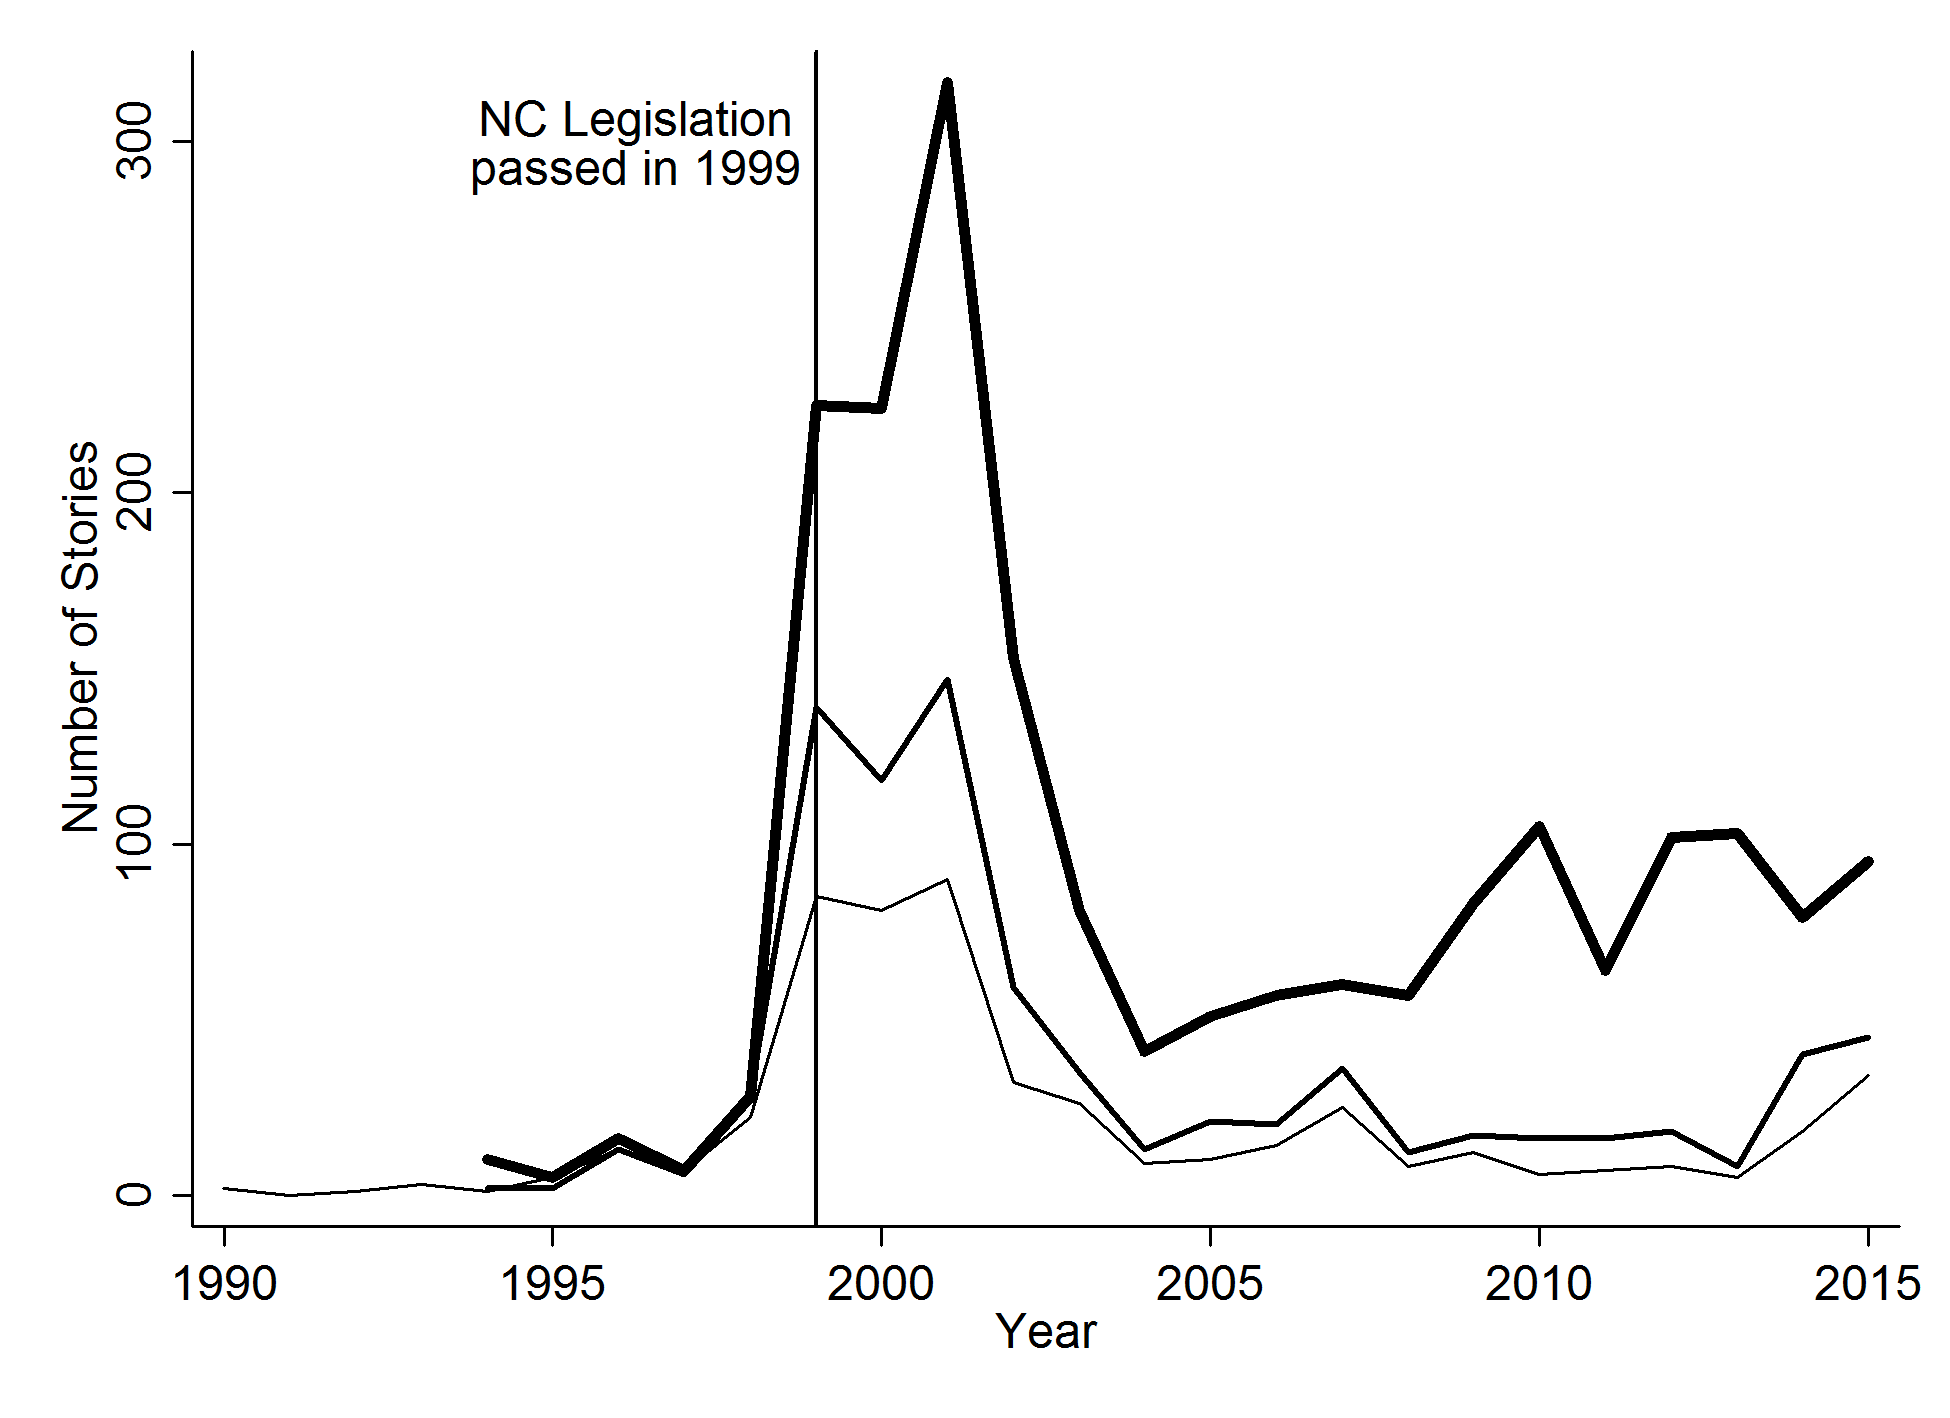
Data on newspaper coverage for Figure 2.1.
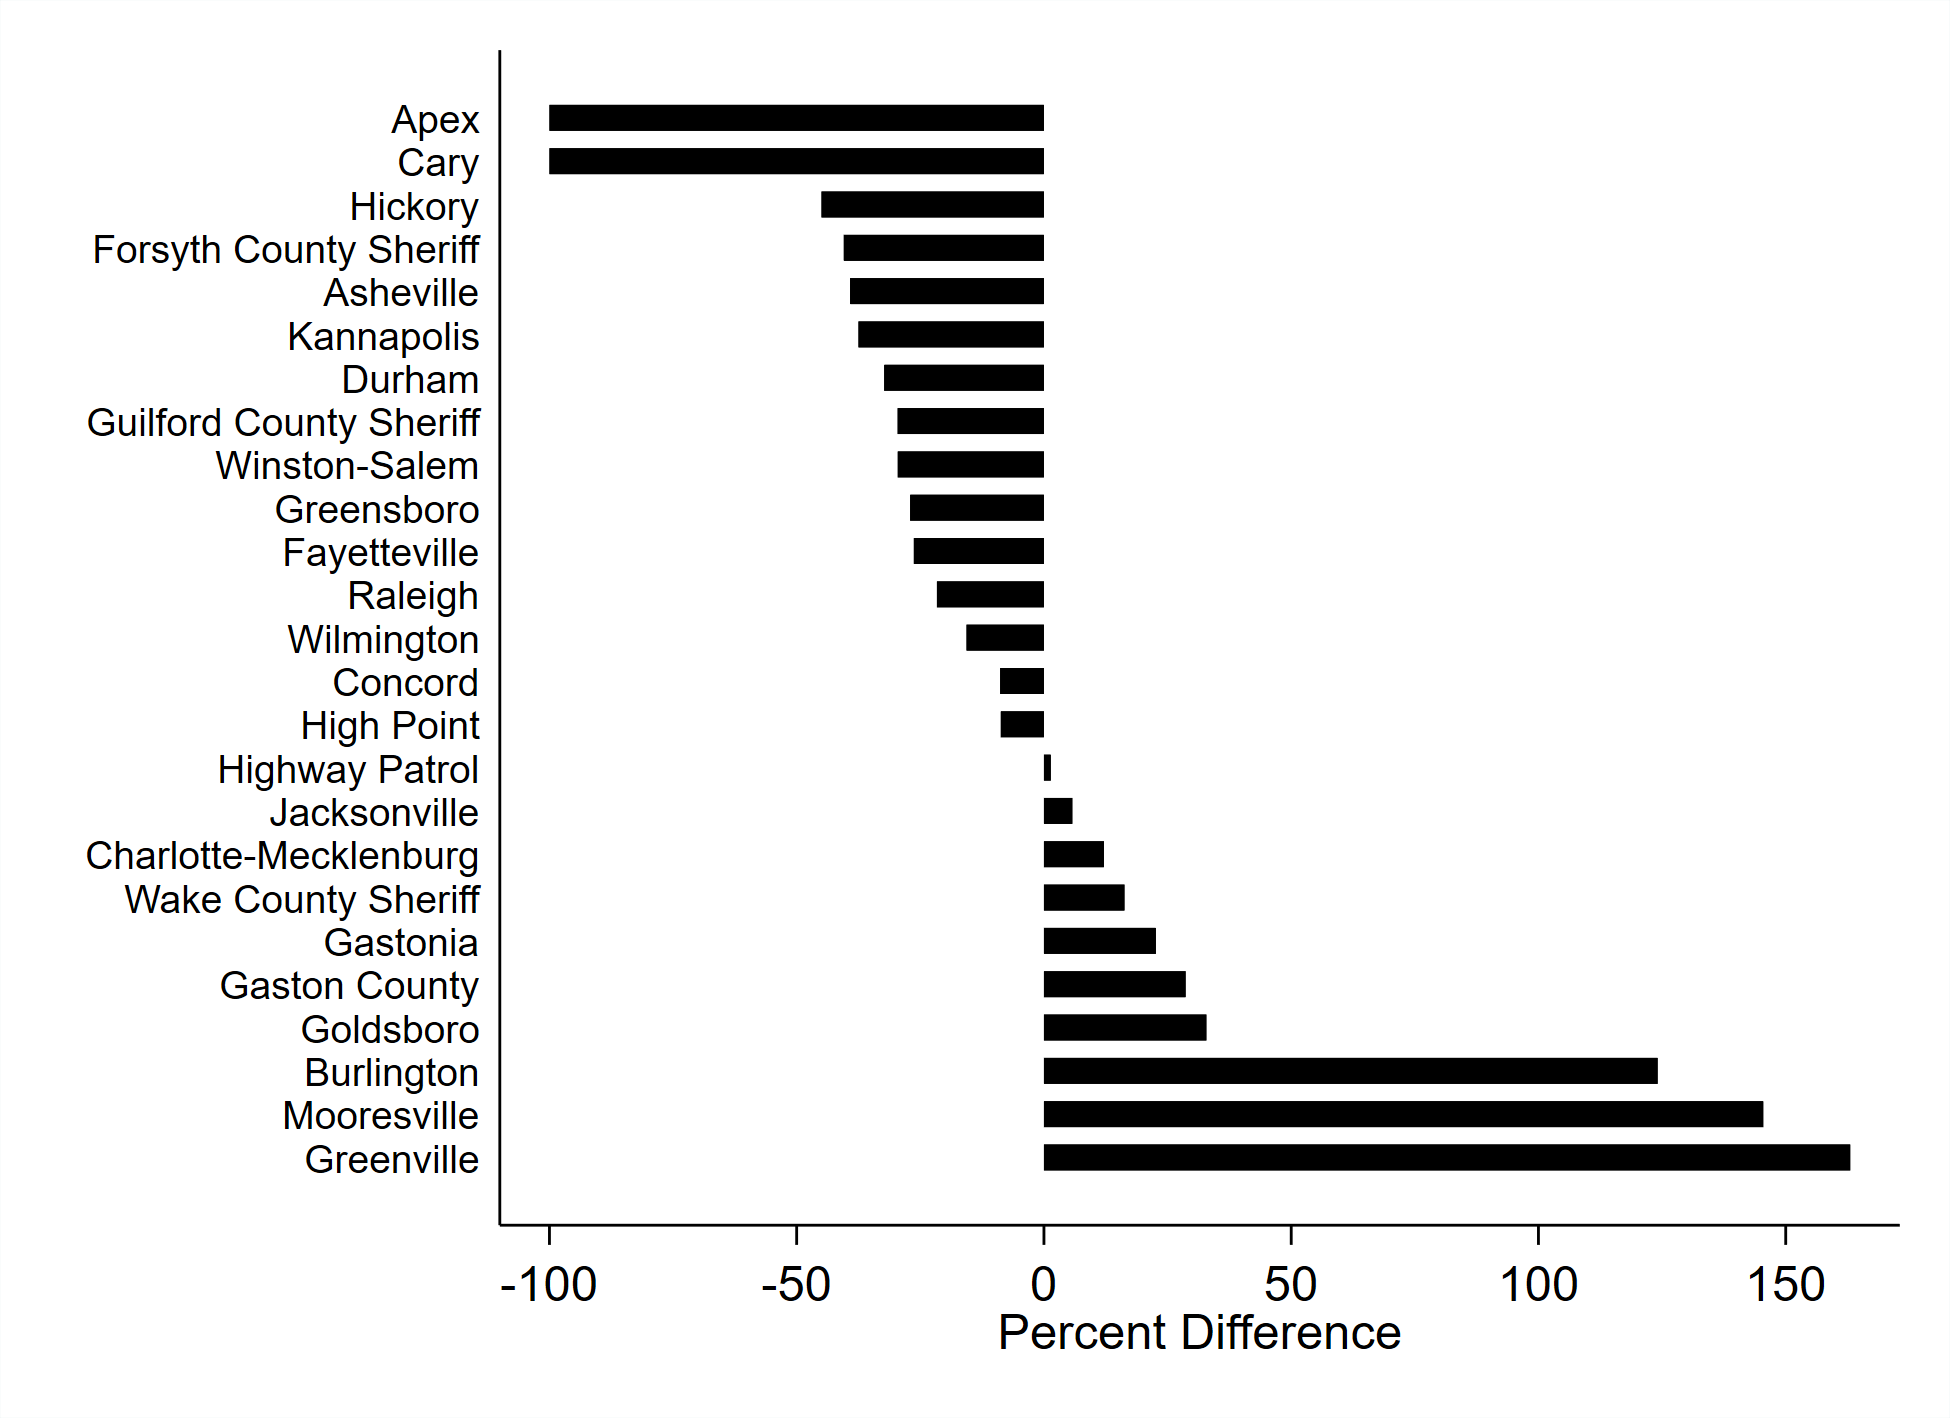
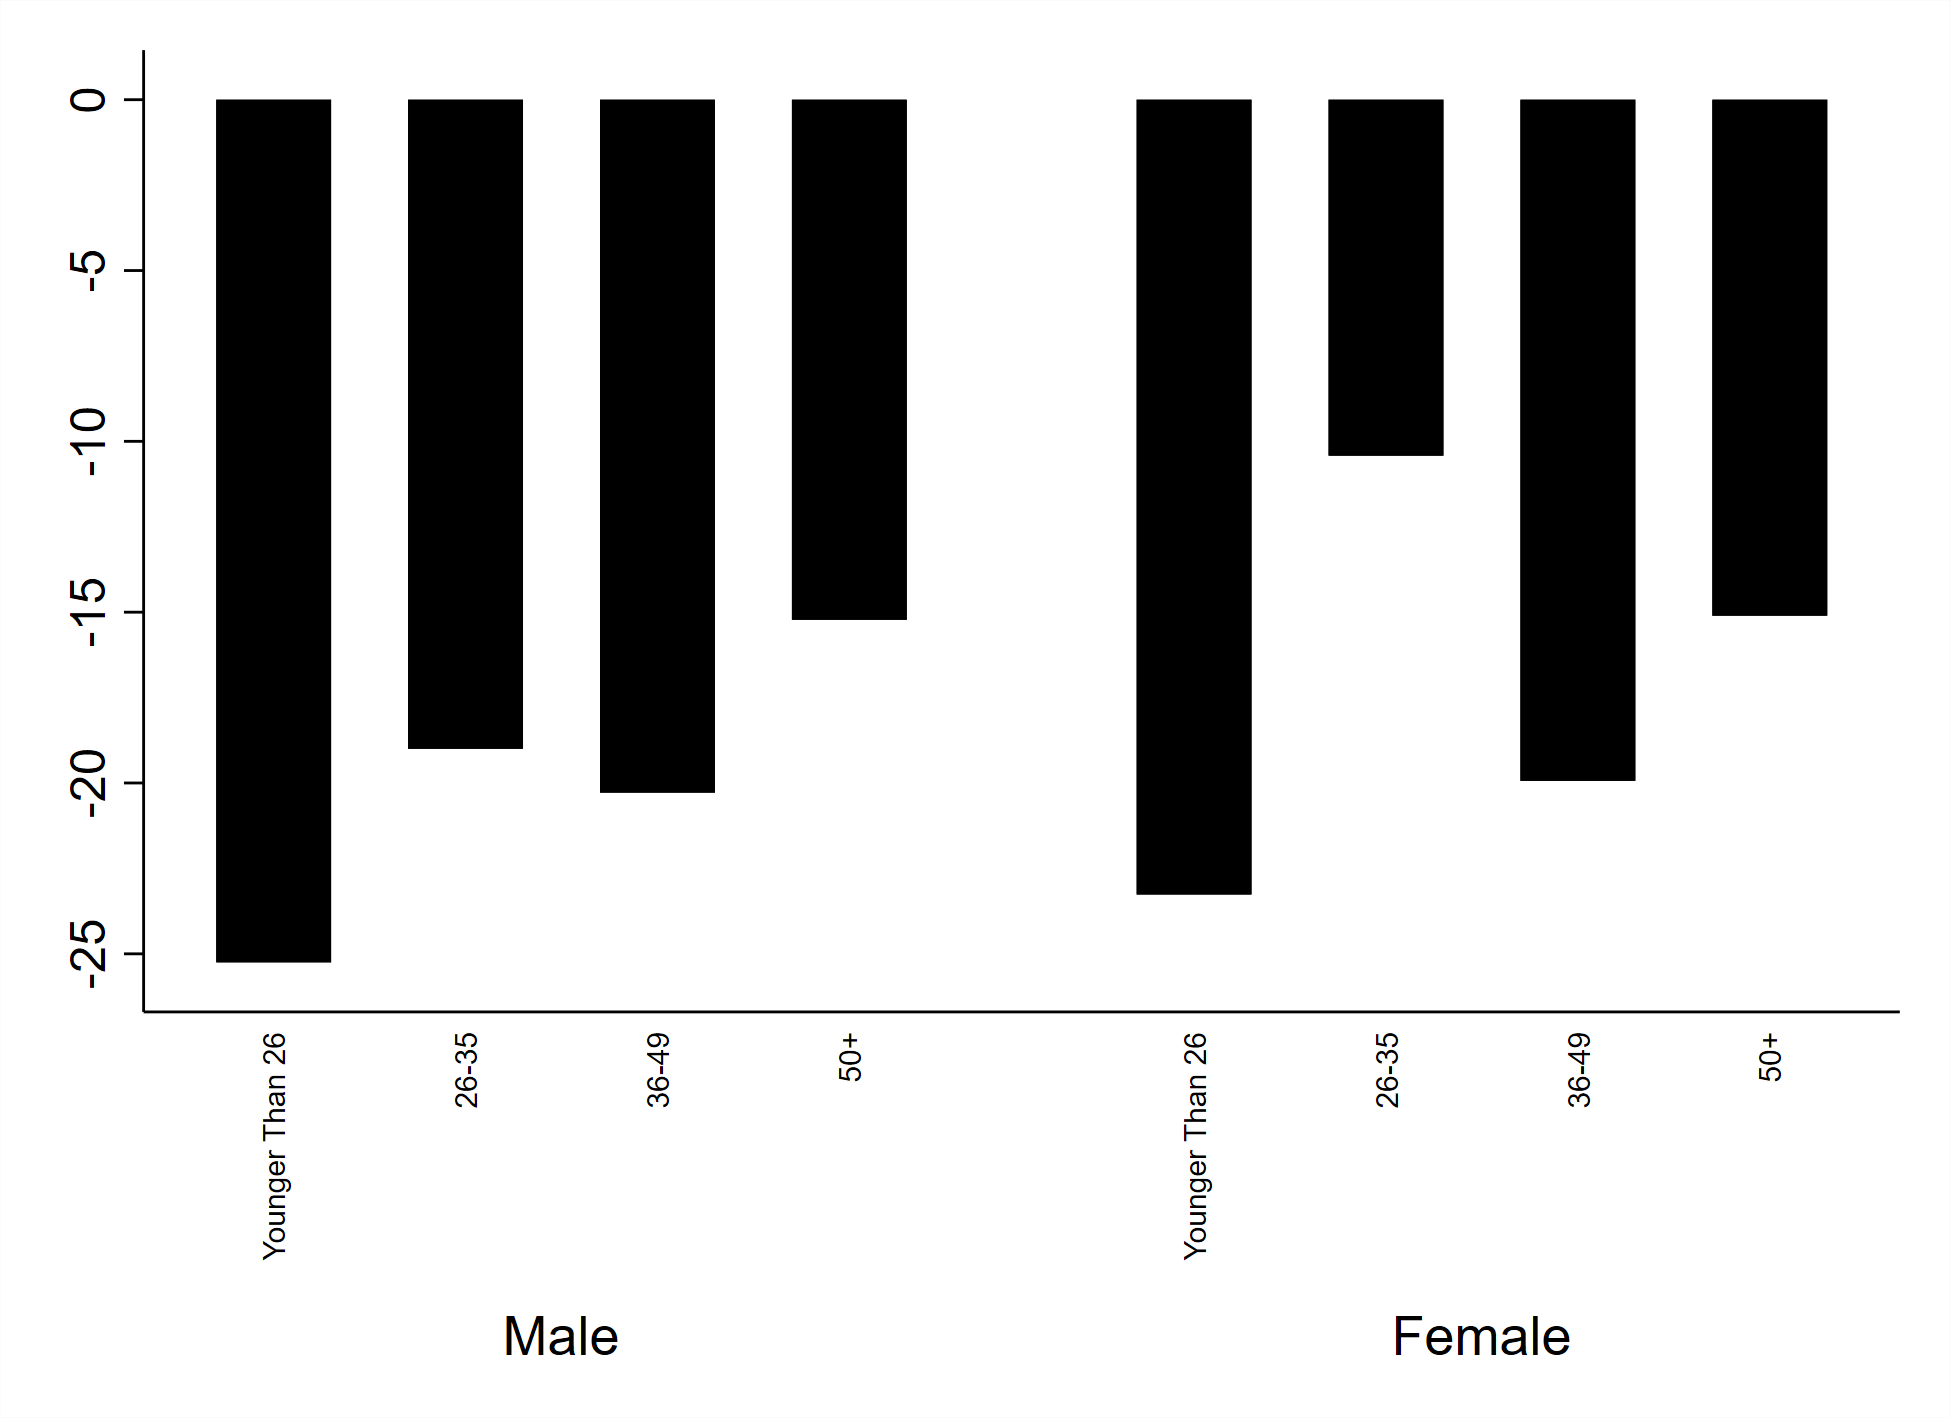
Data on Police Agencies used in Chapter 8.
Data on Sheriffs' Departments used in Chapter 8.
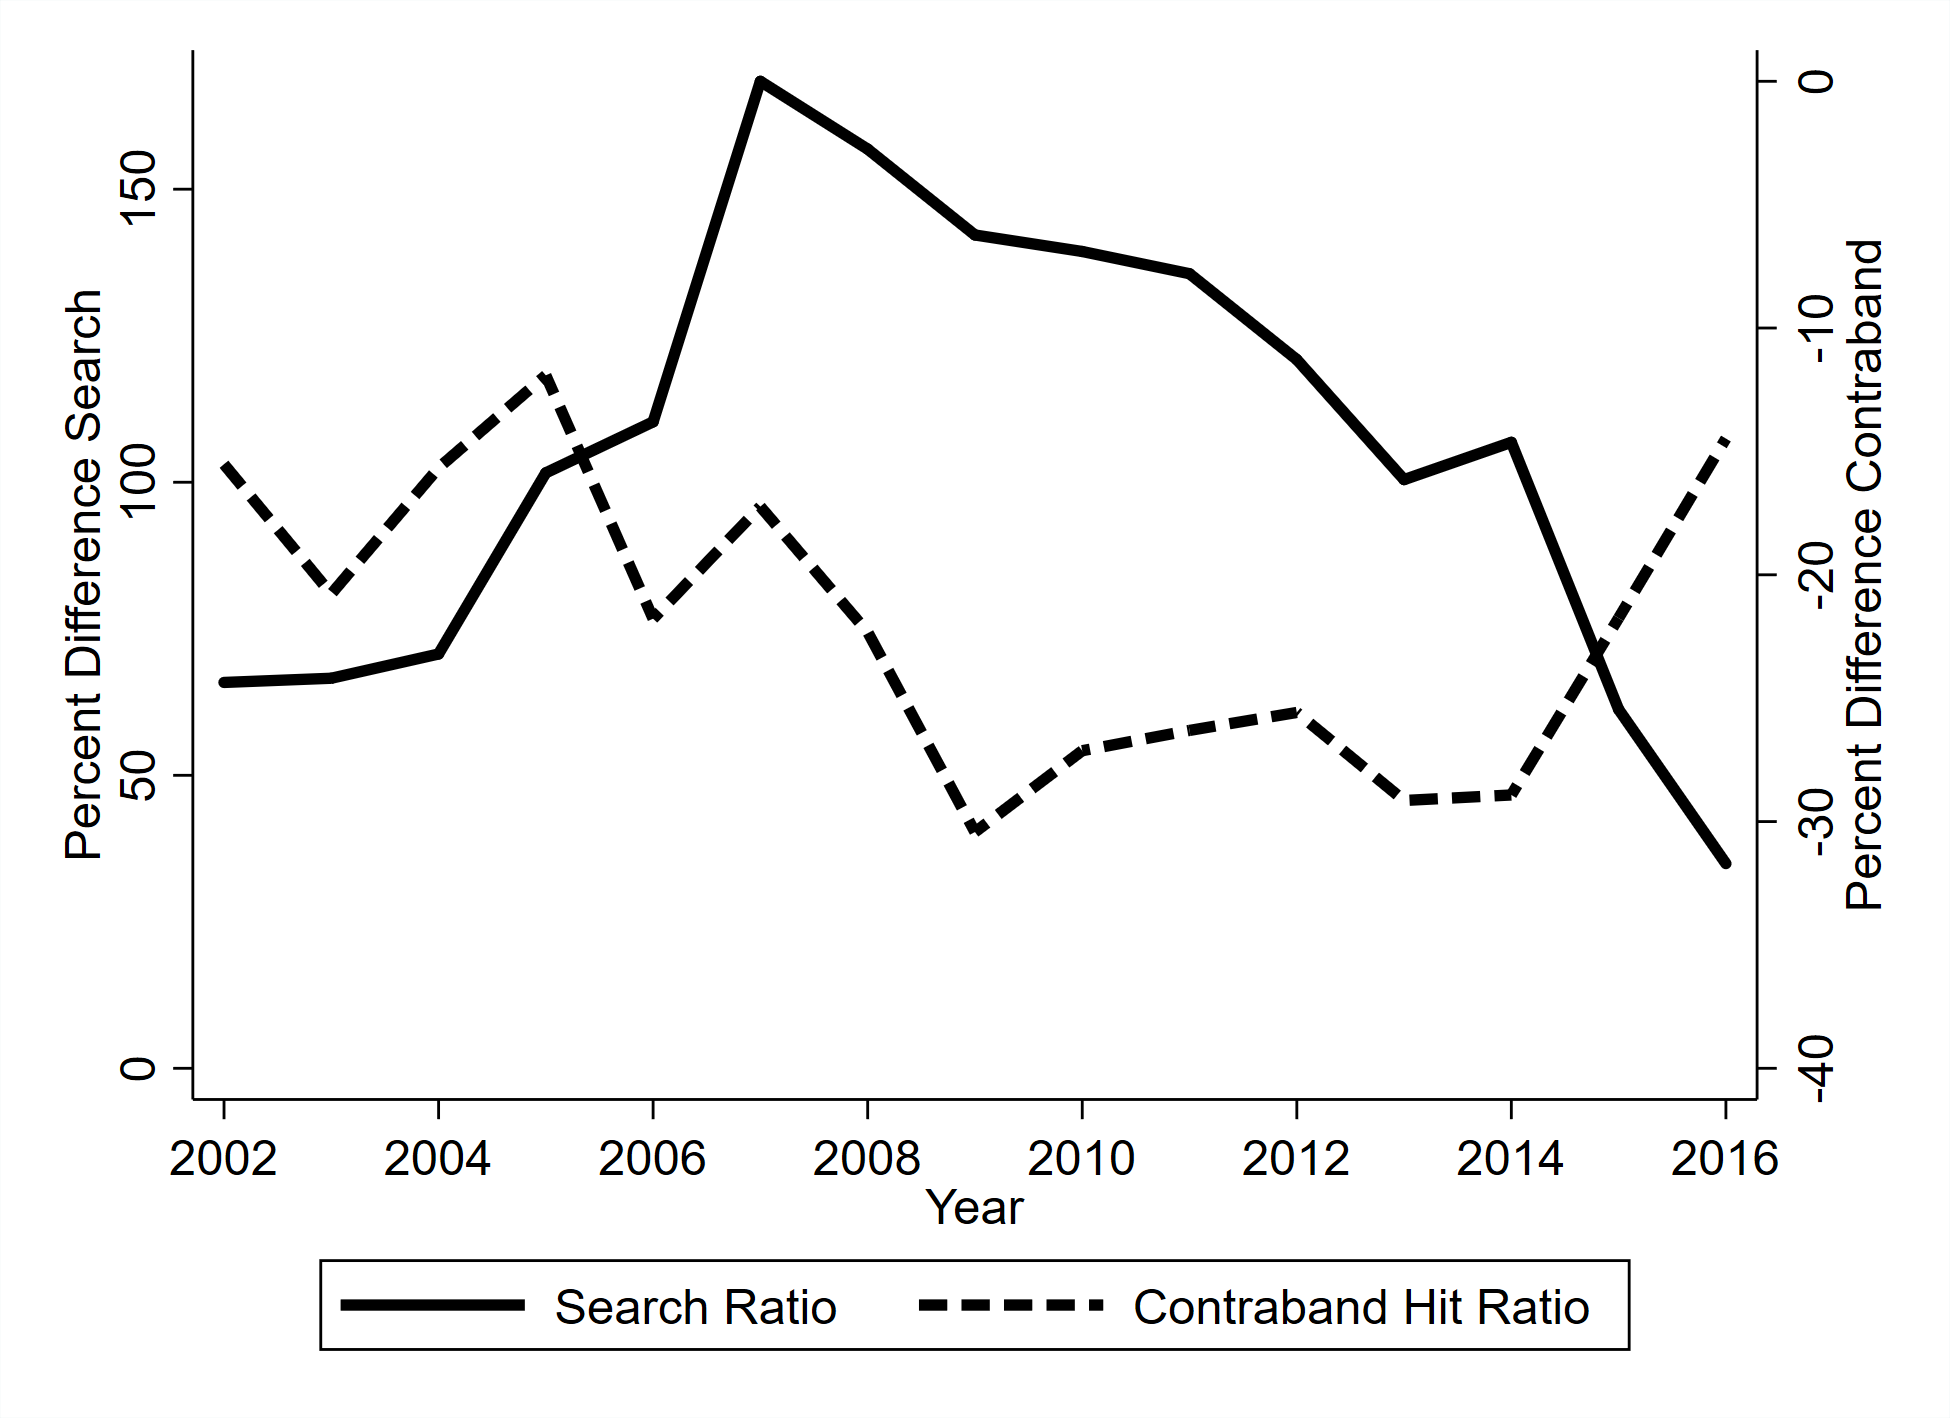
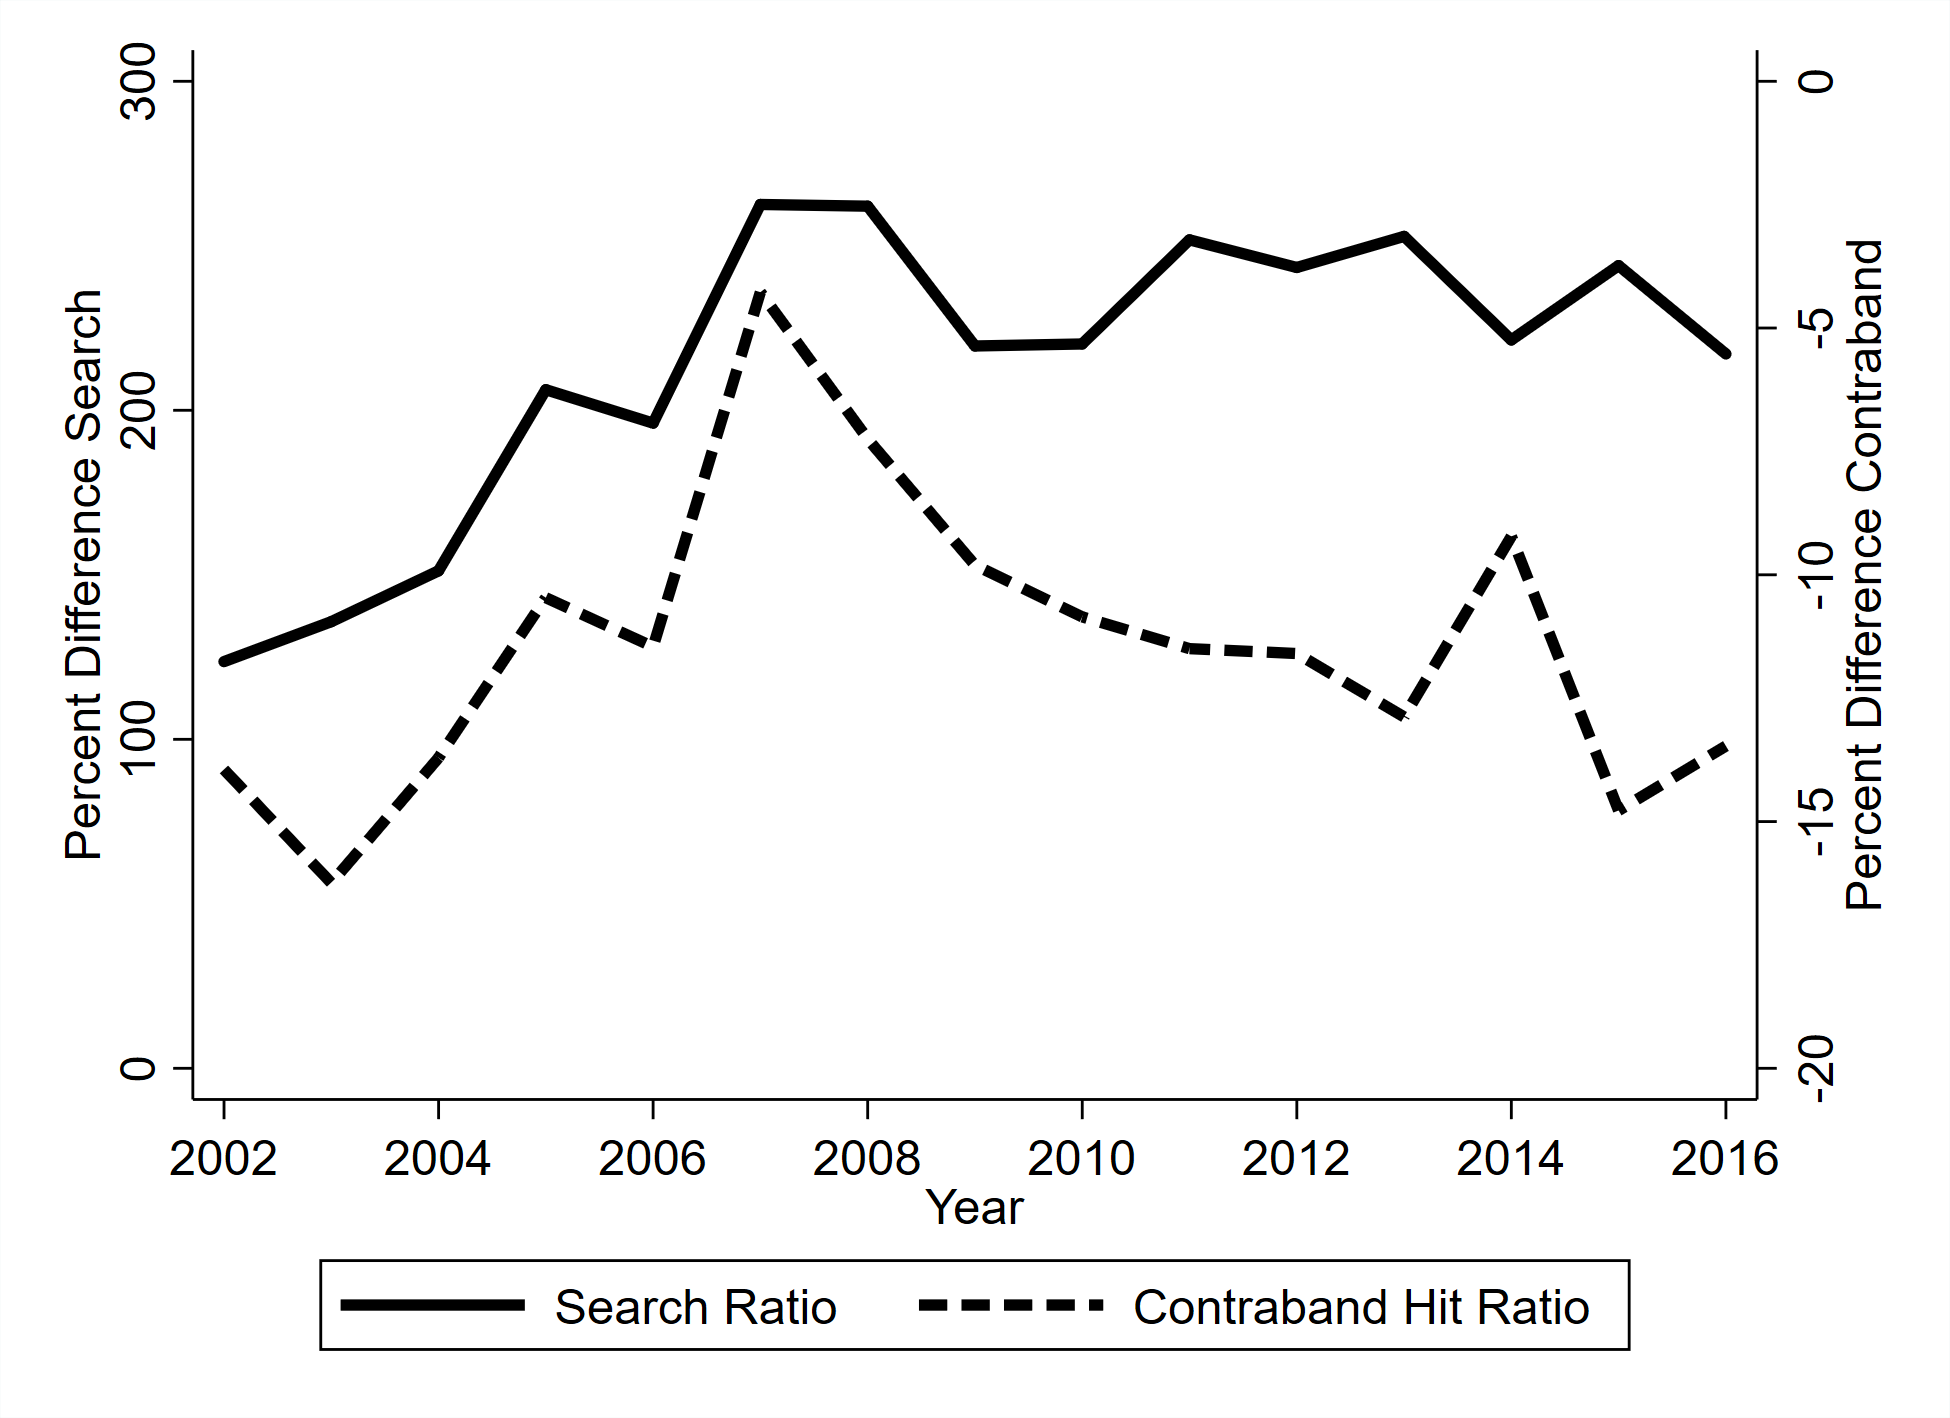
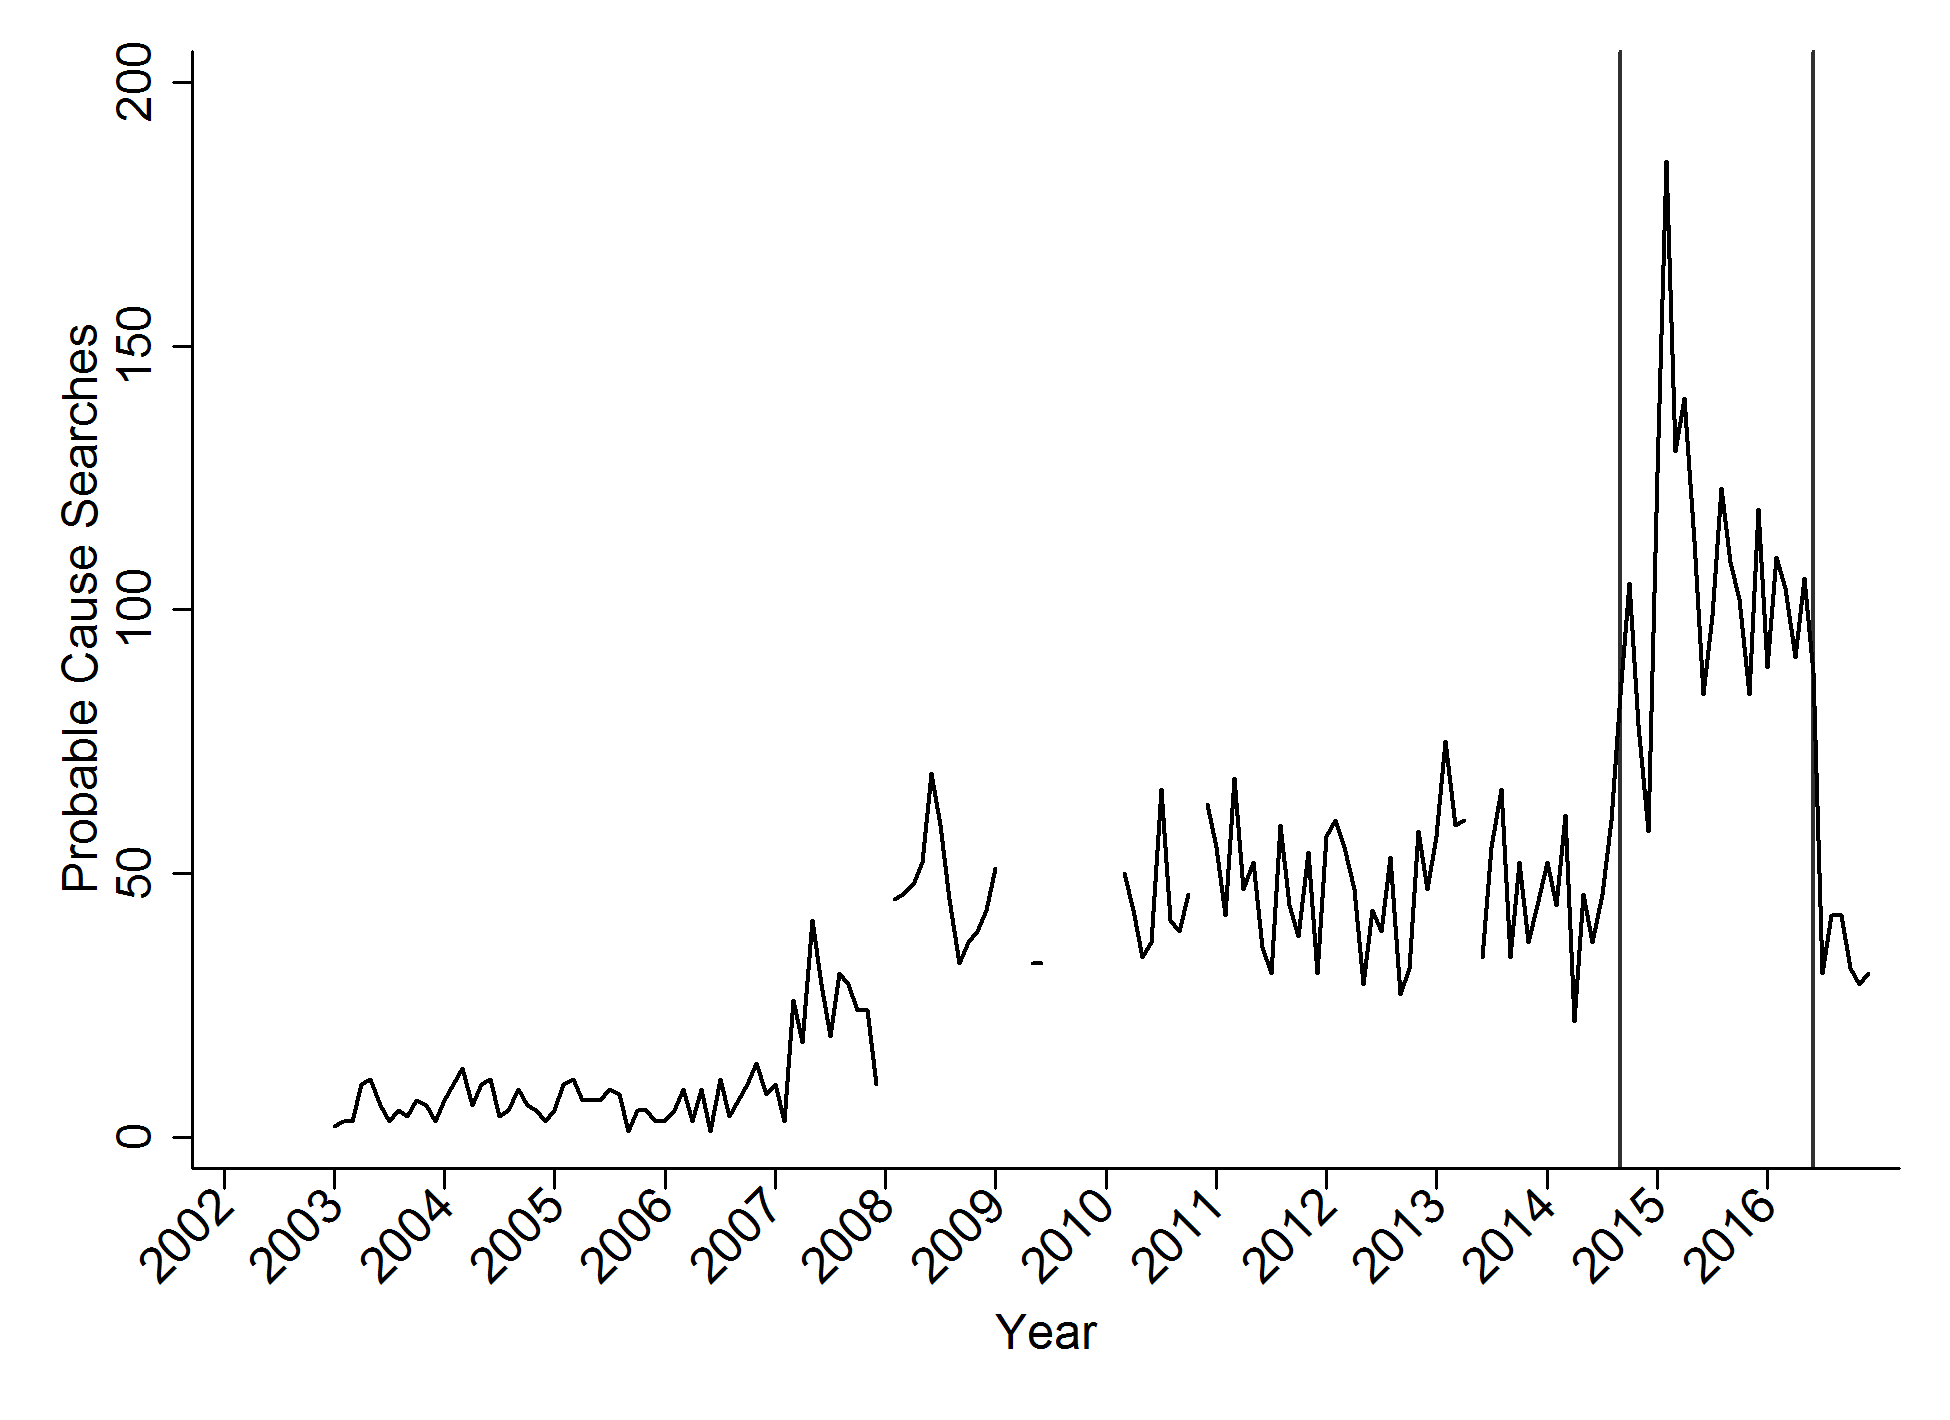
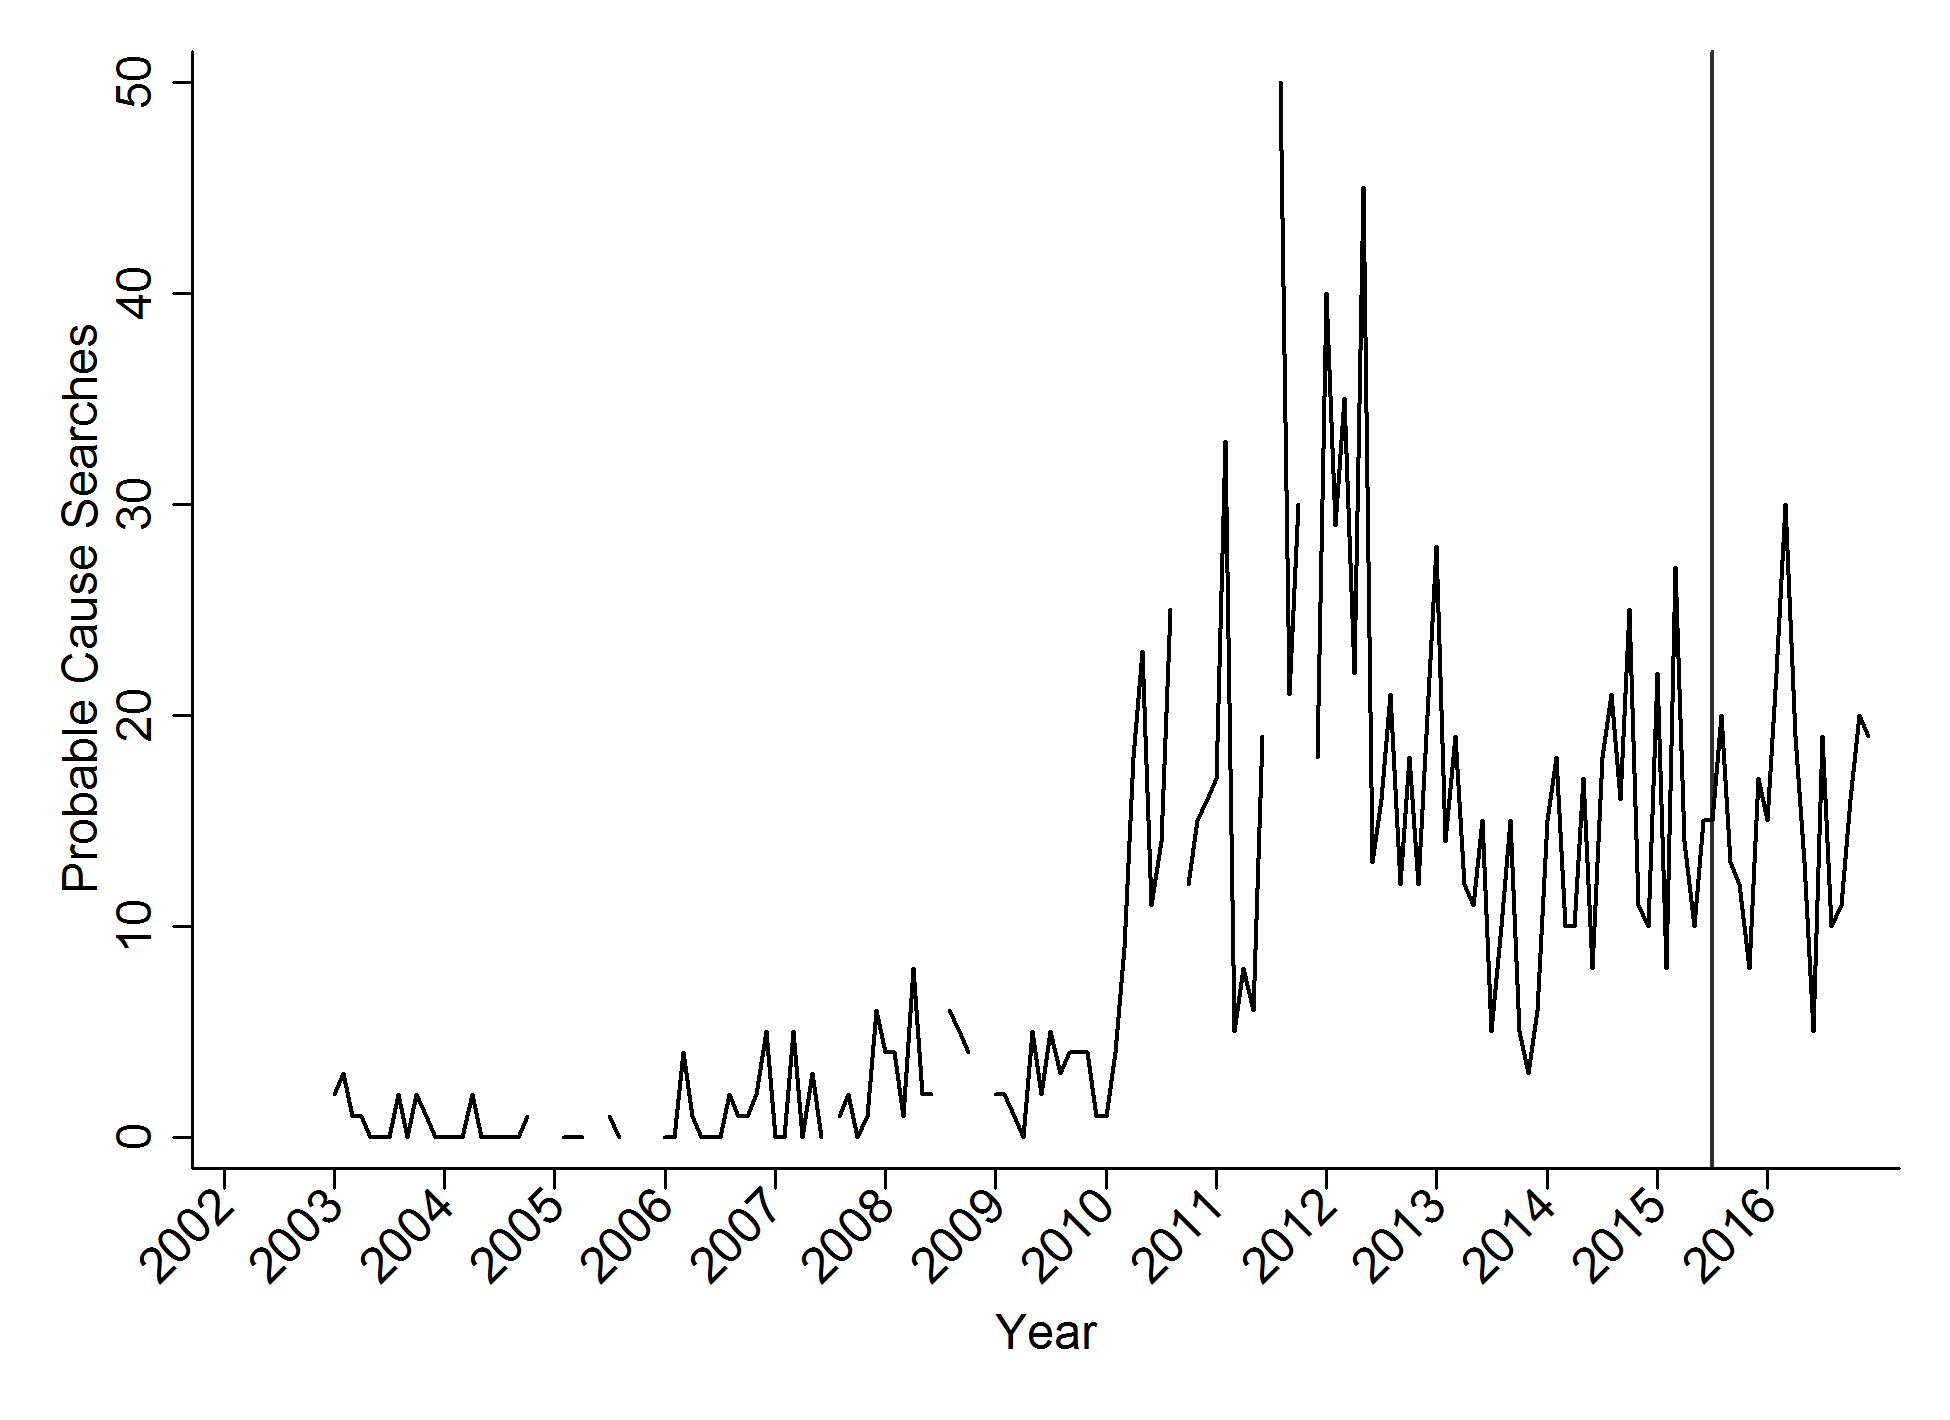
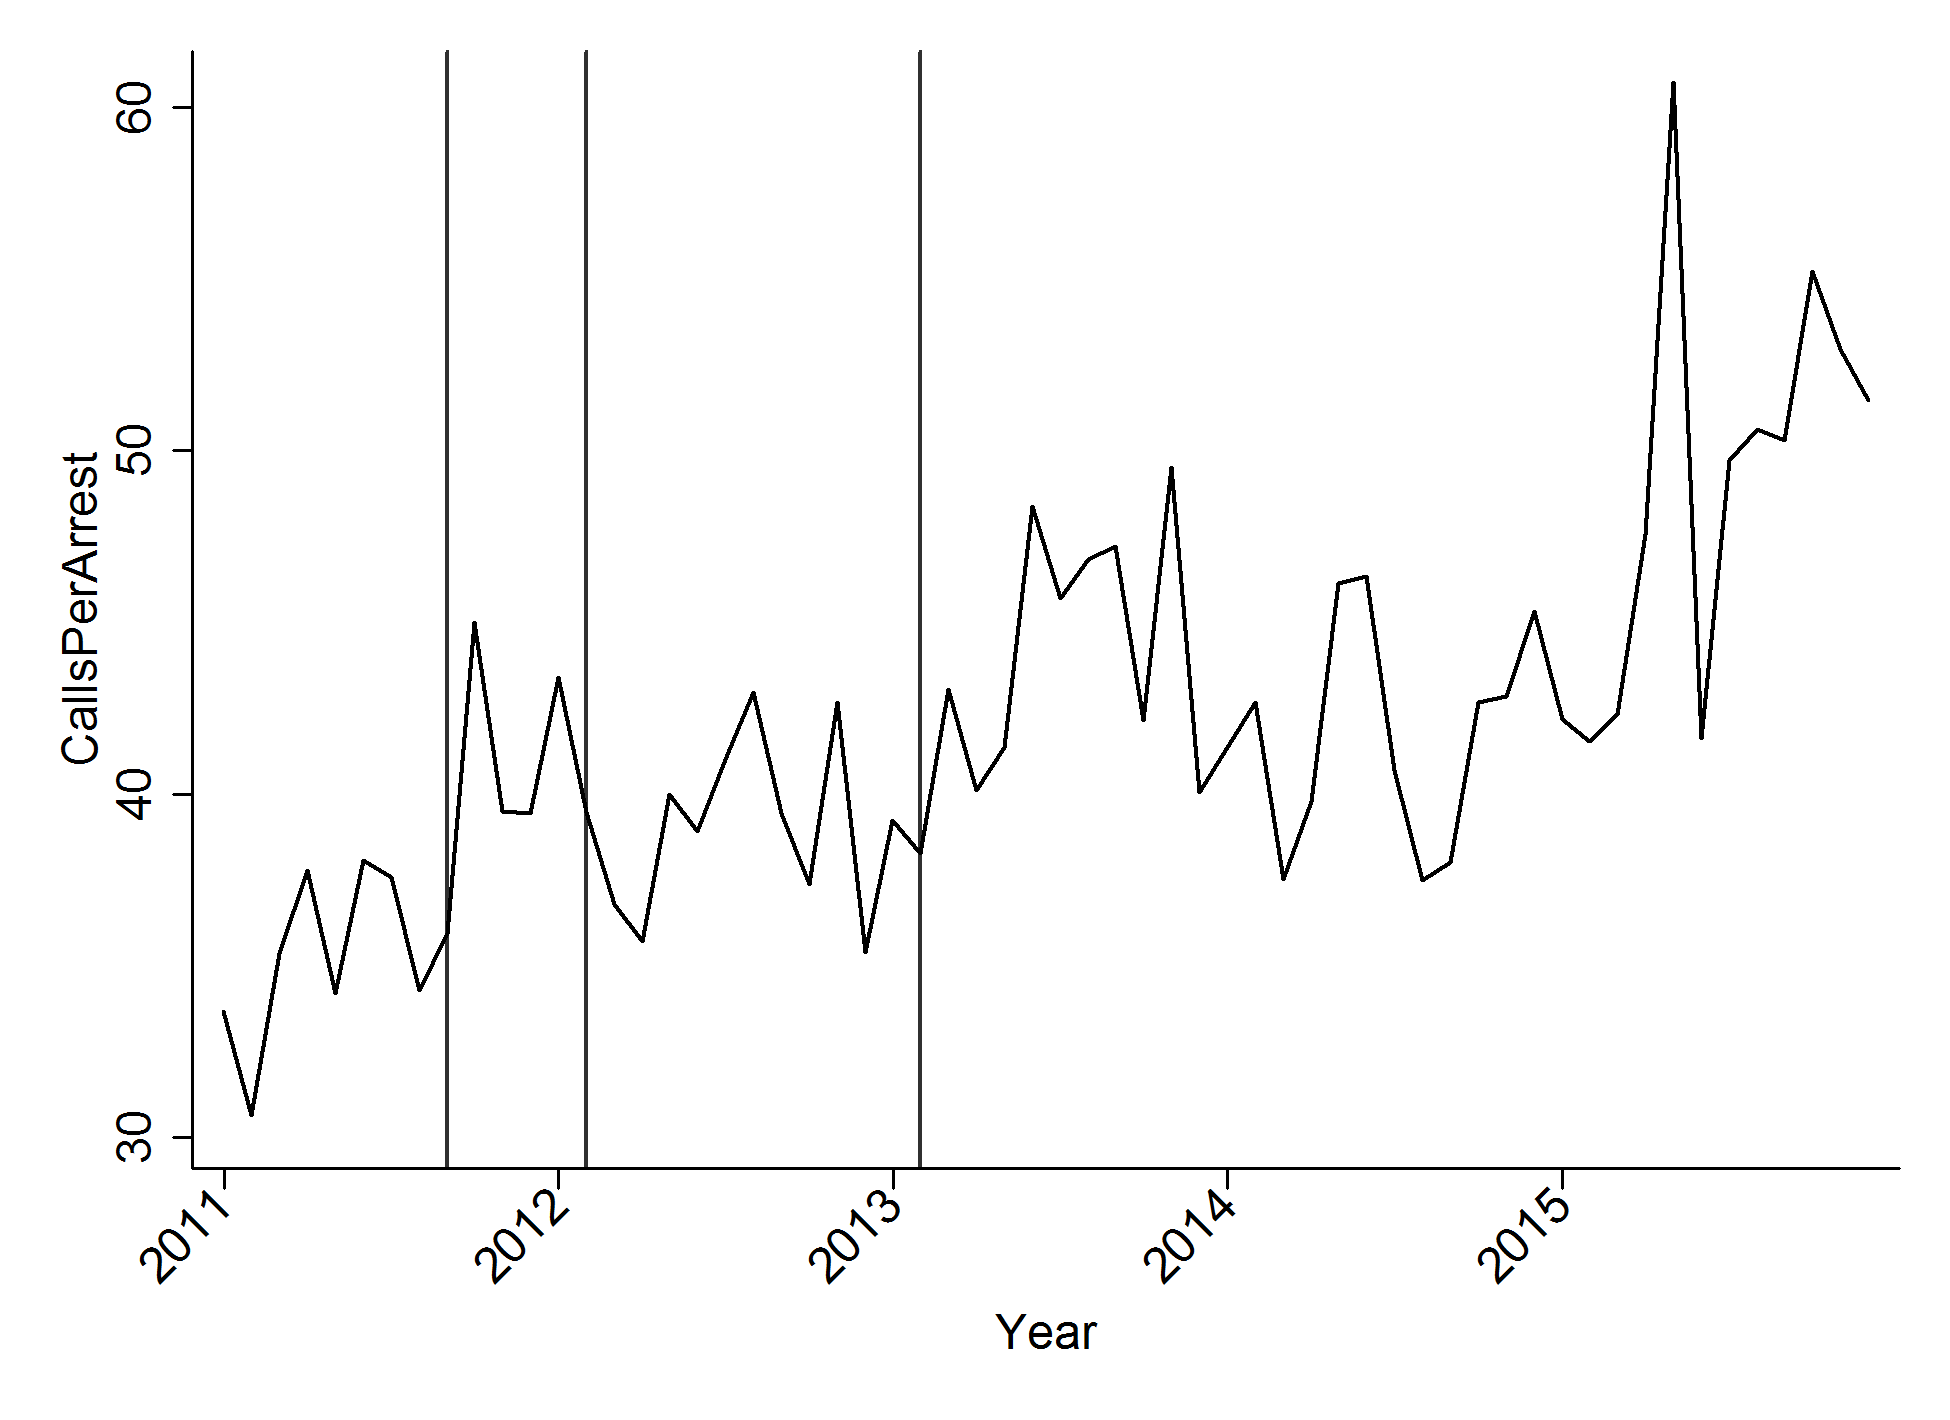
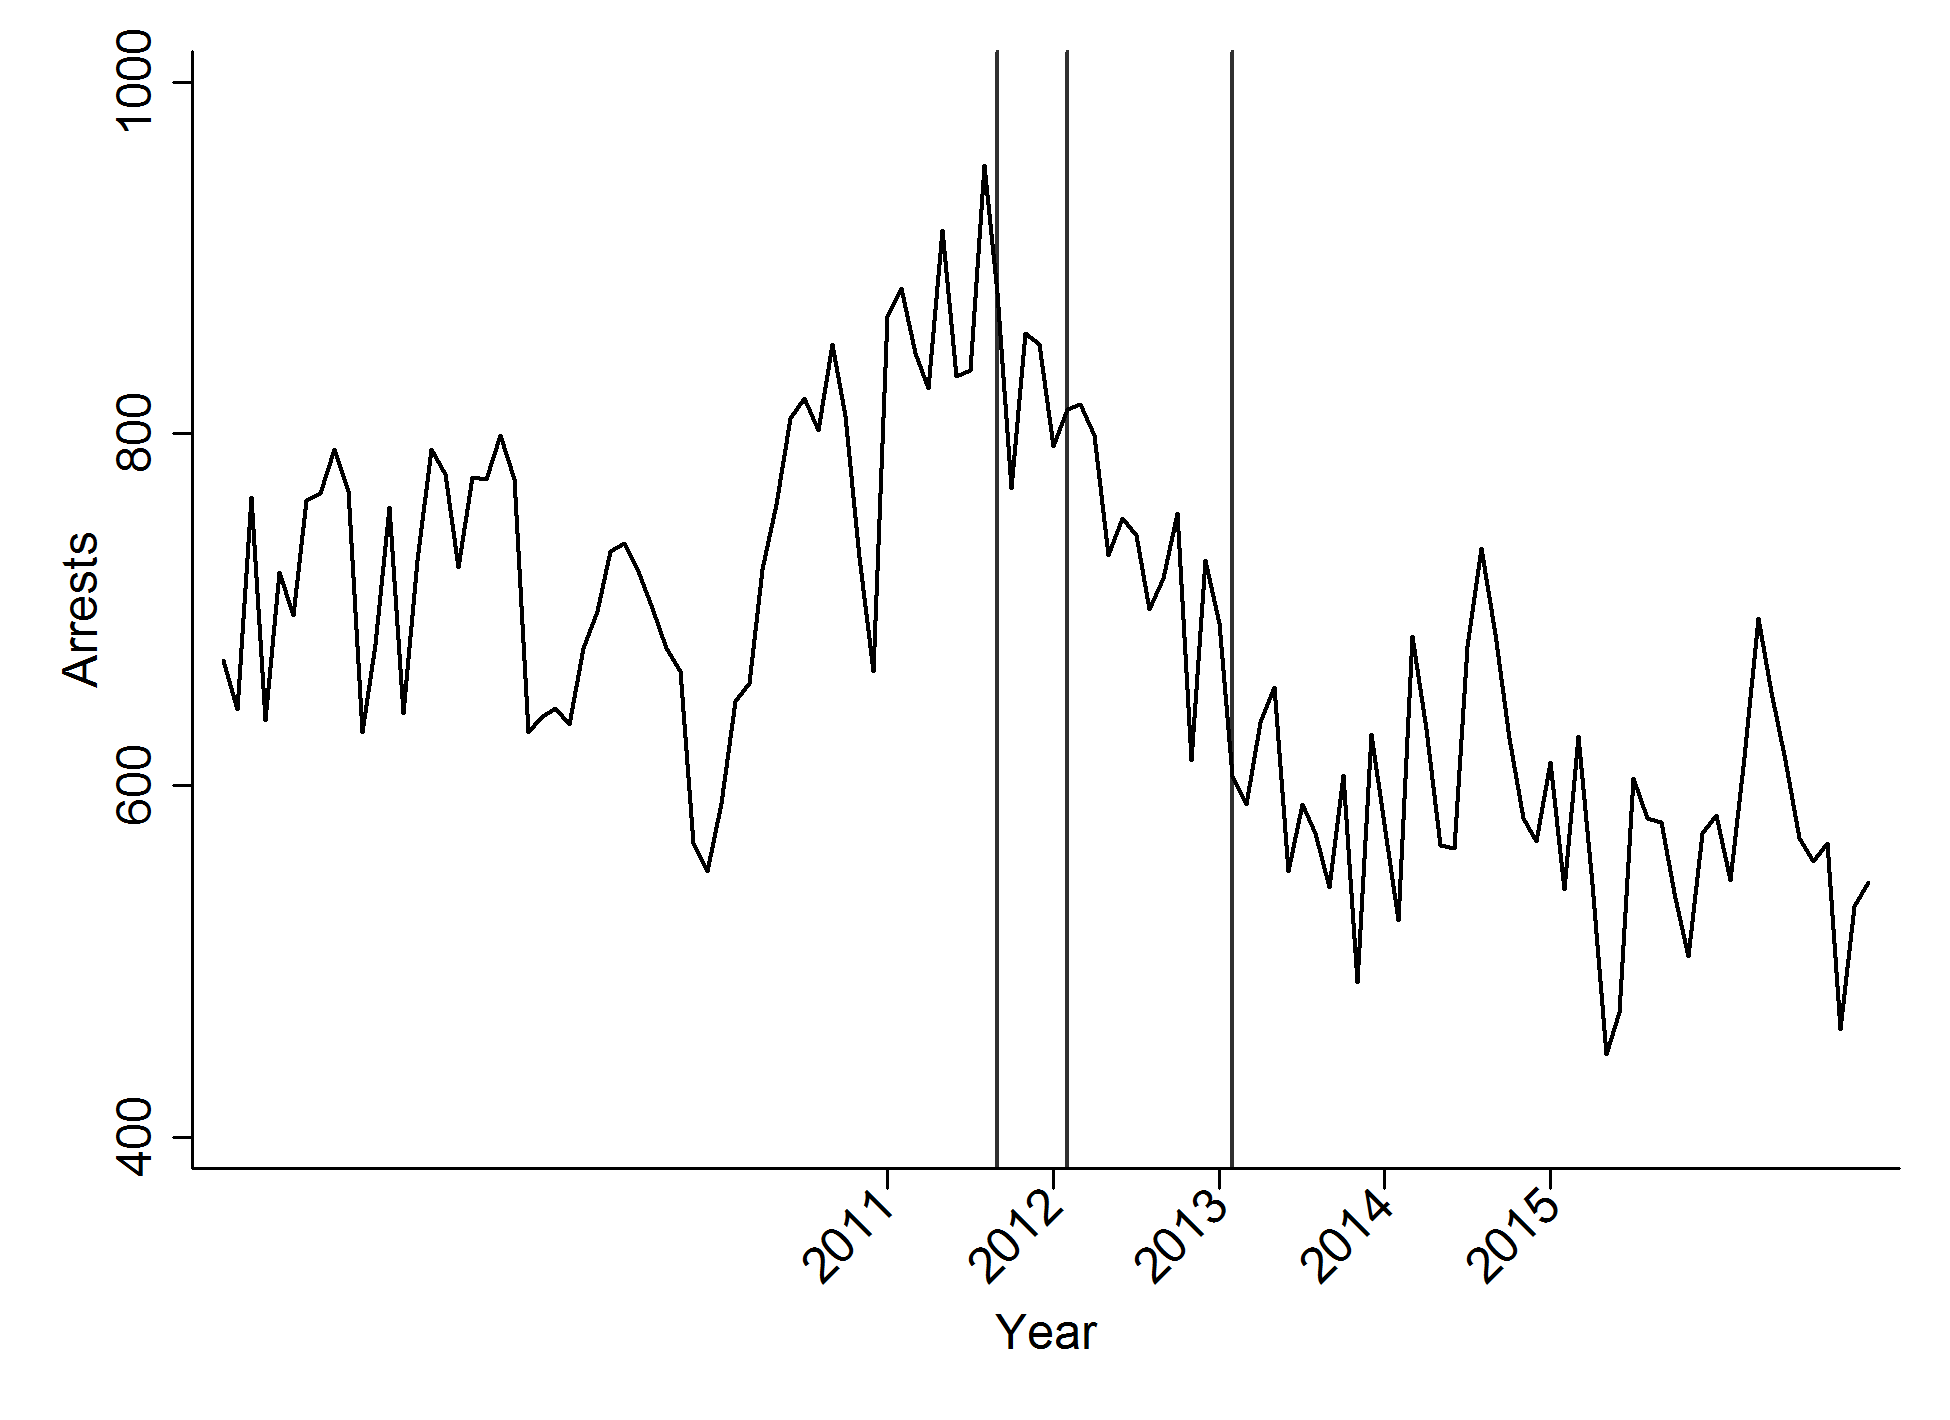
Monthly search data for three cities used in Chapter 9.
Crime data regarding Fayetteville used in Chapter 9.
All other databases are created from the first one, in the various do-files listed below.
Errata:
We have found these typographical errors in the book:
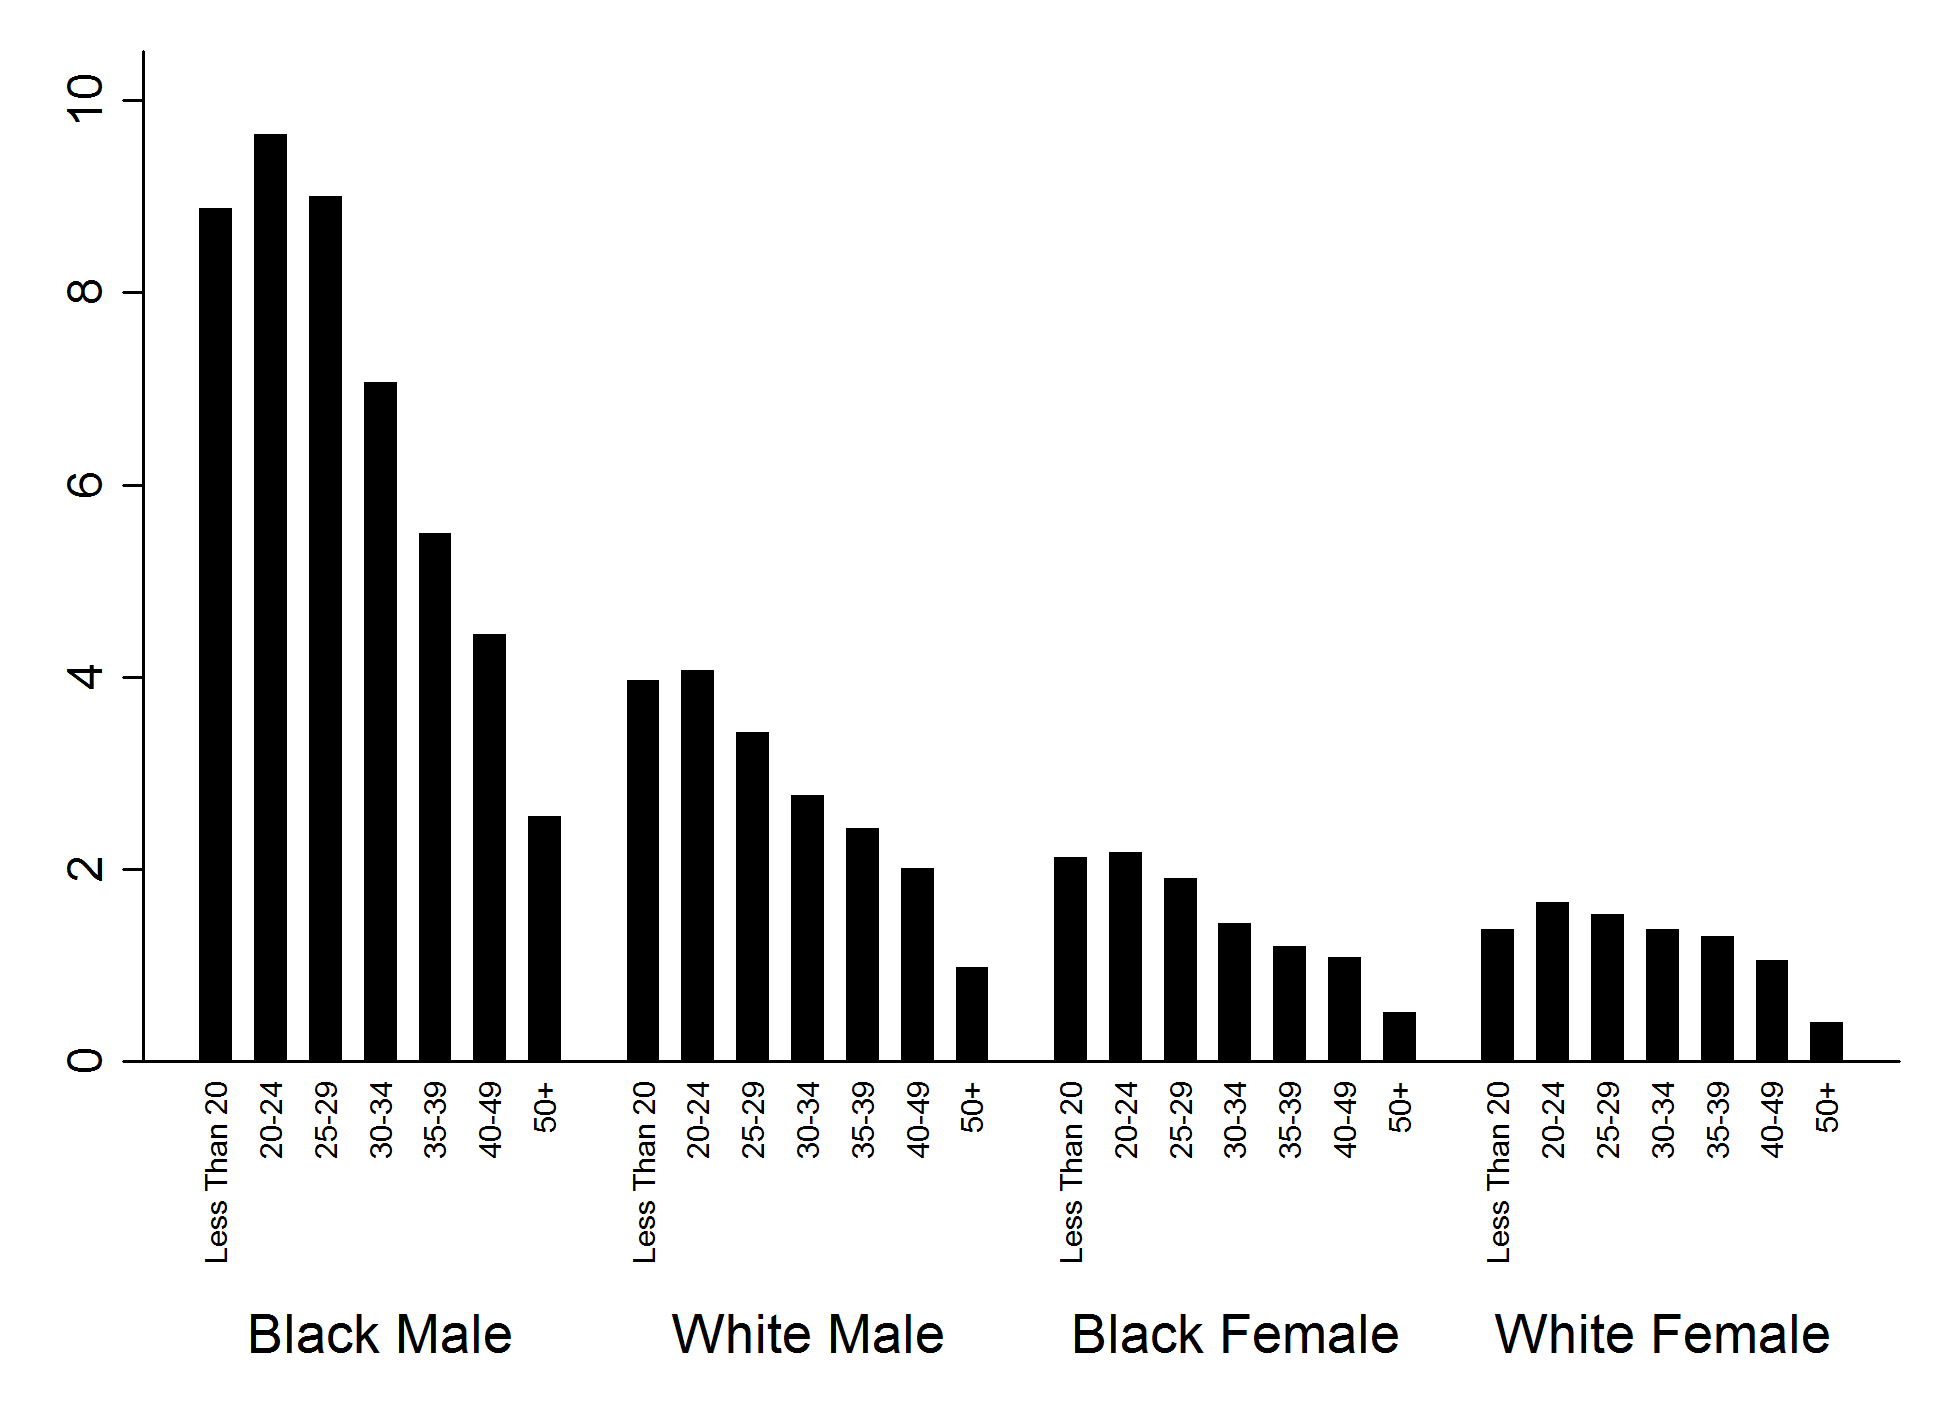
Table 2.2. The number of drivers aged 40-49 is 3,620,522, not 3,629,522 as reported. This changes the N in that section of the table to 20,531,913. The percentages reported are correct.
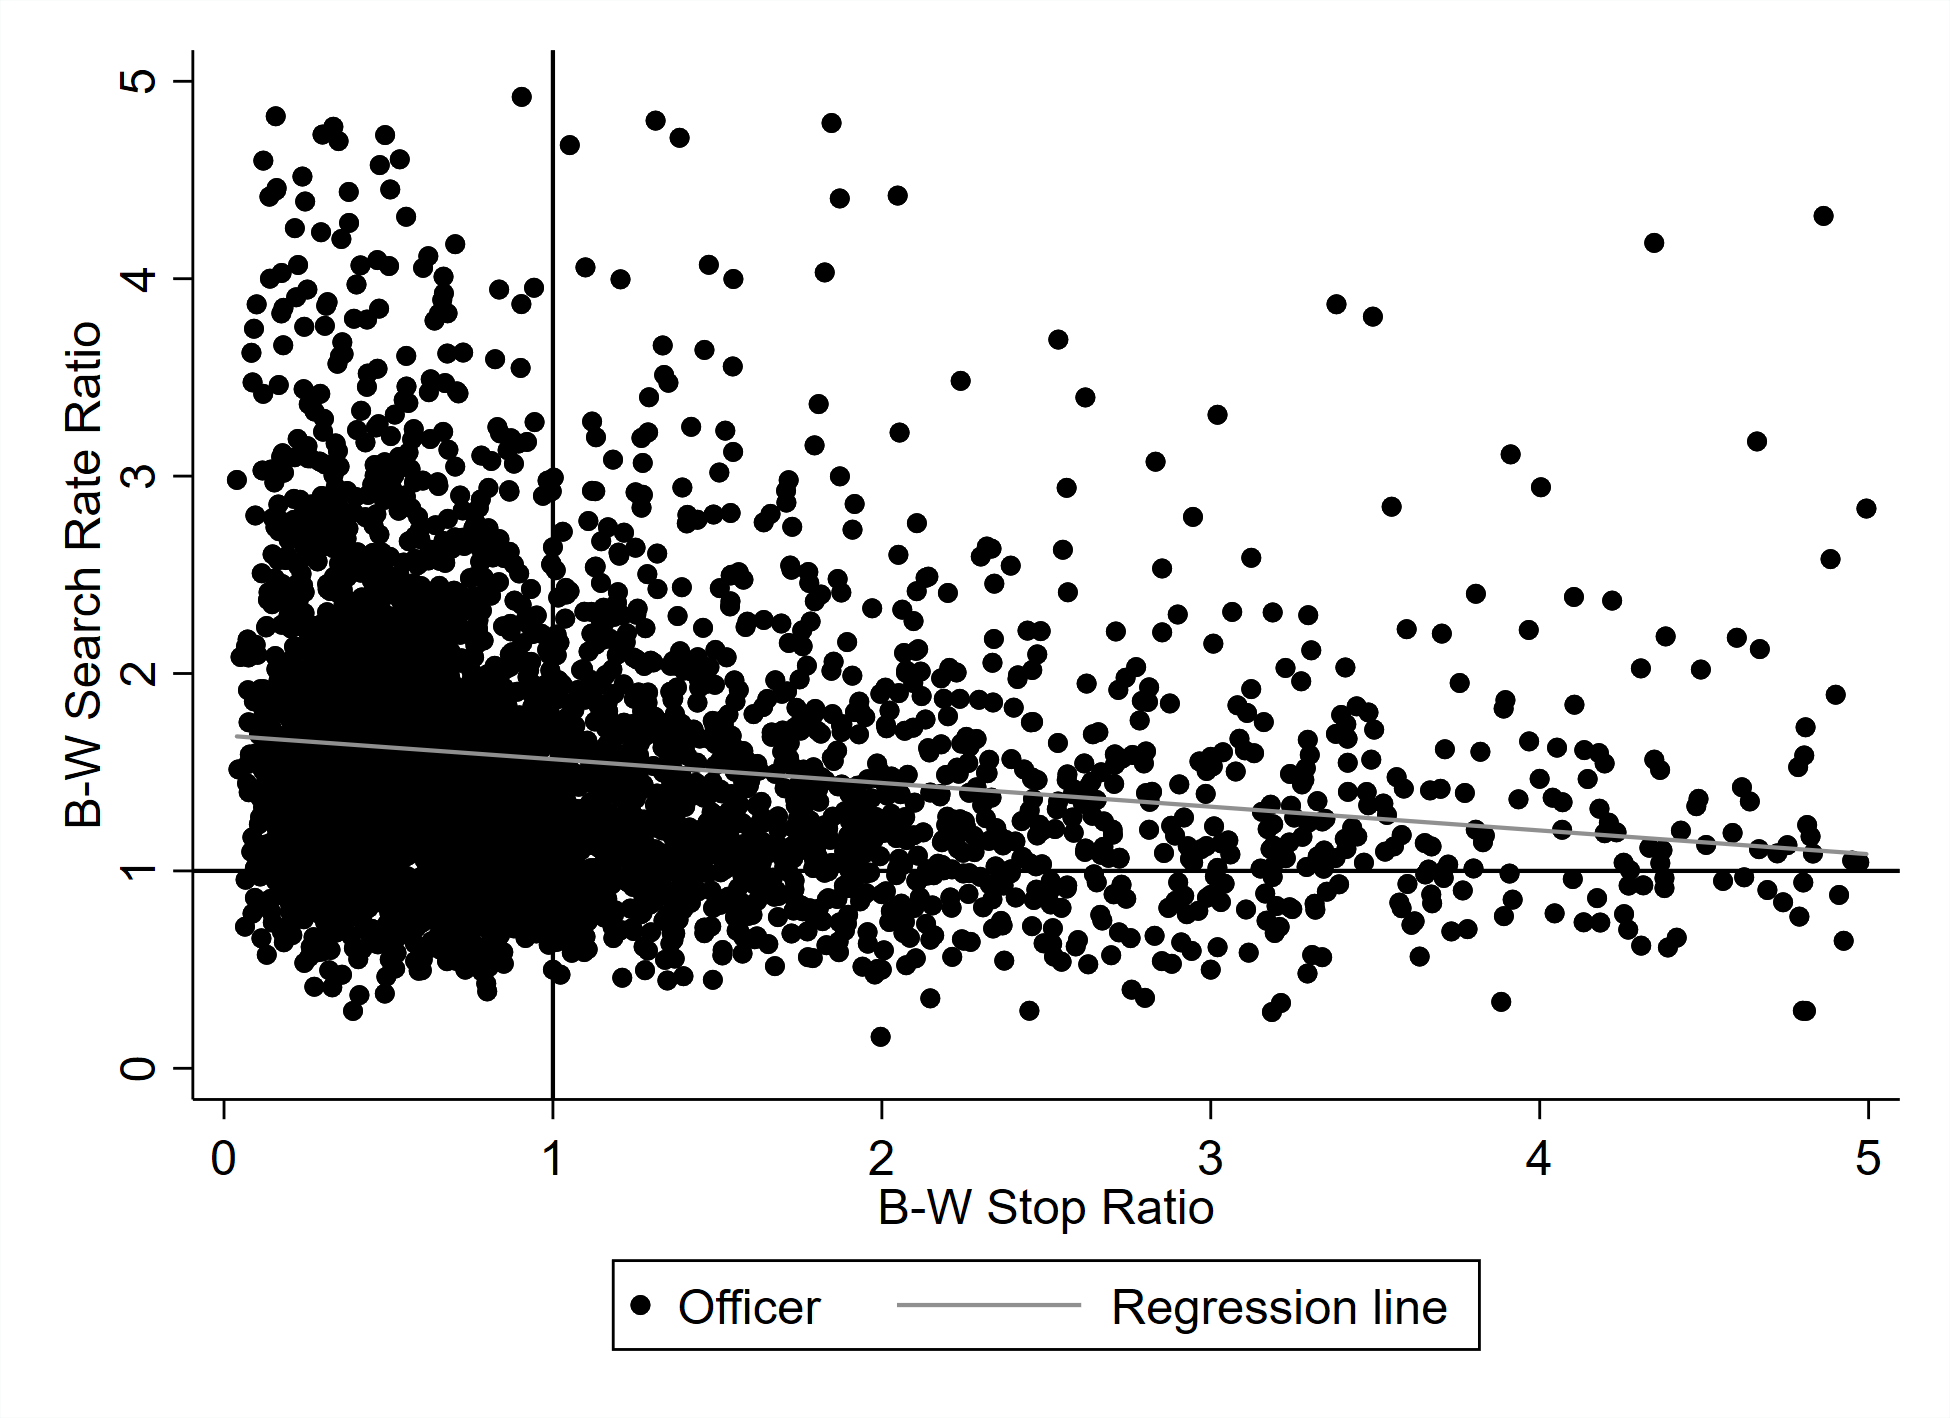
Table 4.2. The last column (H-W Ratio) should read: 2.35, 1.76, 2.02.
Updated Tables and Figures through 2020, with over 24,000,000 traffic stops (PDF).
Updated Stata and R code for the 2020 update.
Reproducing our Tables and Figures: These stata do-files generate the tables and figures used in our book. Running these files on the database listed above should reproduce exactly the data presented in our book. Note that these command files may also be run on individual cities or on updated versions of the database to customize or extend the analysis we have done.
--- Chapter 2 --- Chapter 3 --- Chapter 4 --- Chapter 5 --- Chapter 6 --- Chapter 7 --- Chapter 8 --- Chapter 9
To download high-quality images of the figures themselves, use these links:
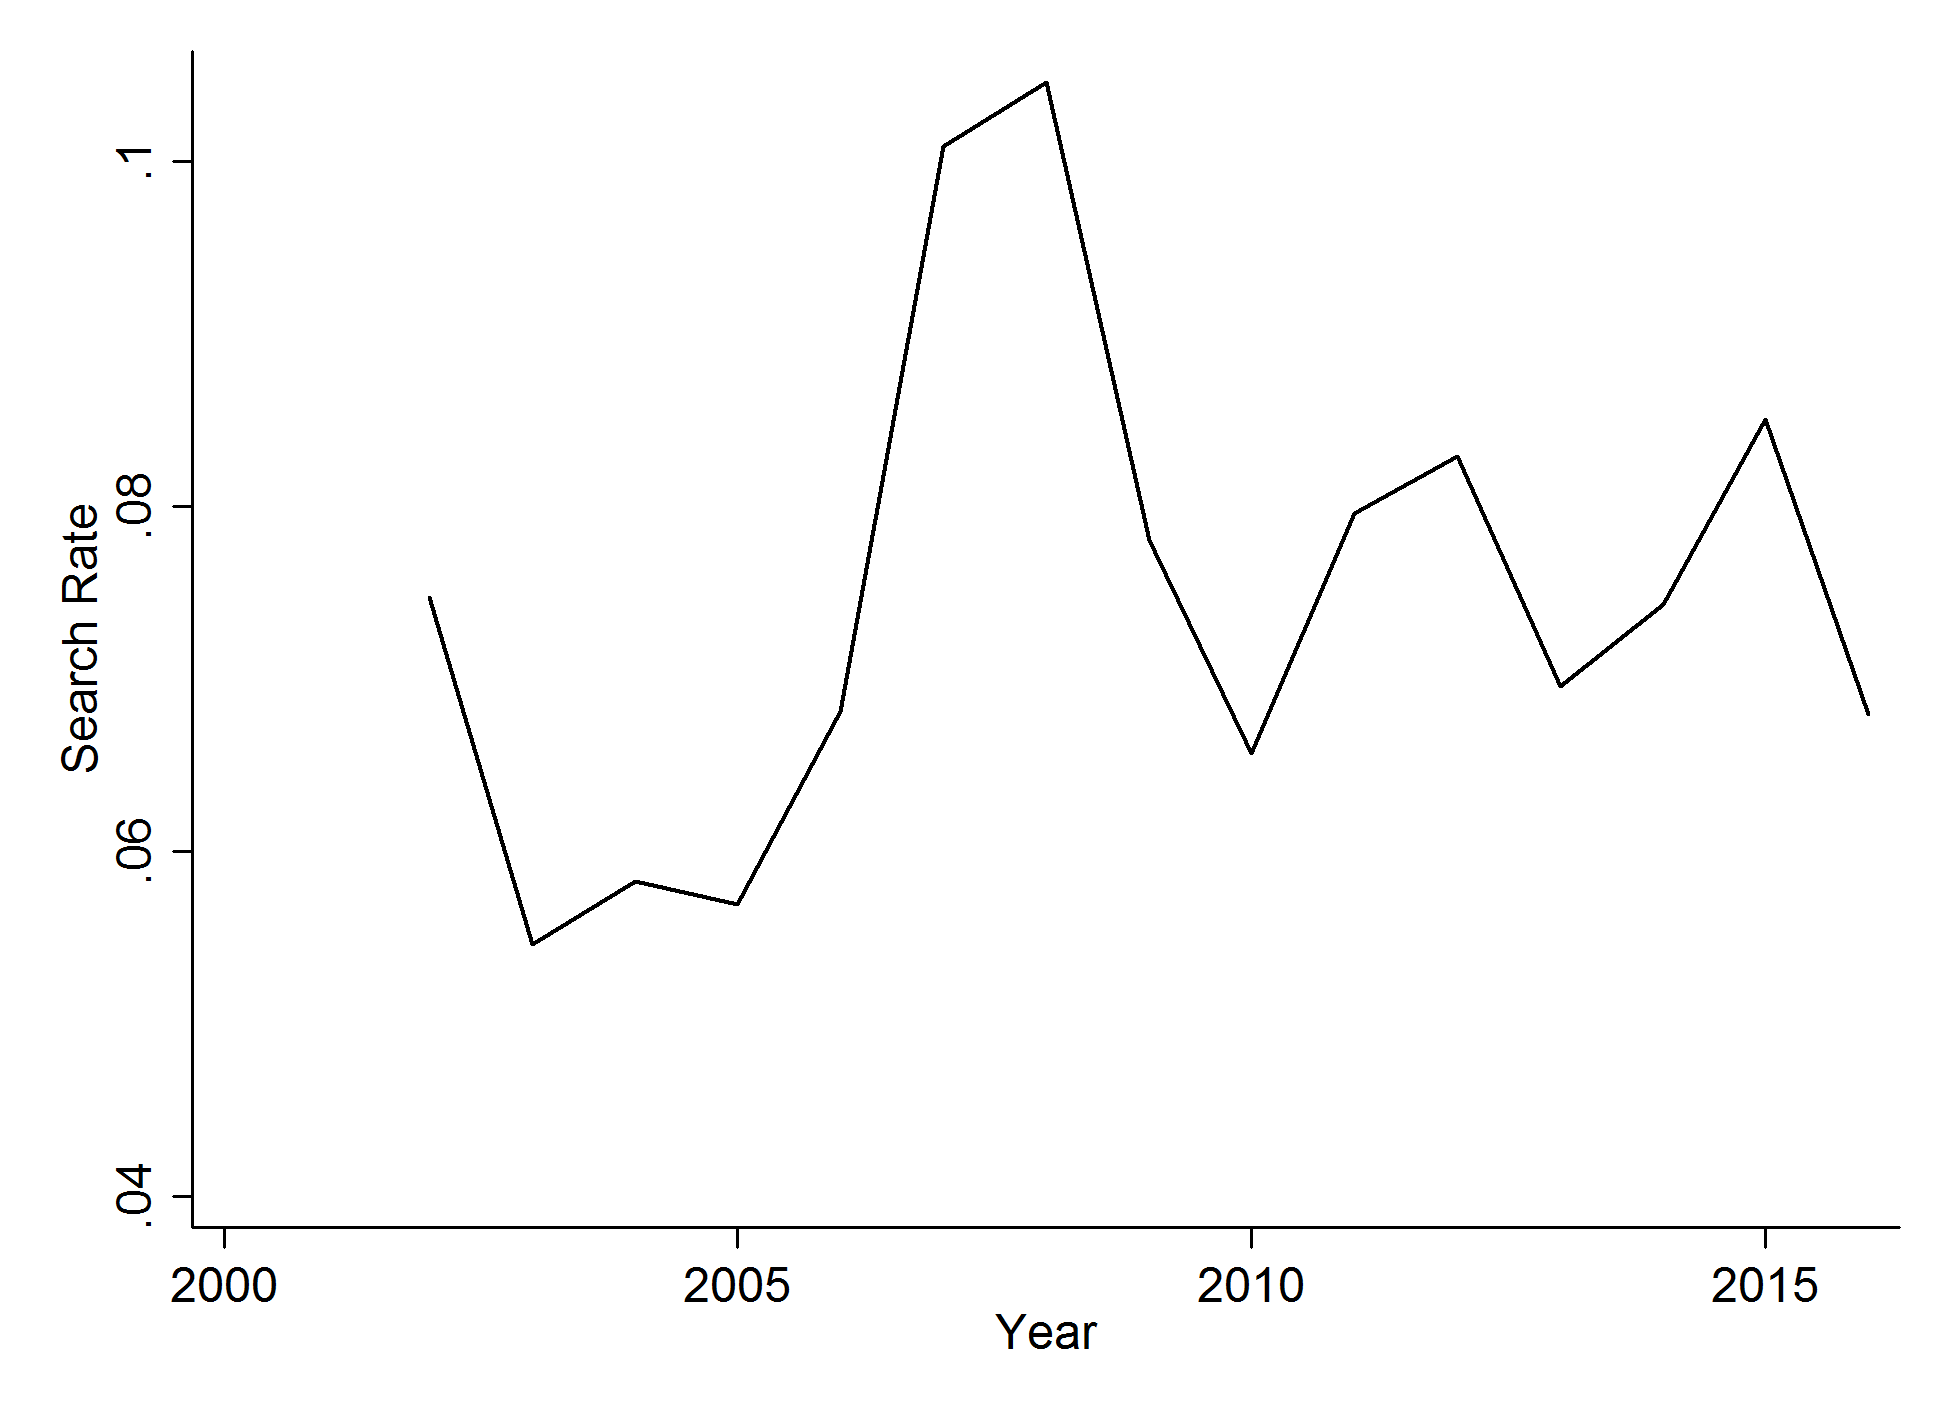
Figure 2.1
Figure 3.1 -- 3.2 -- 3.3a -- 3.3b -- 3.3c
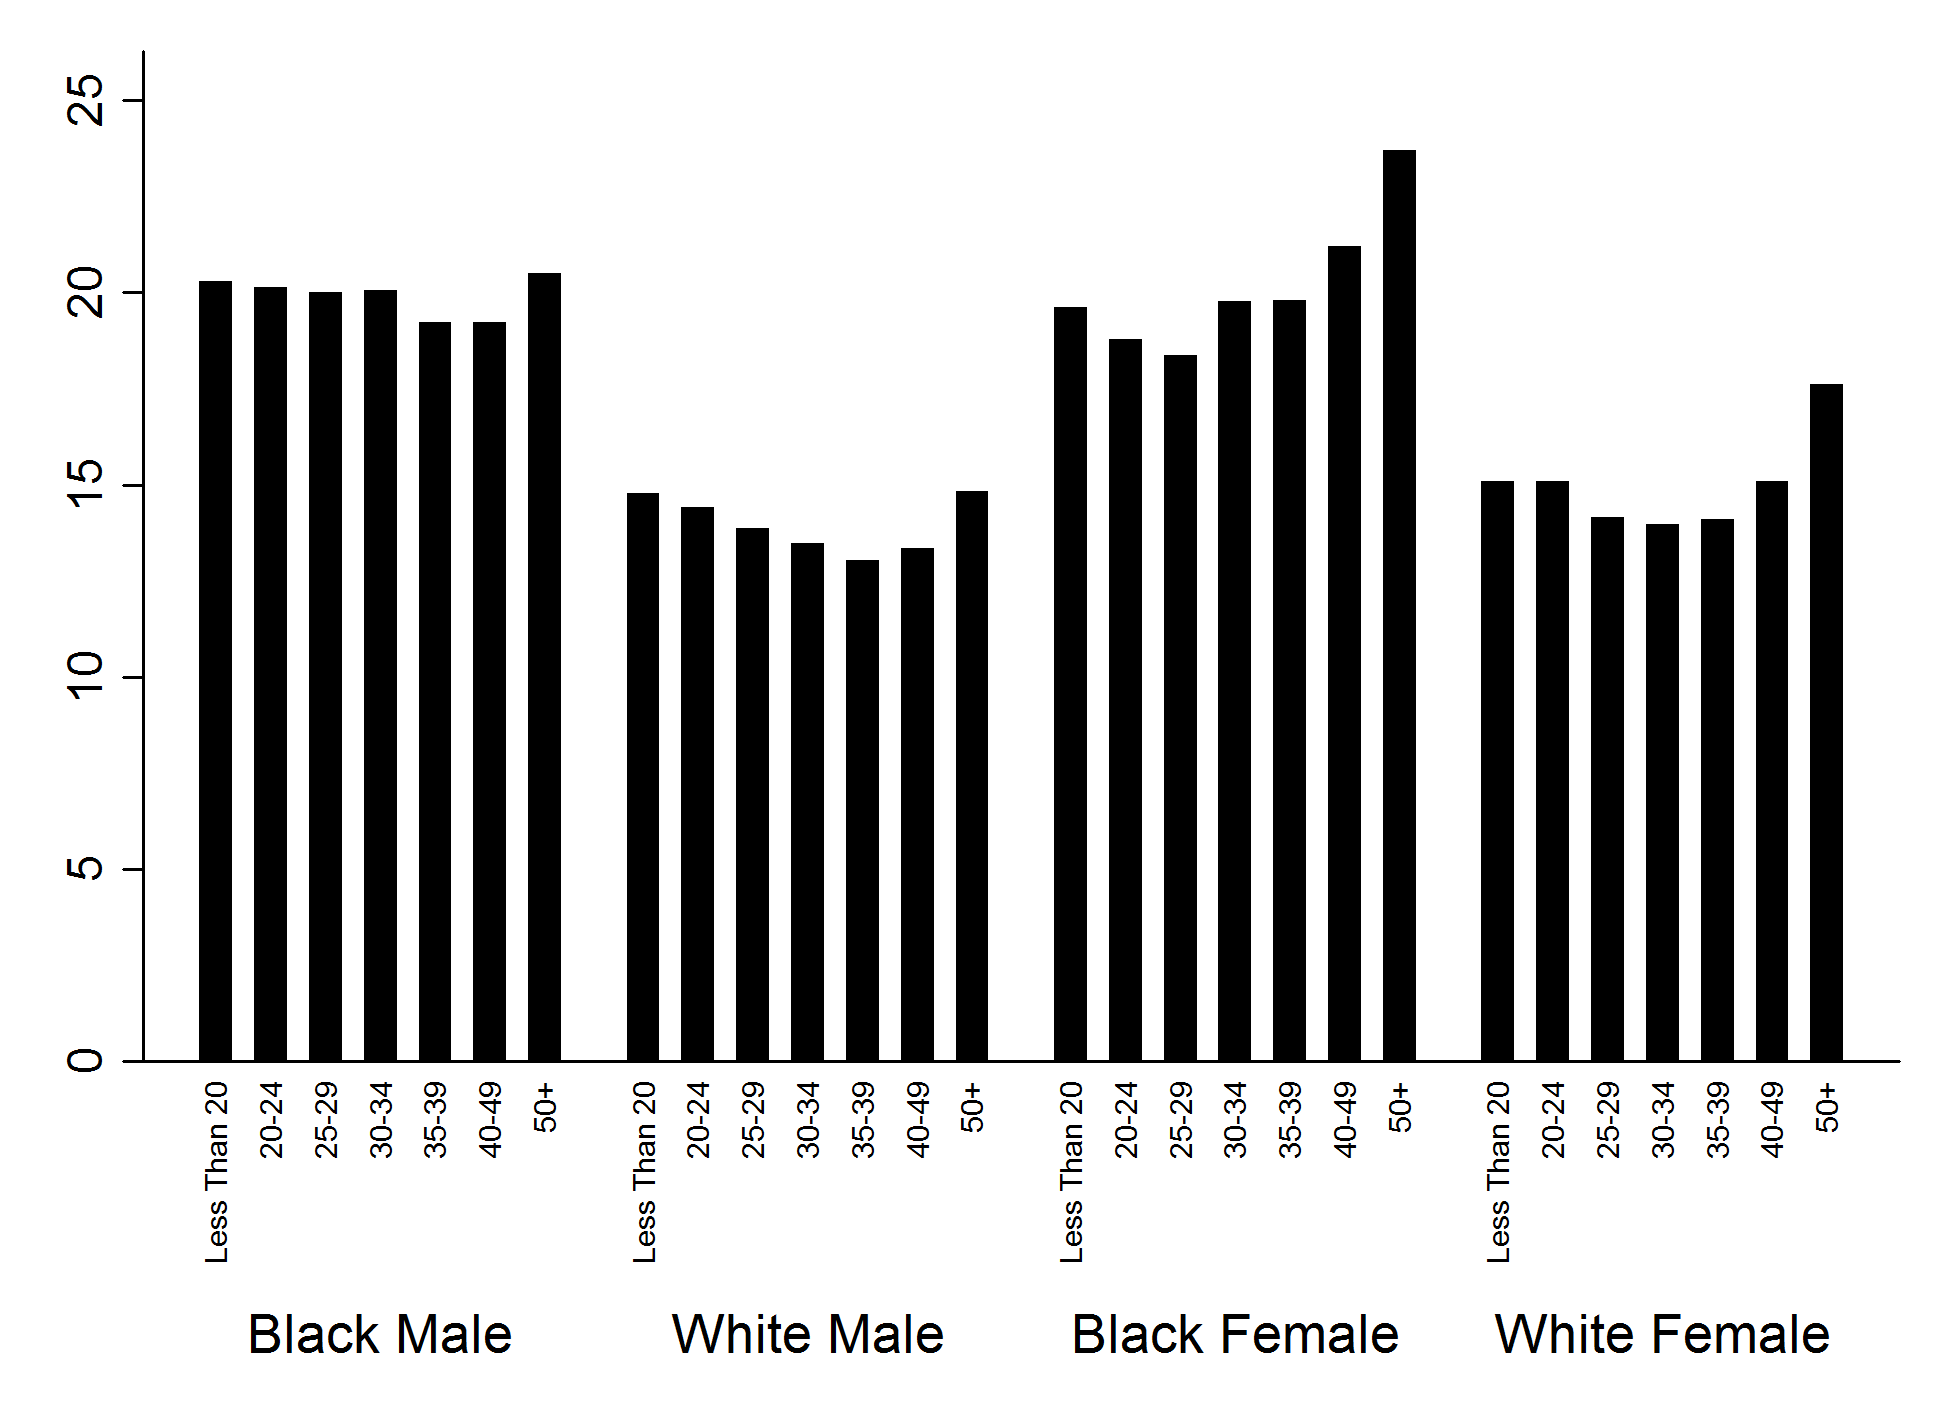
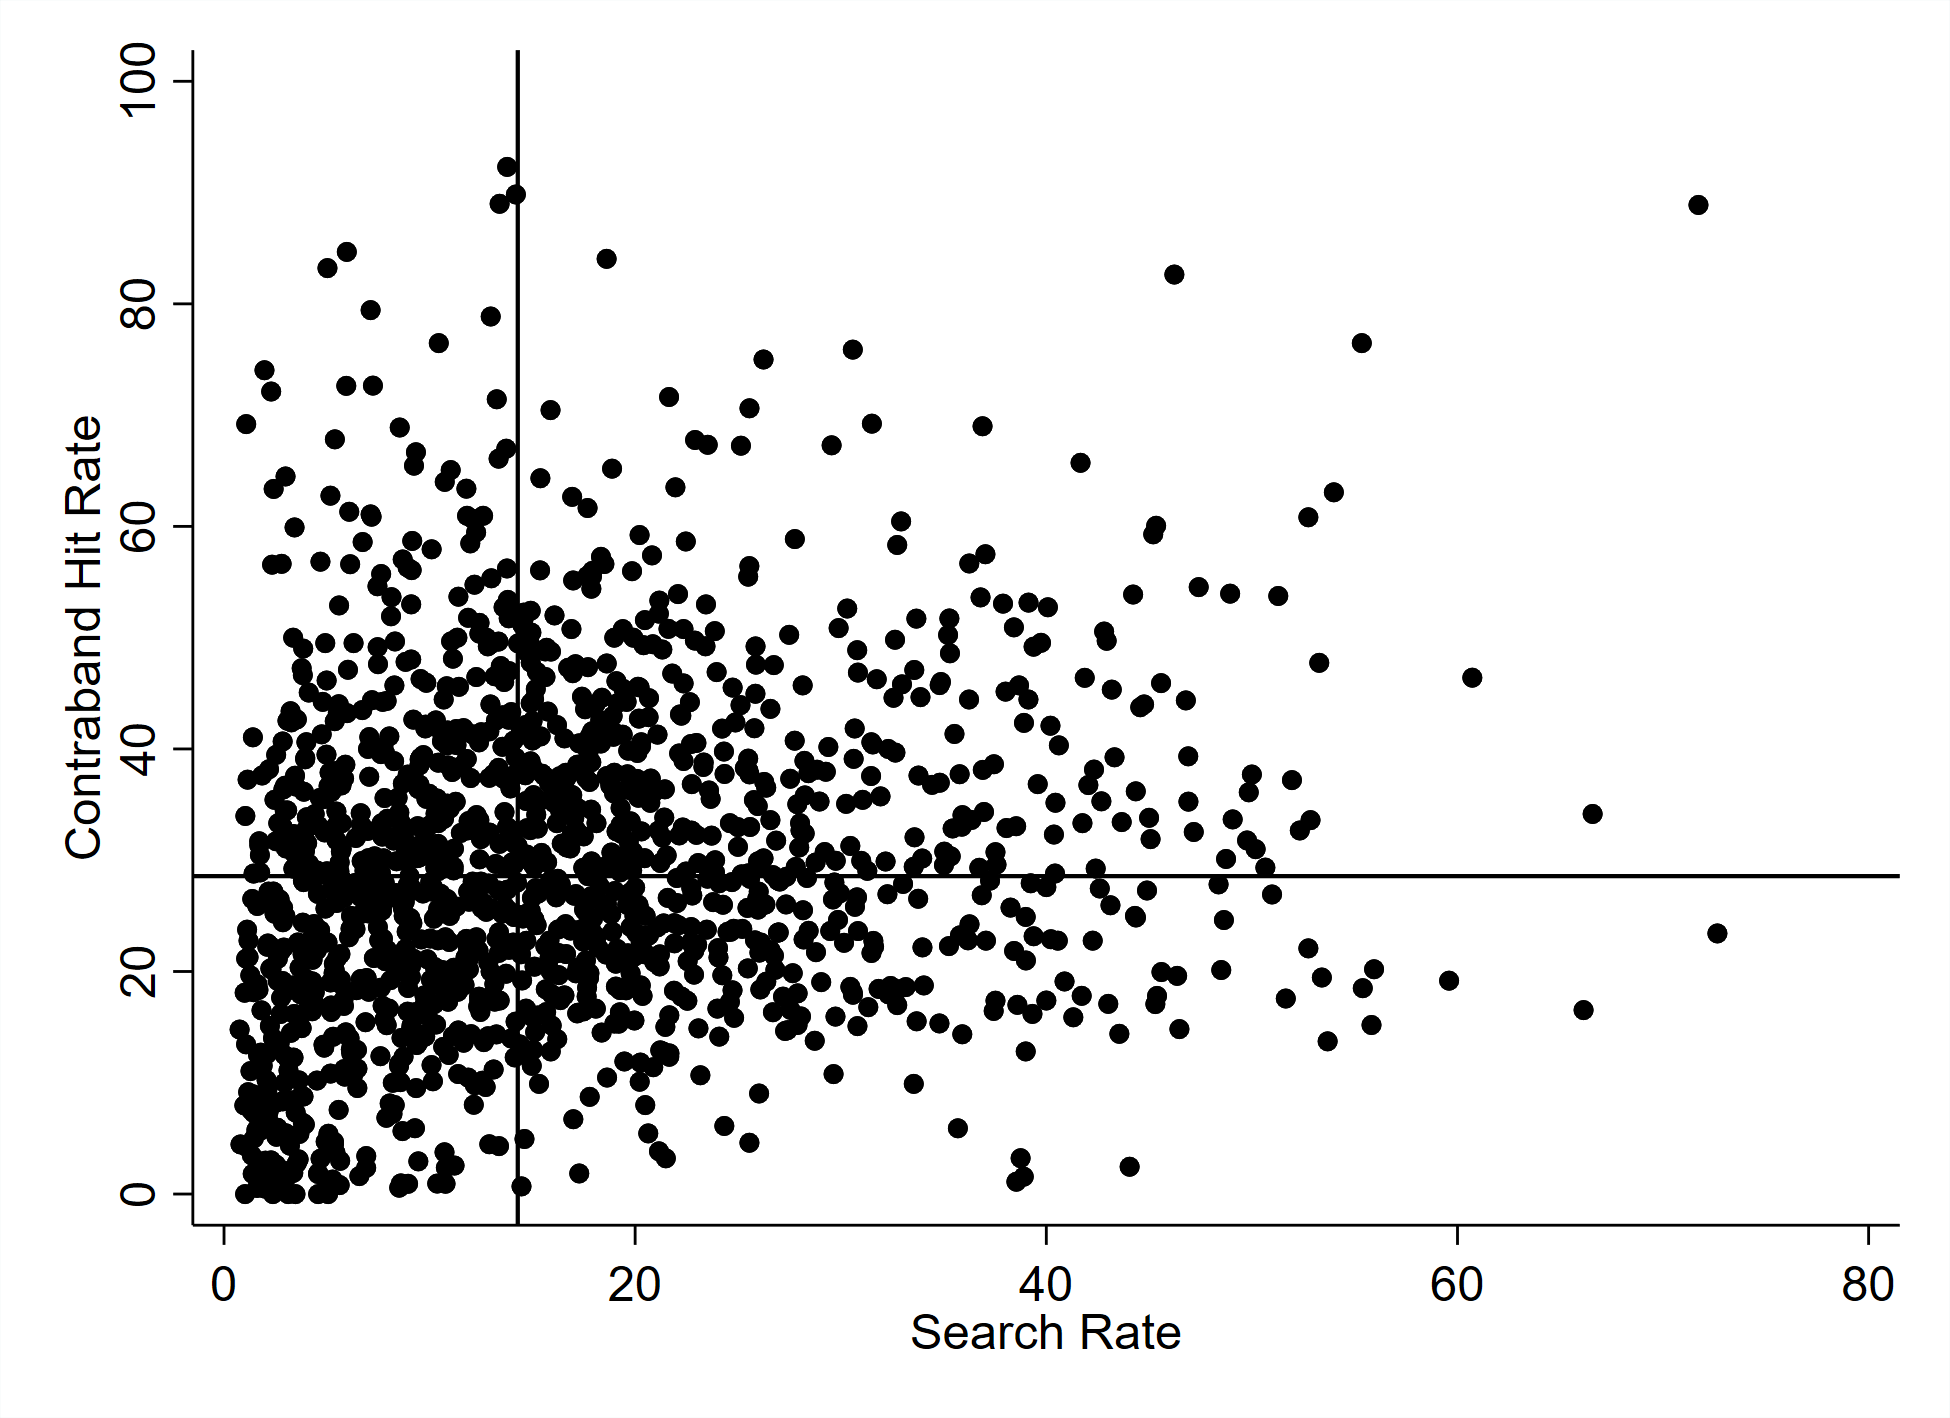
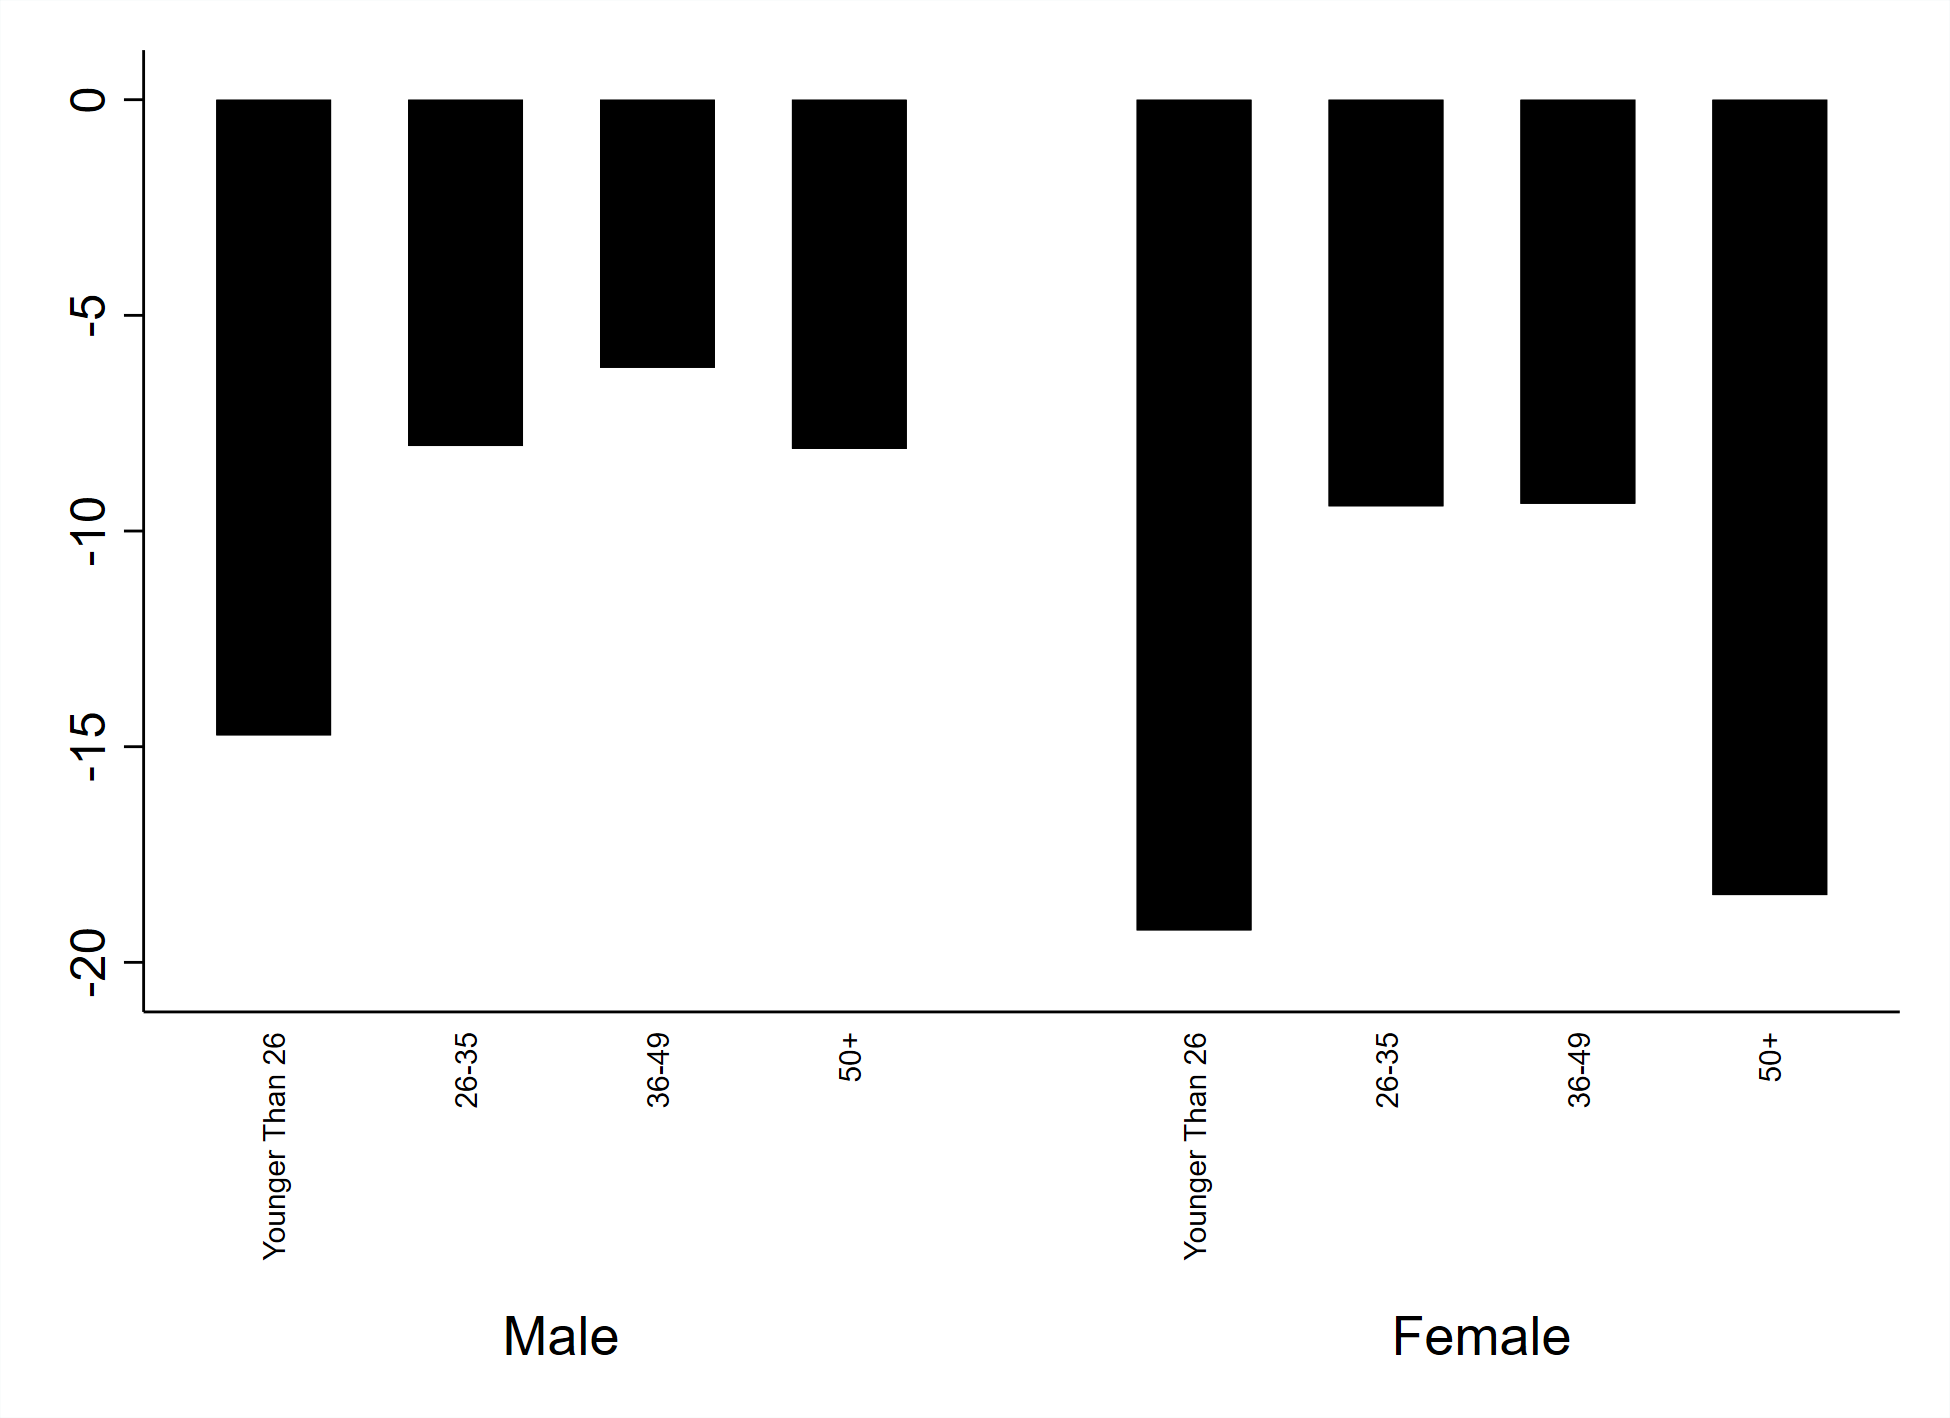
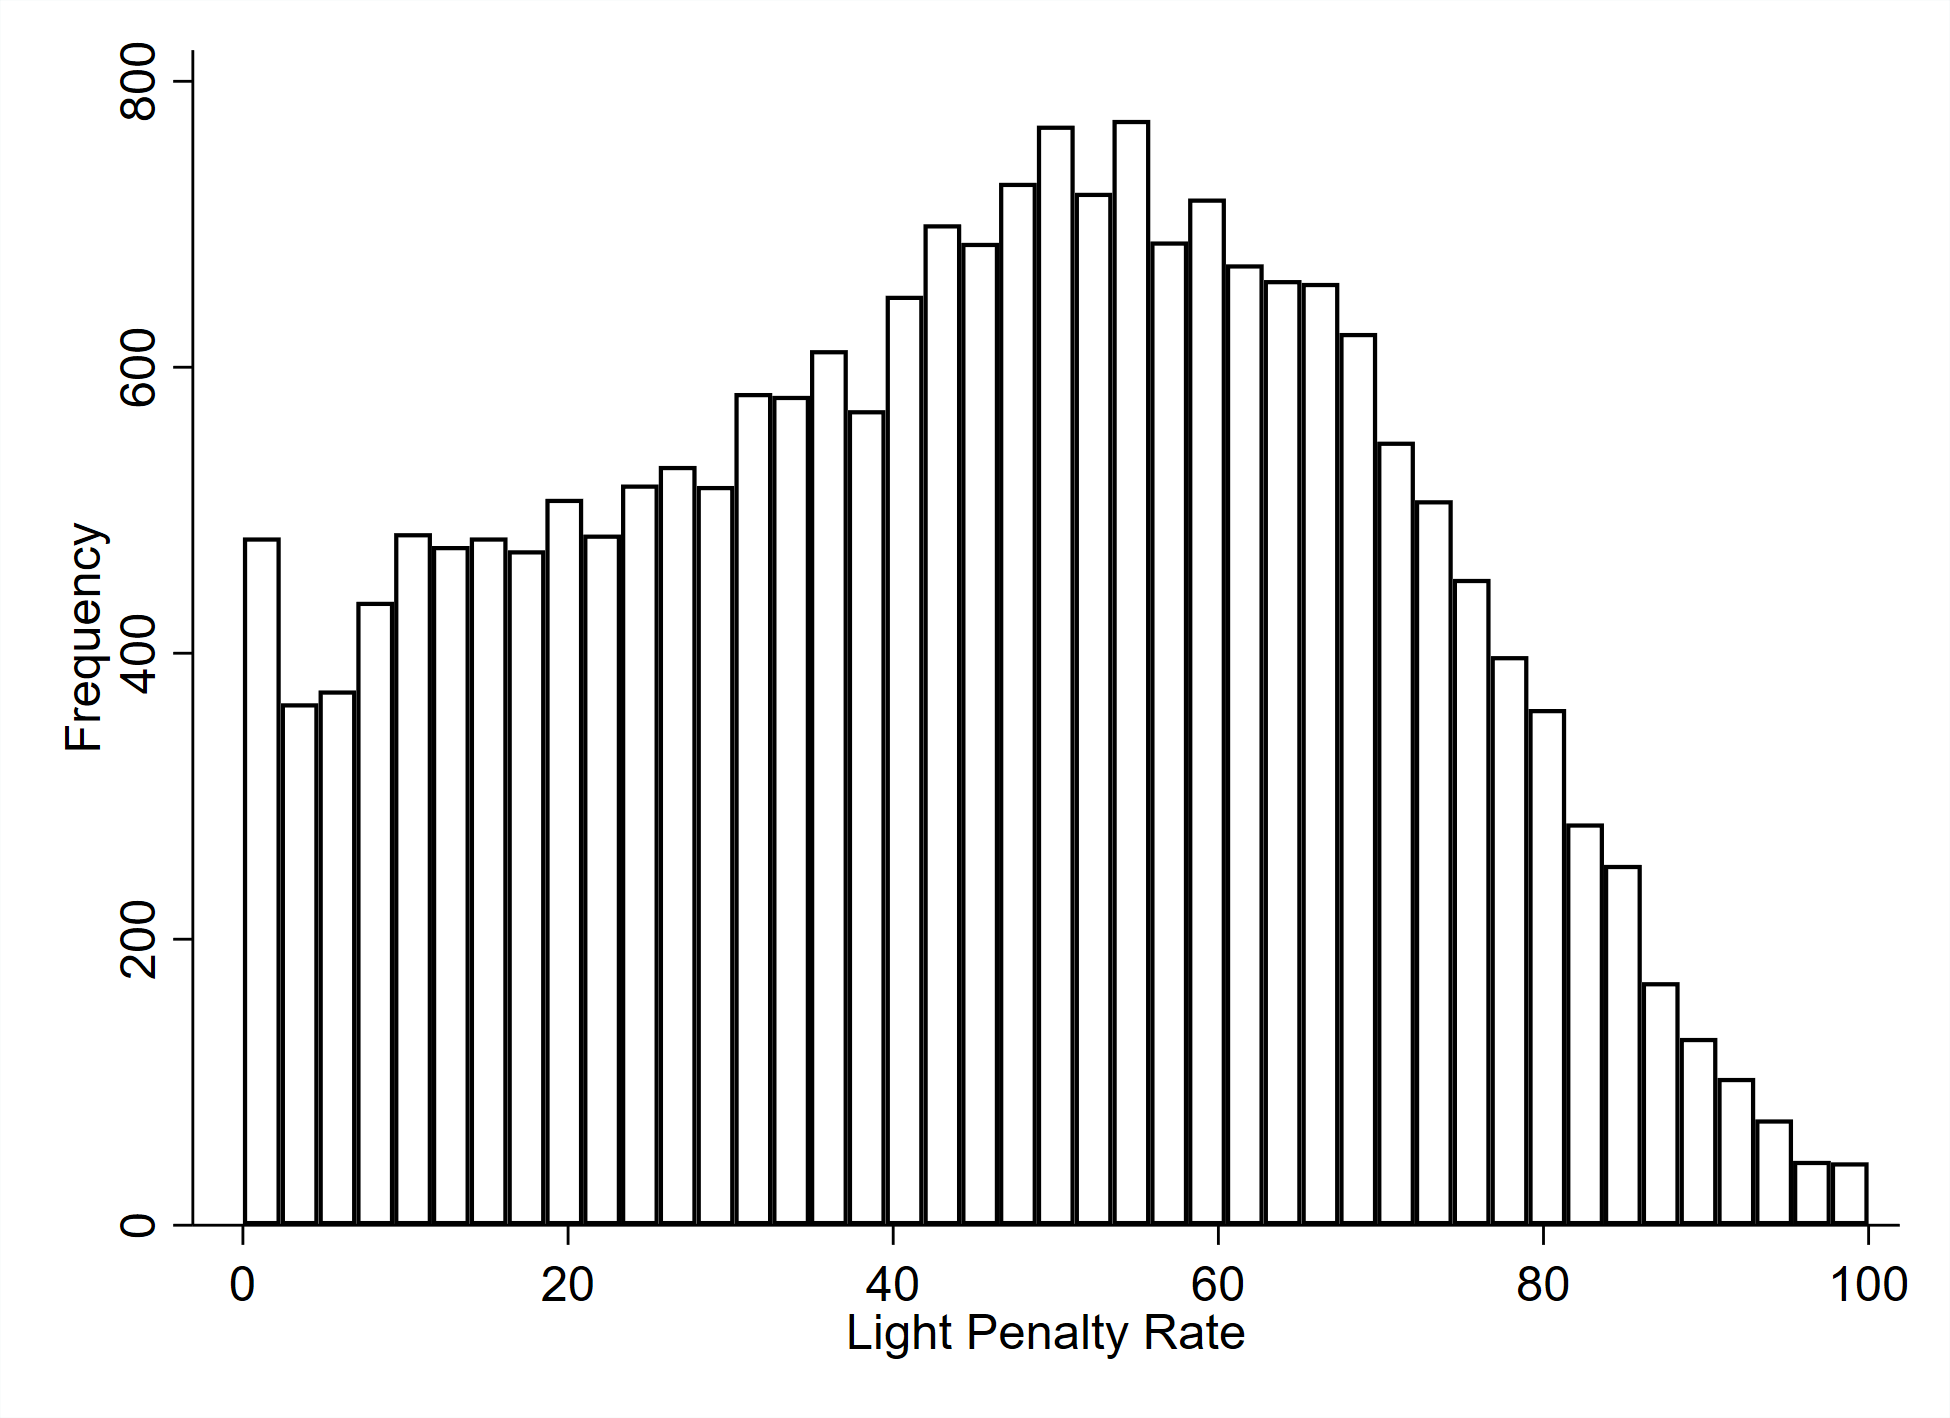
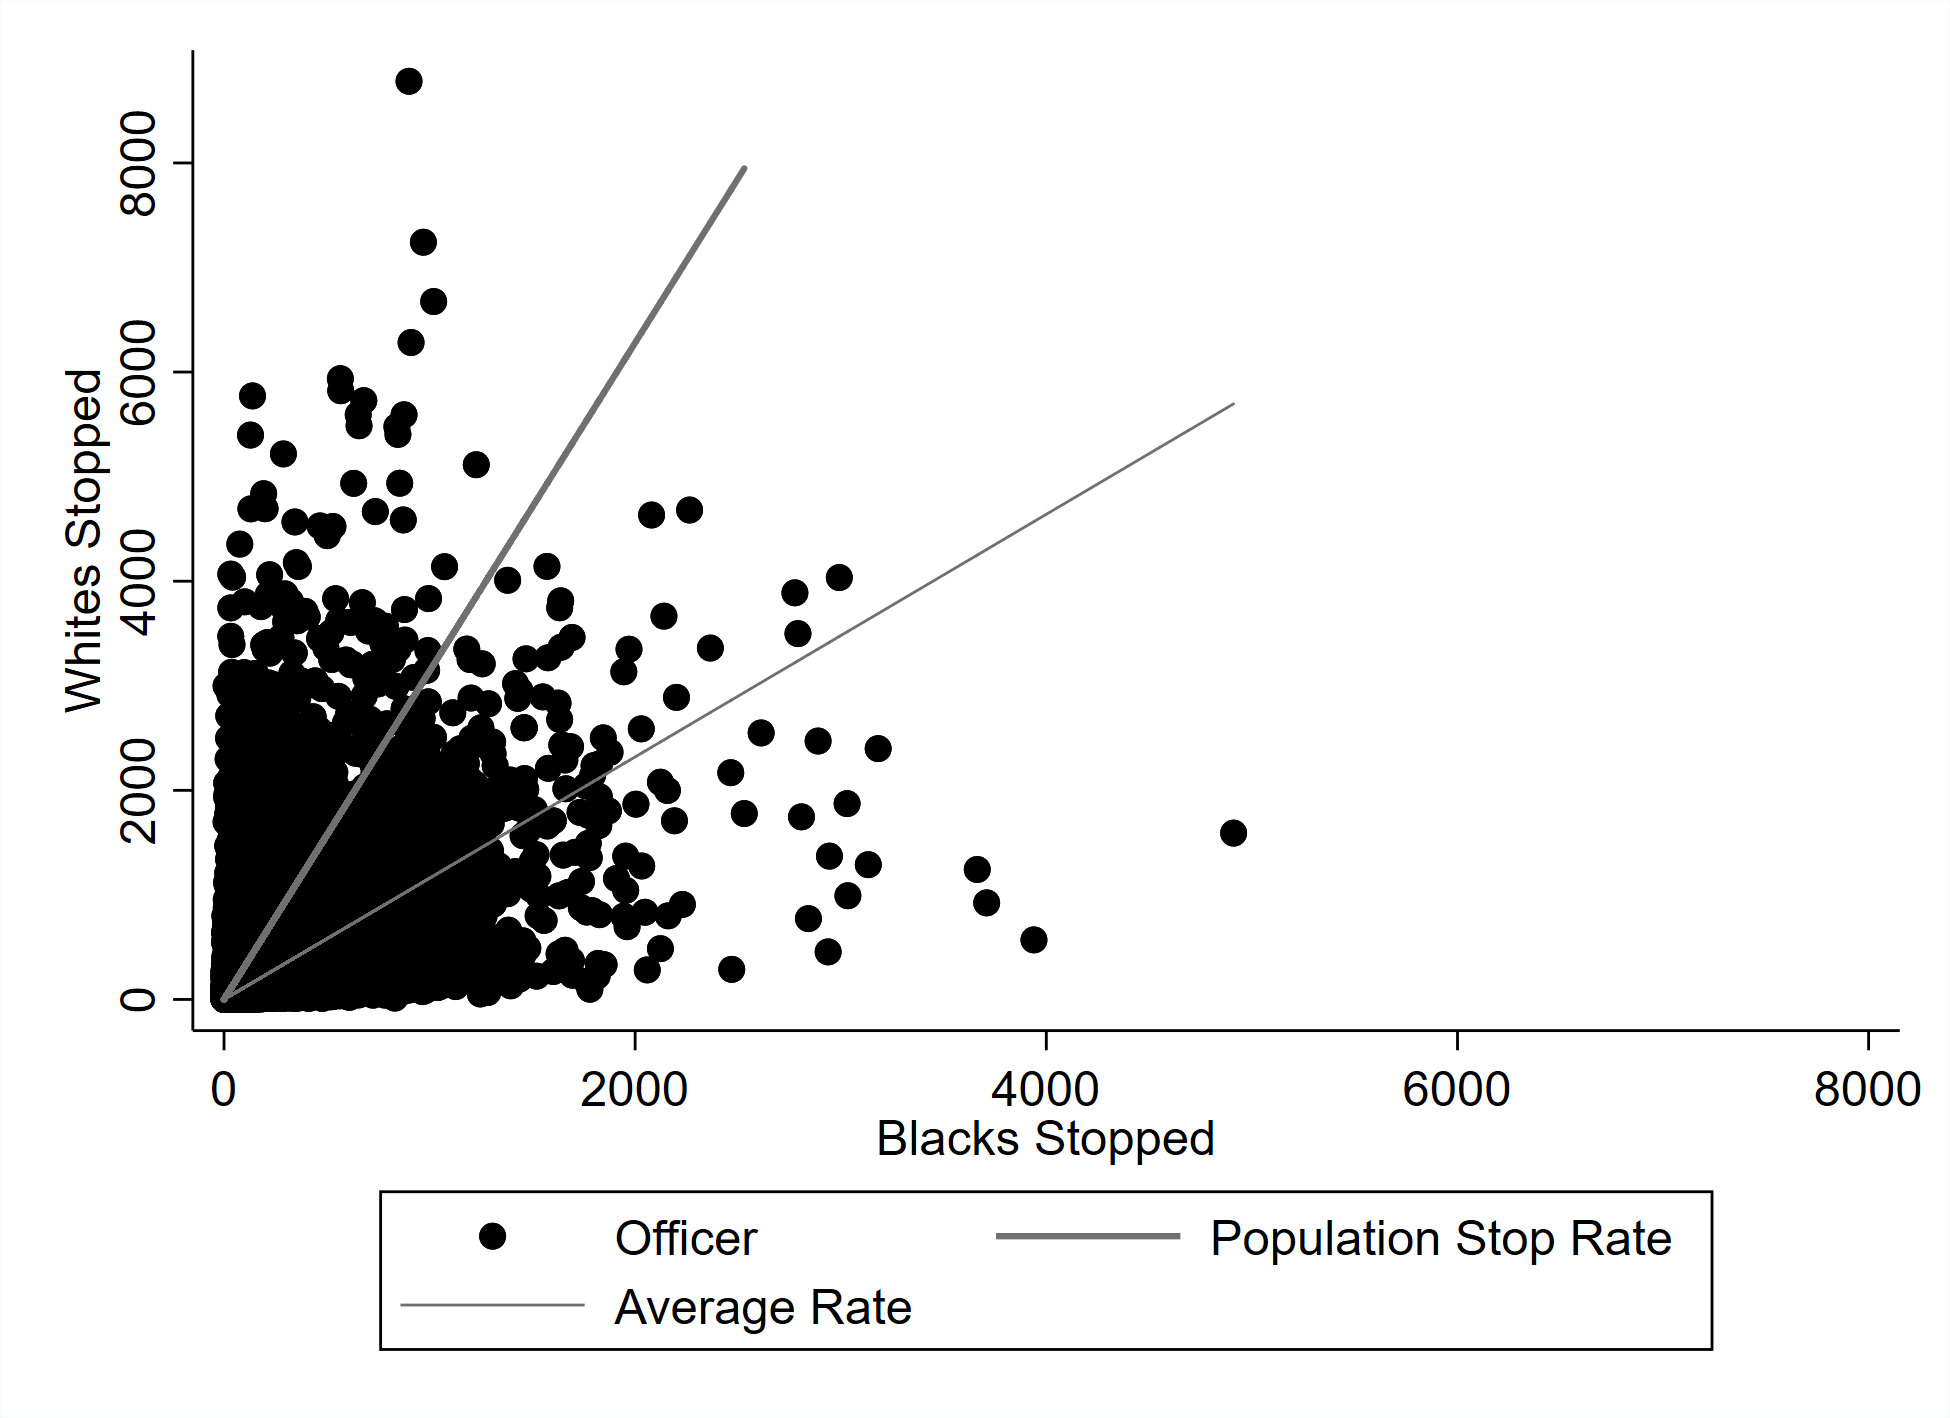
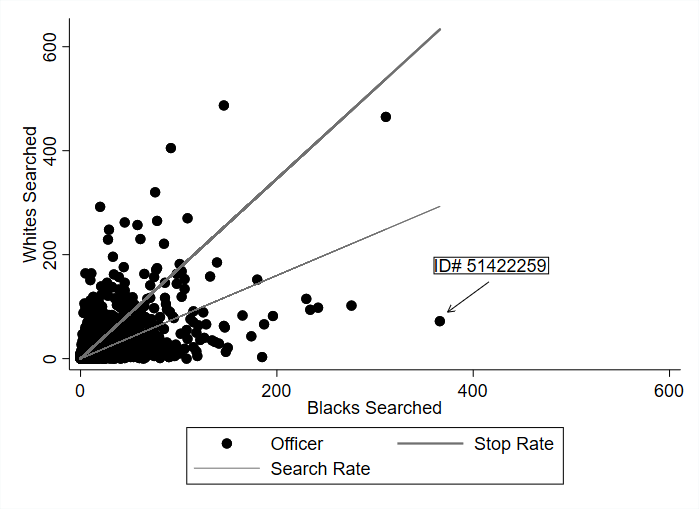
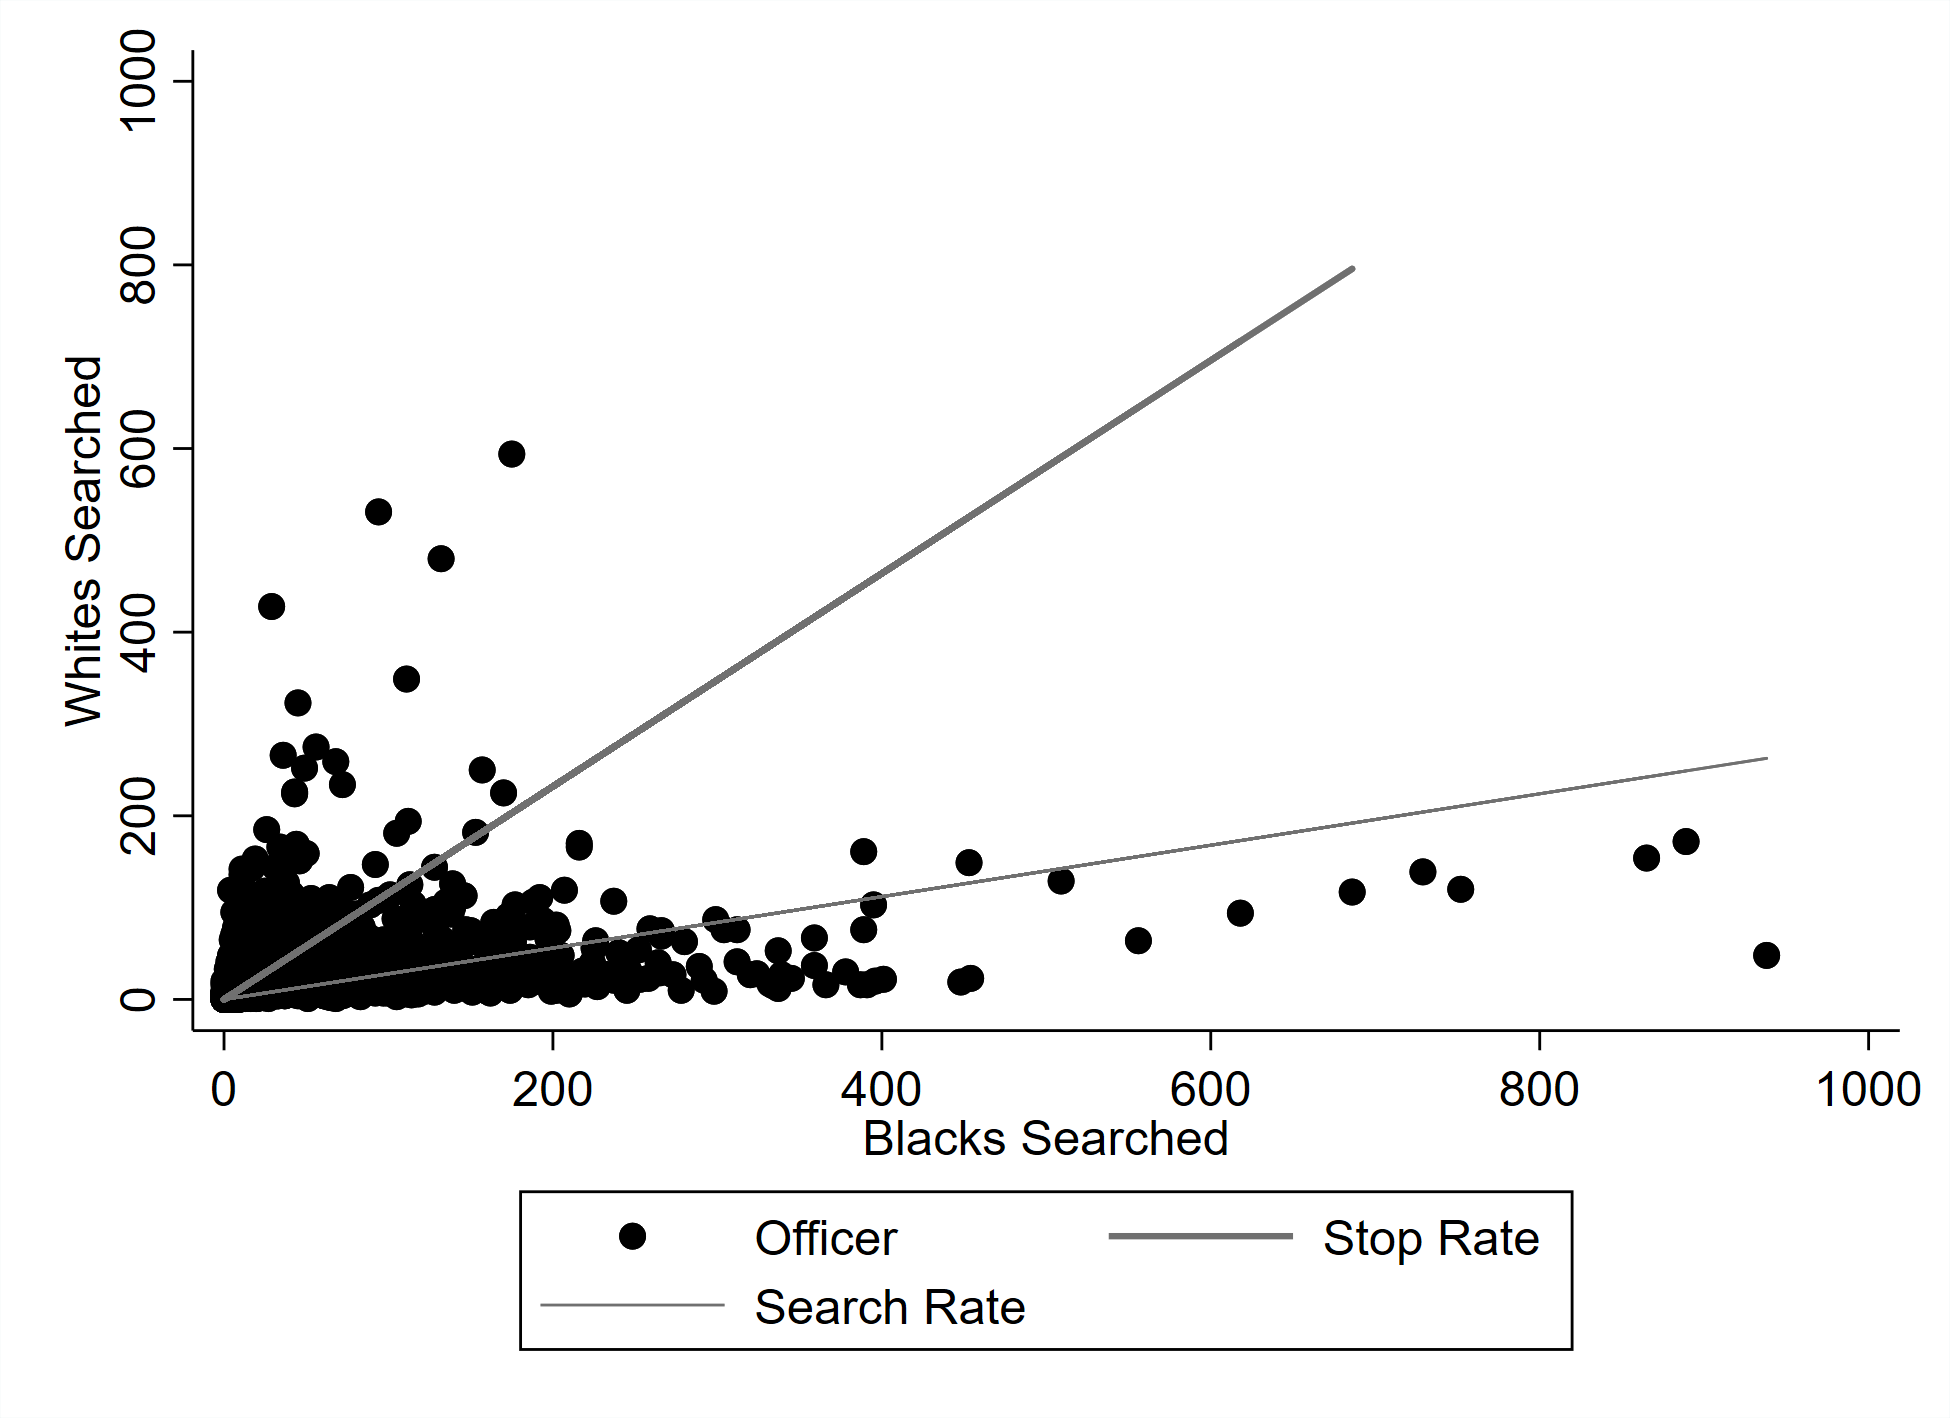
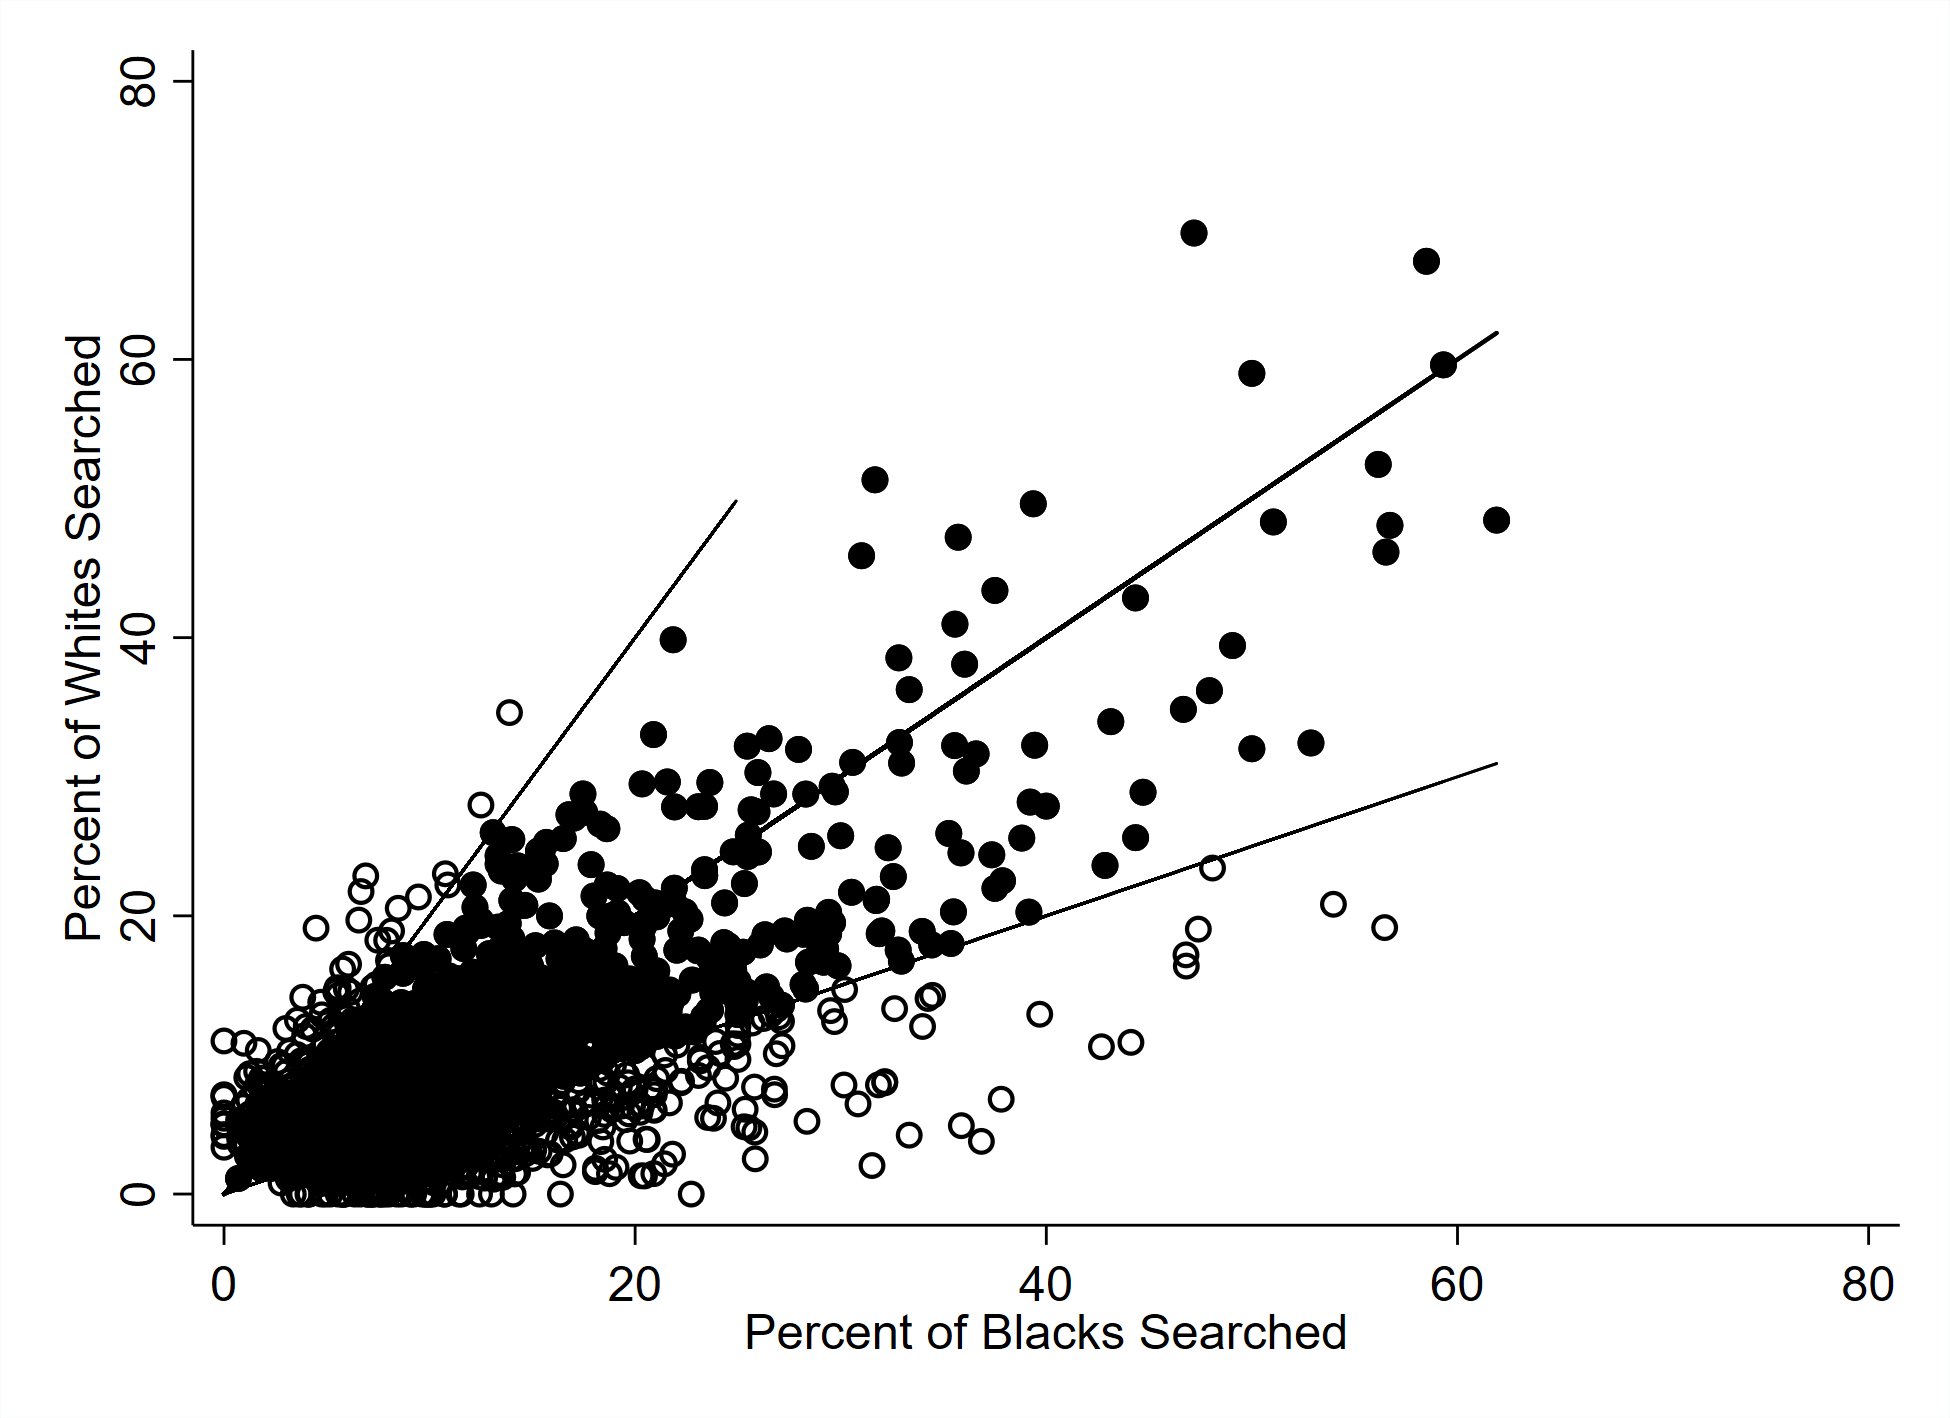
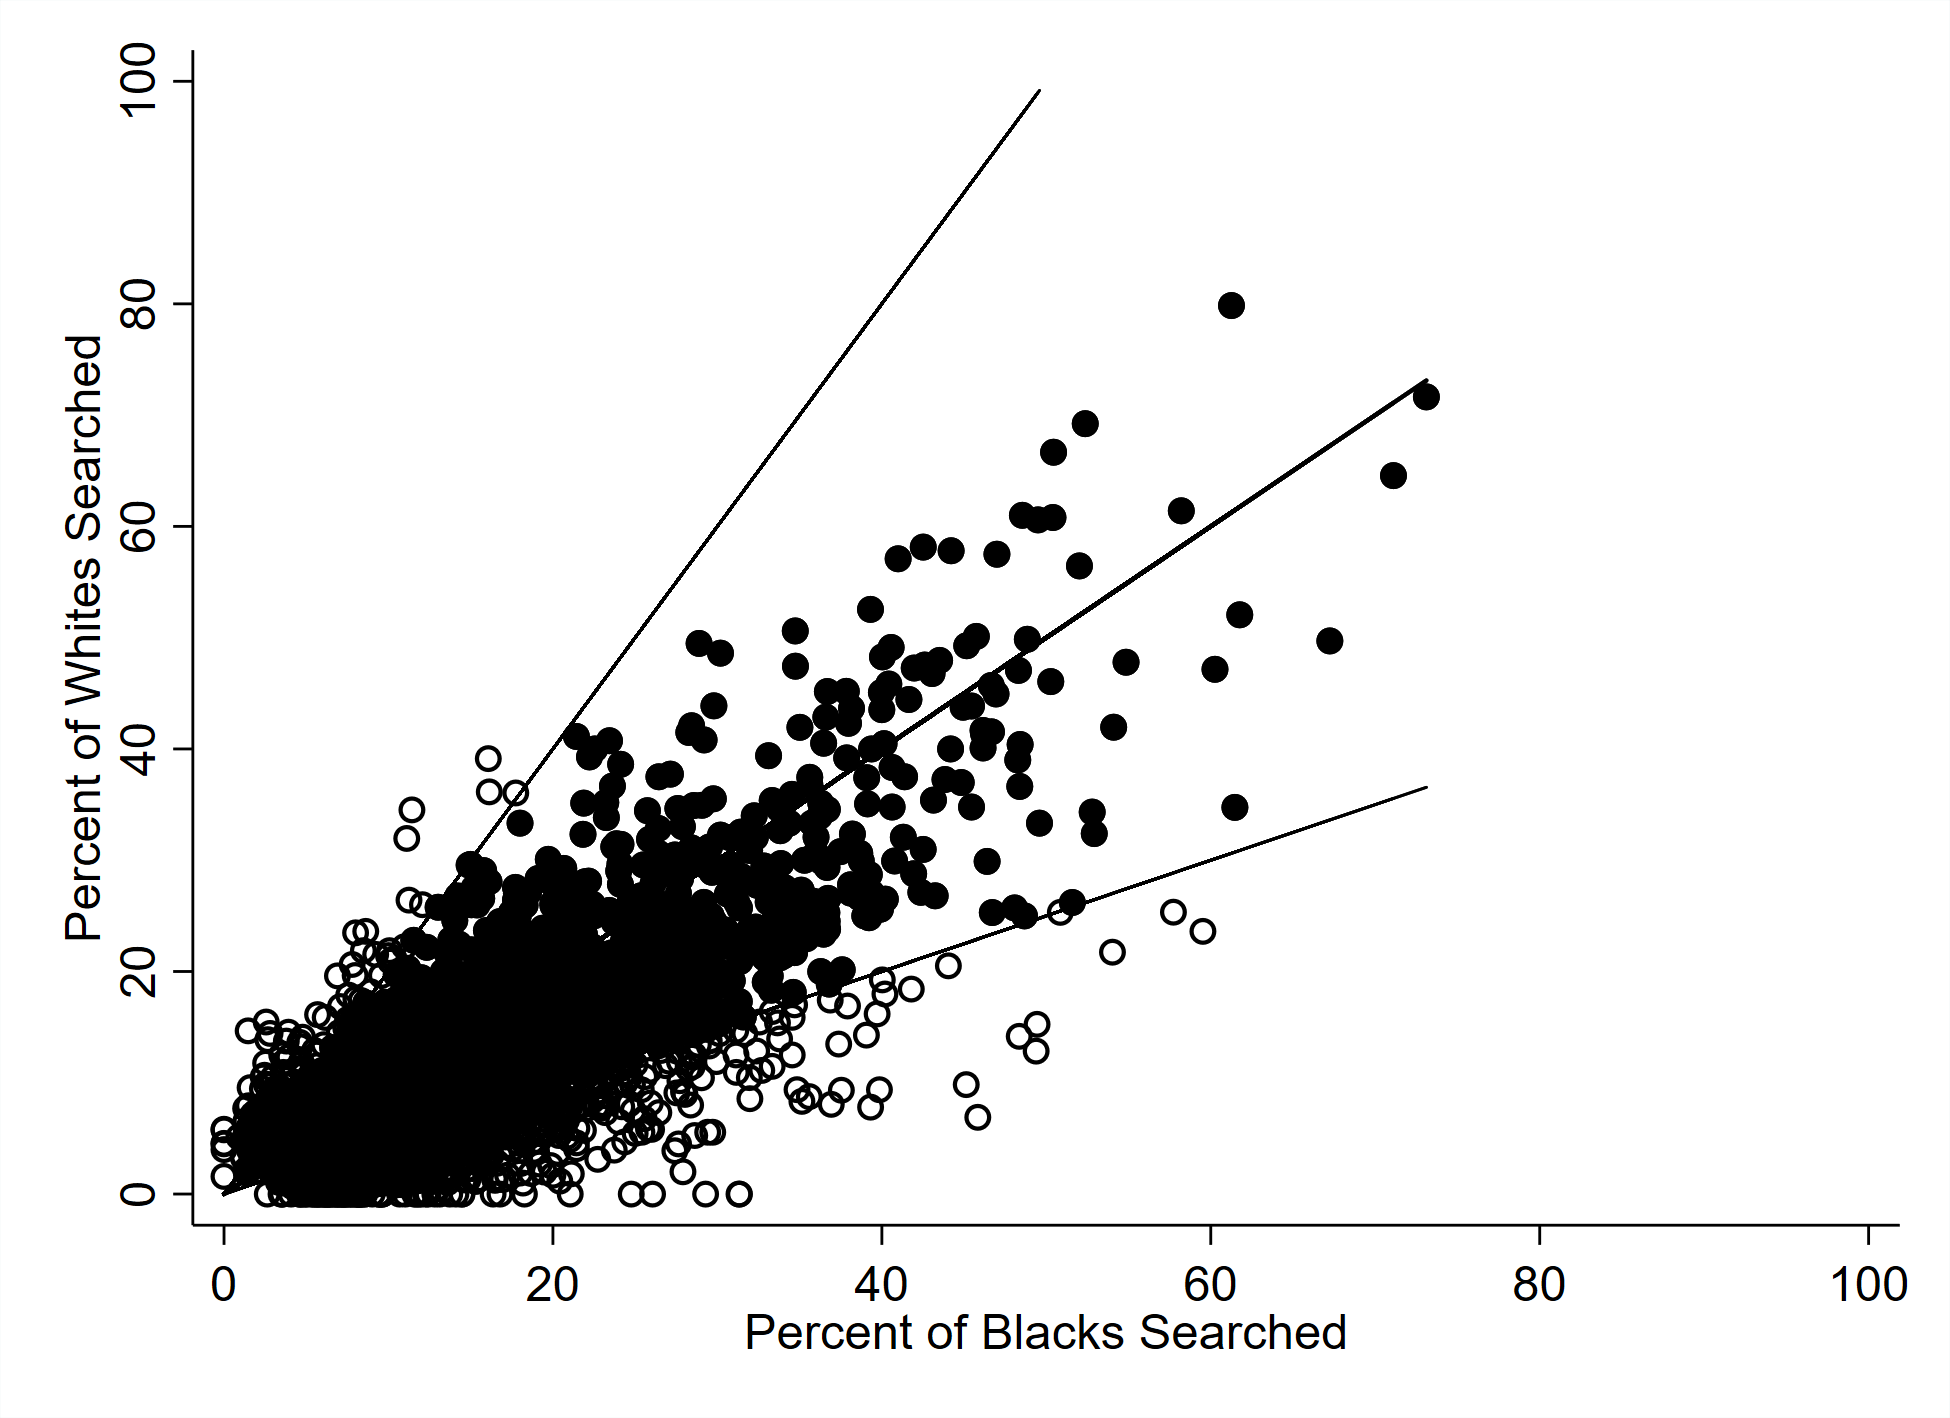
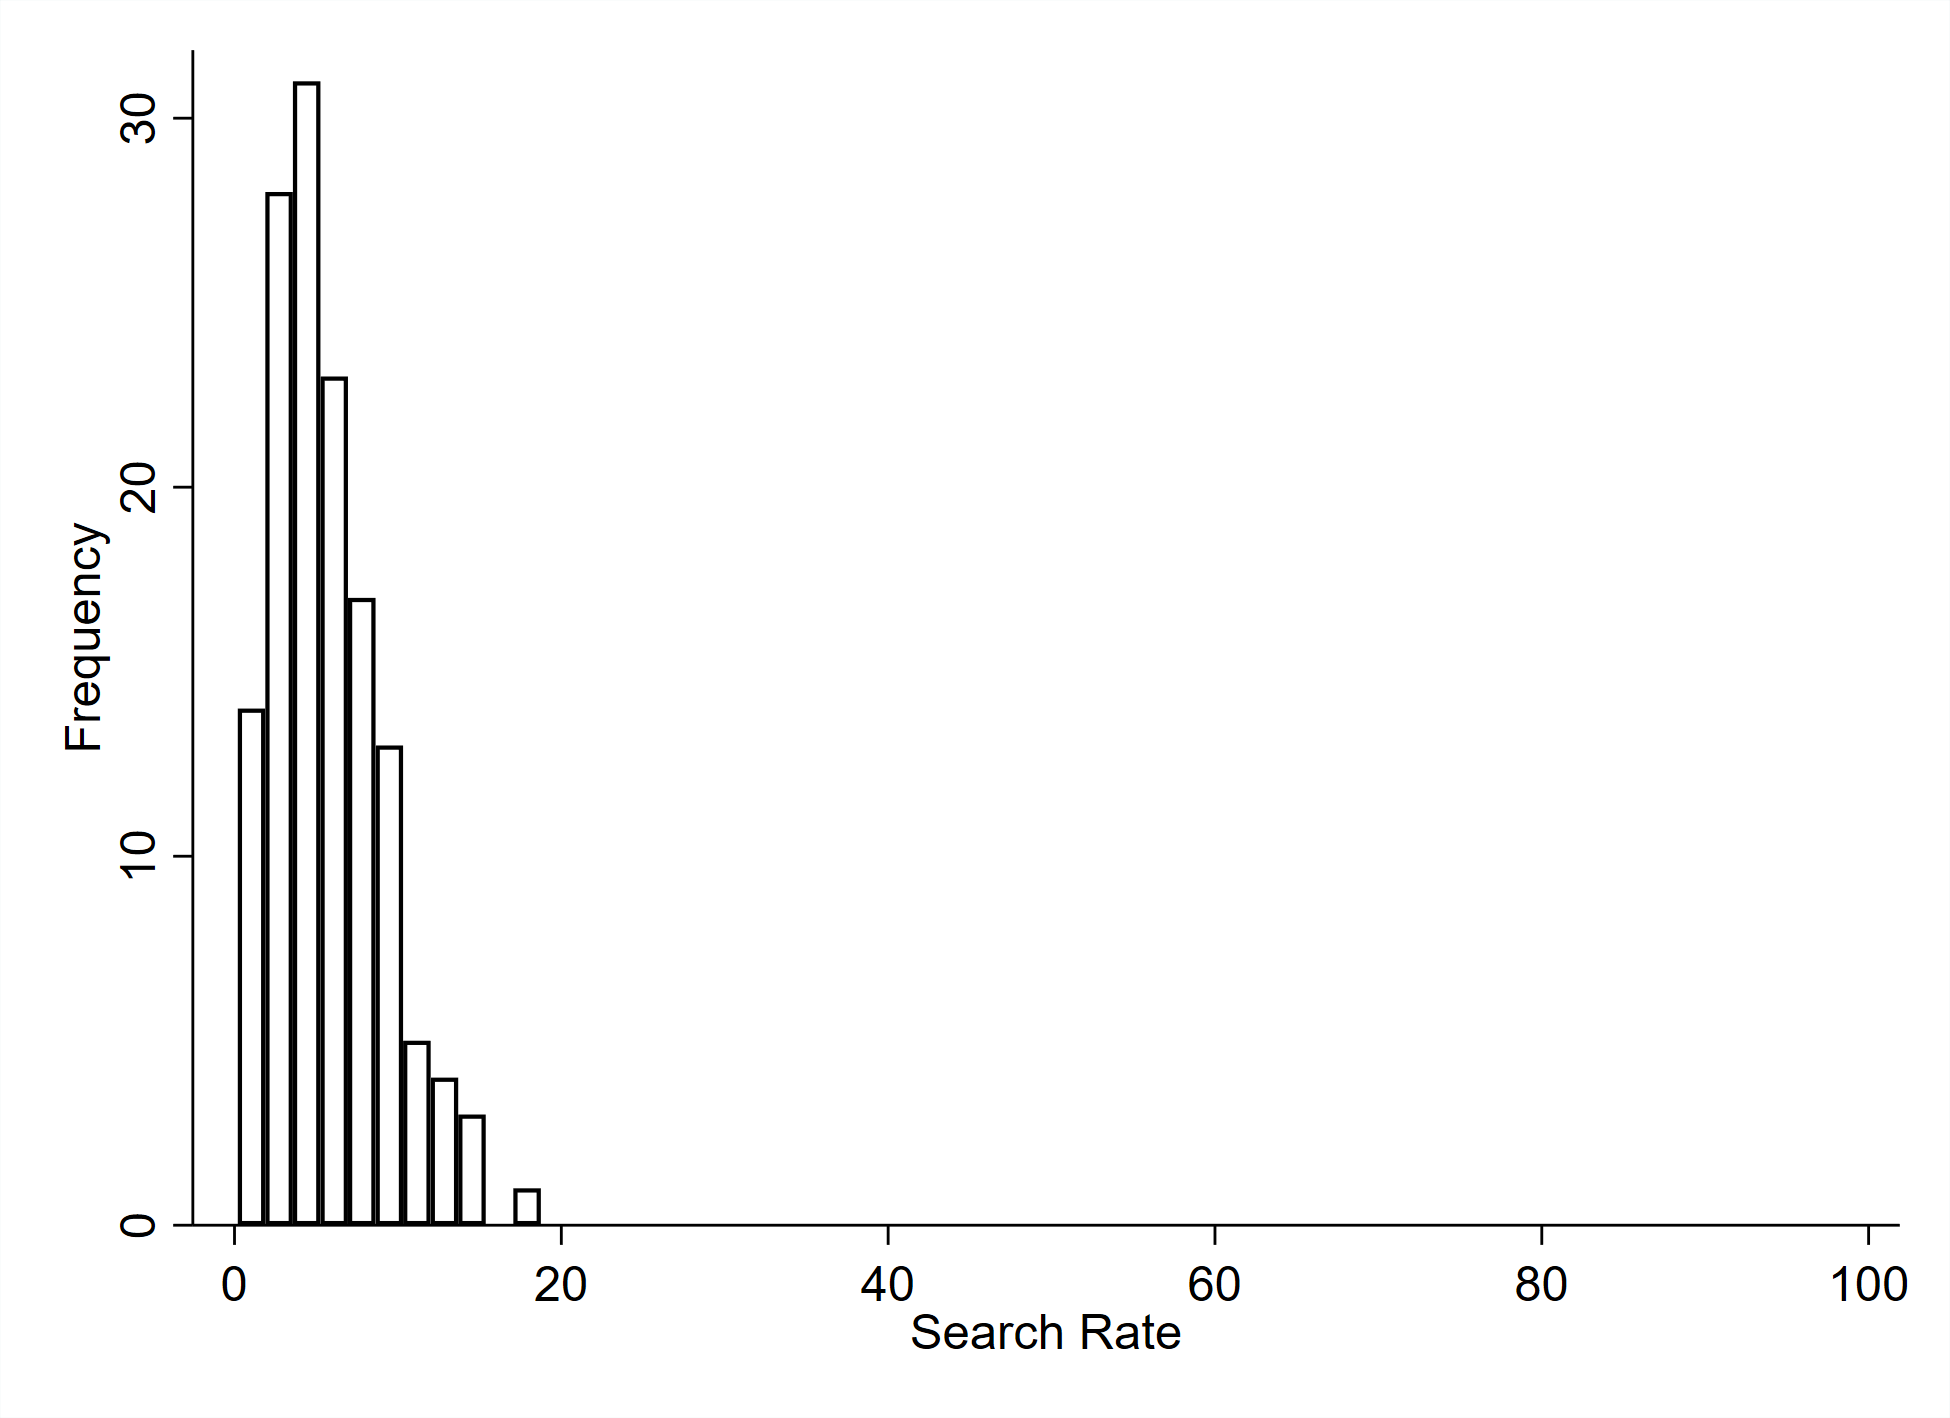
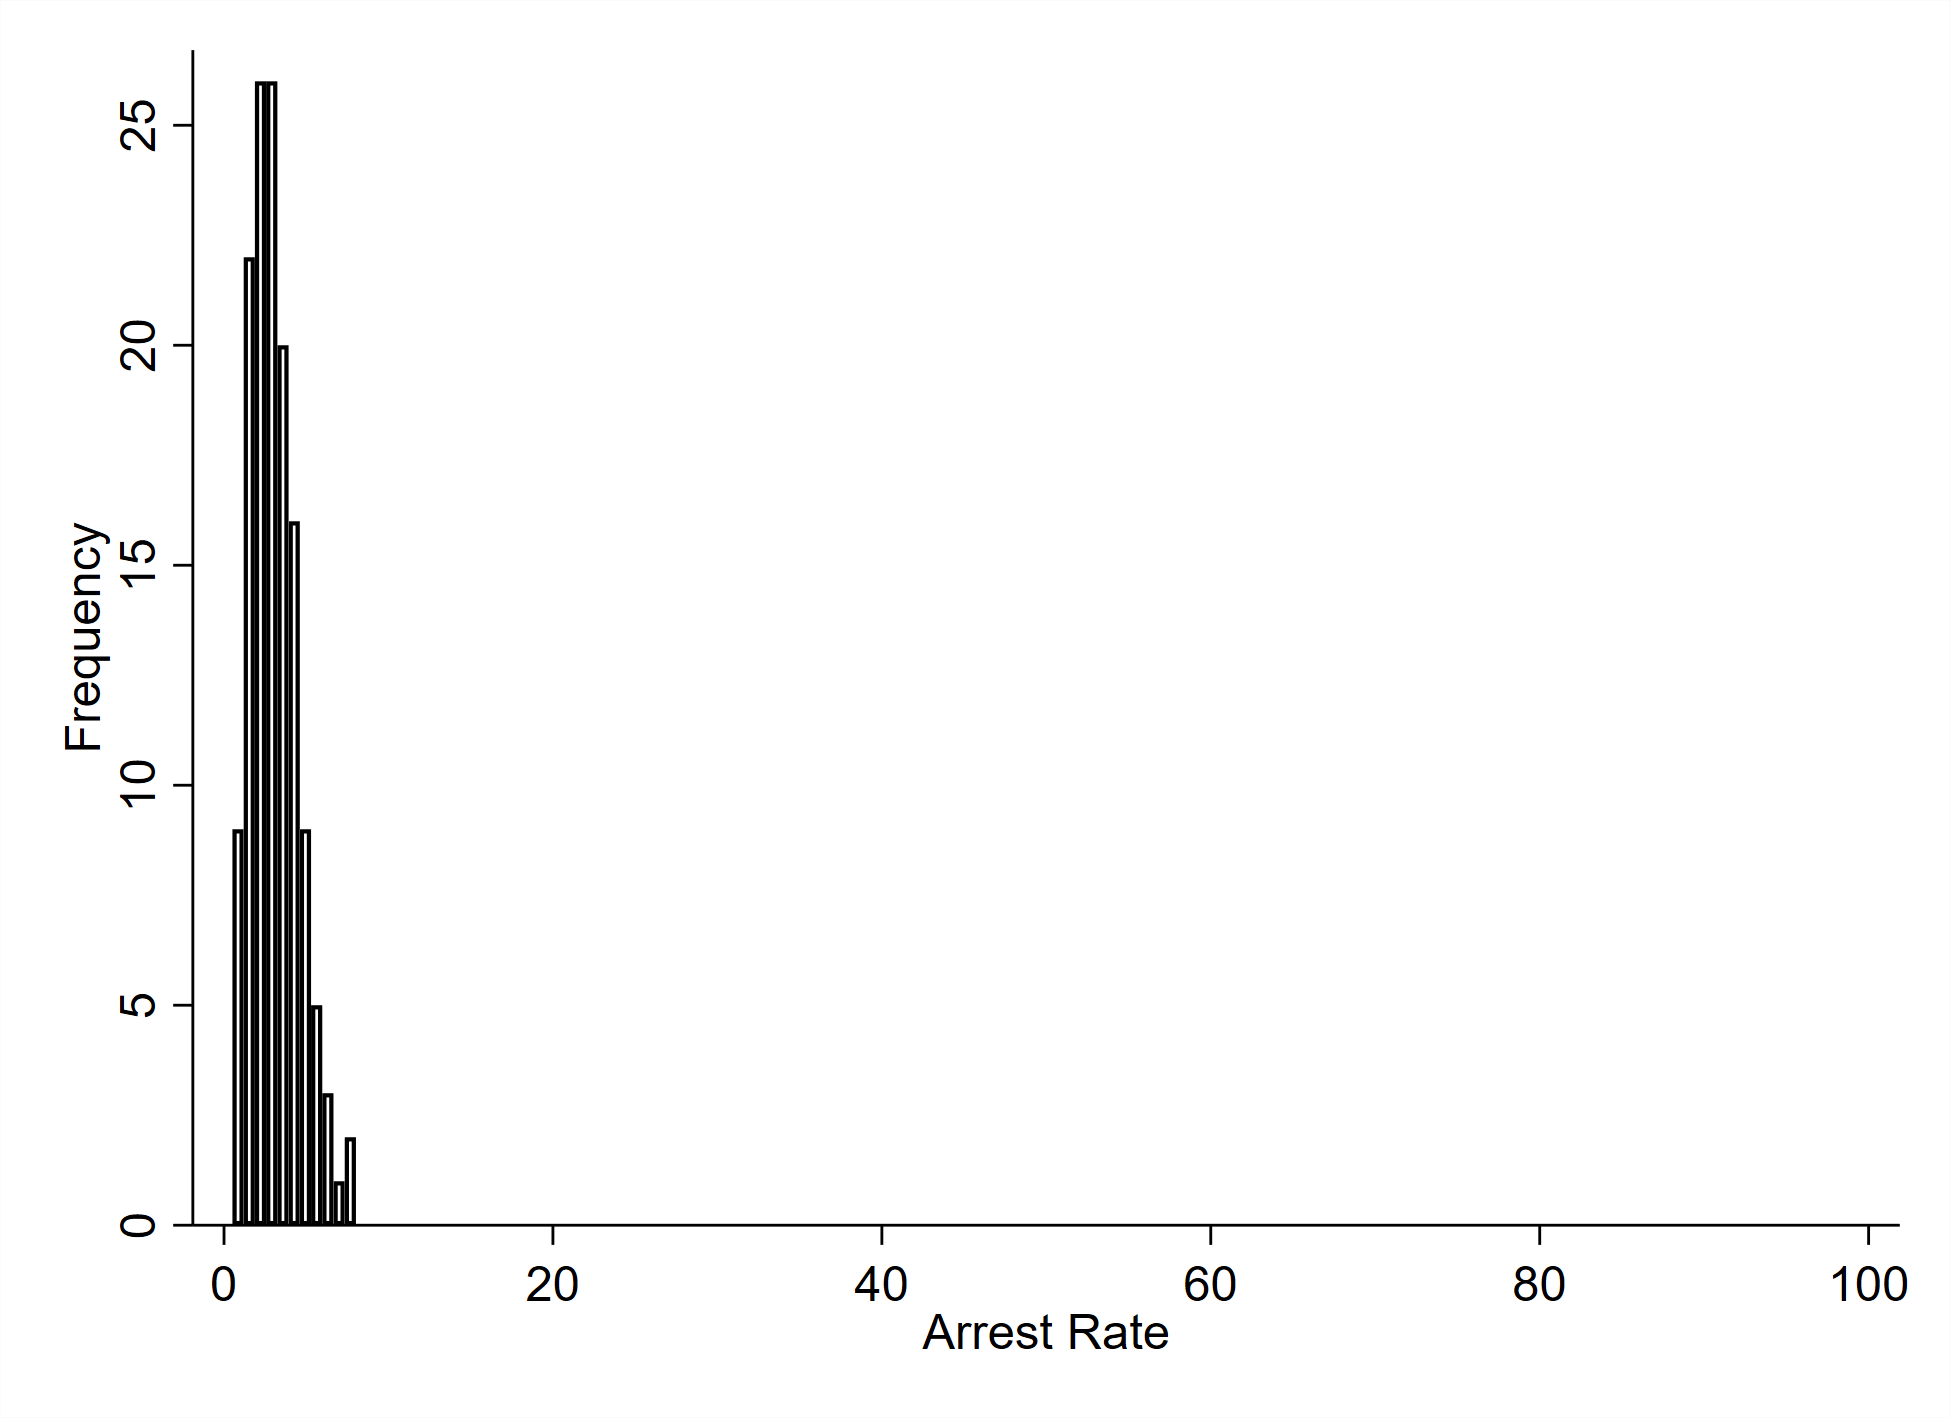
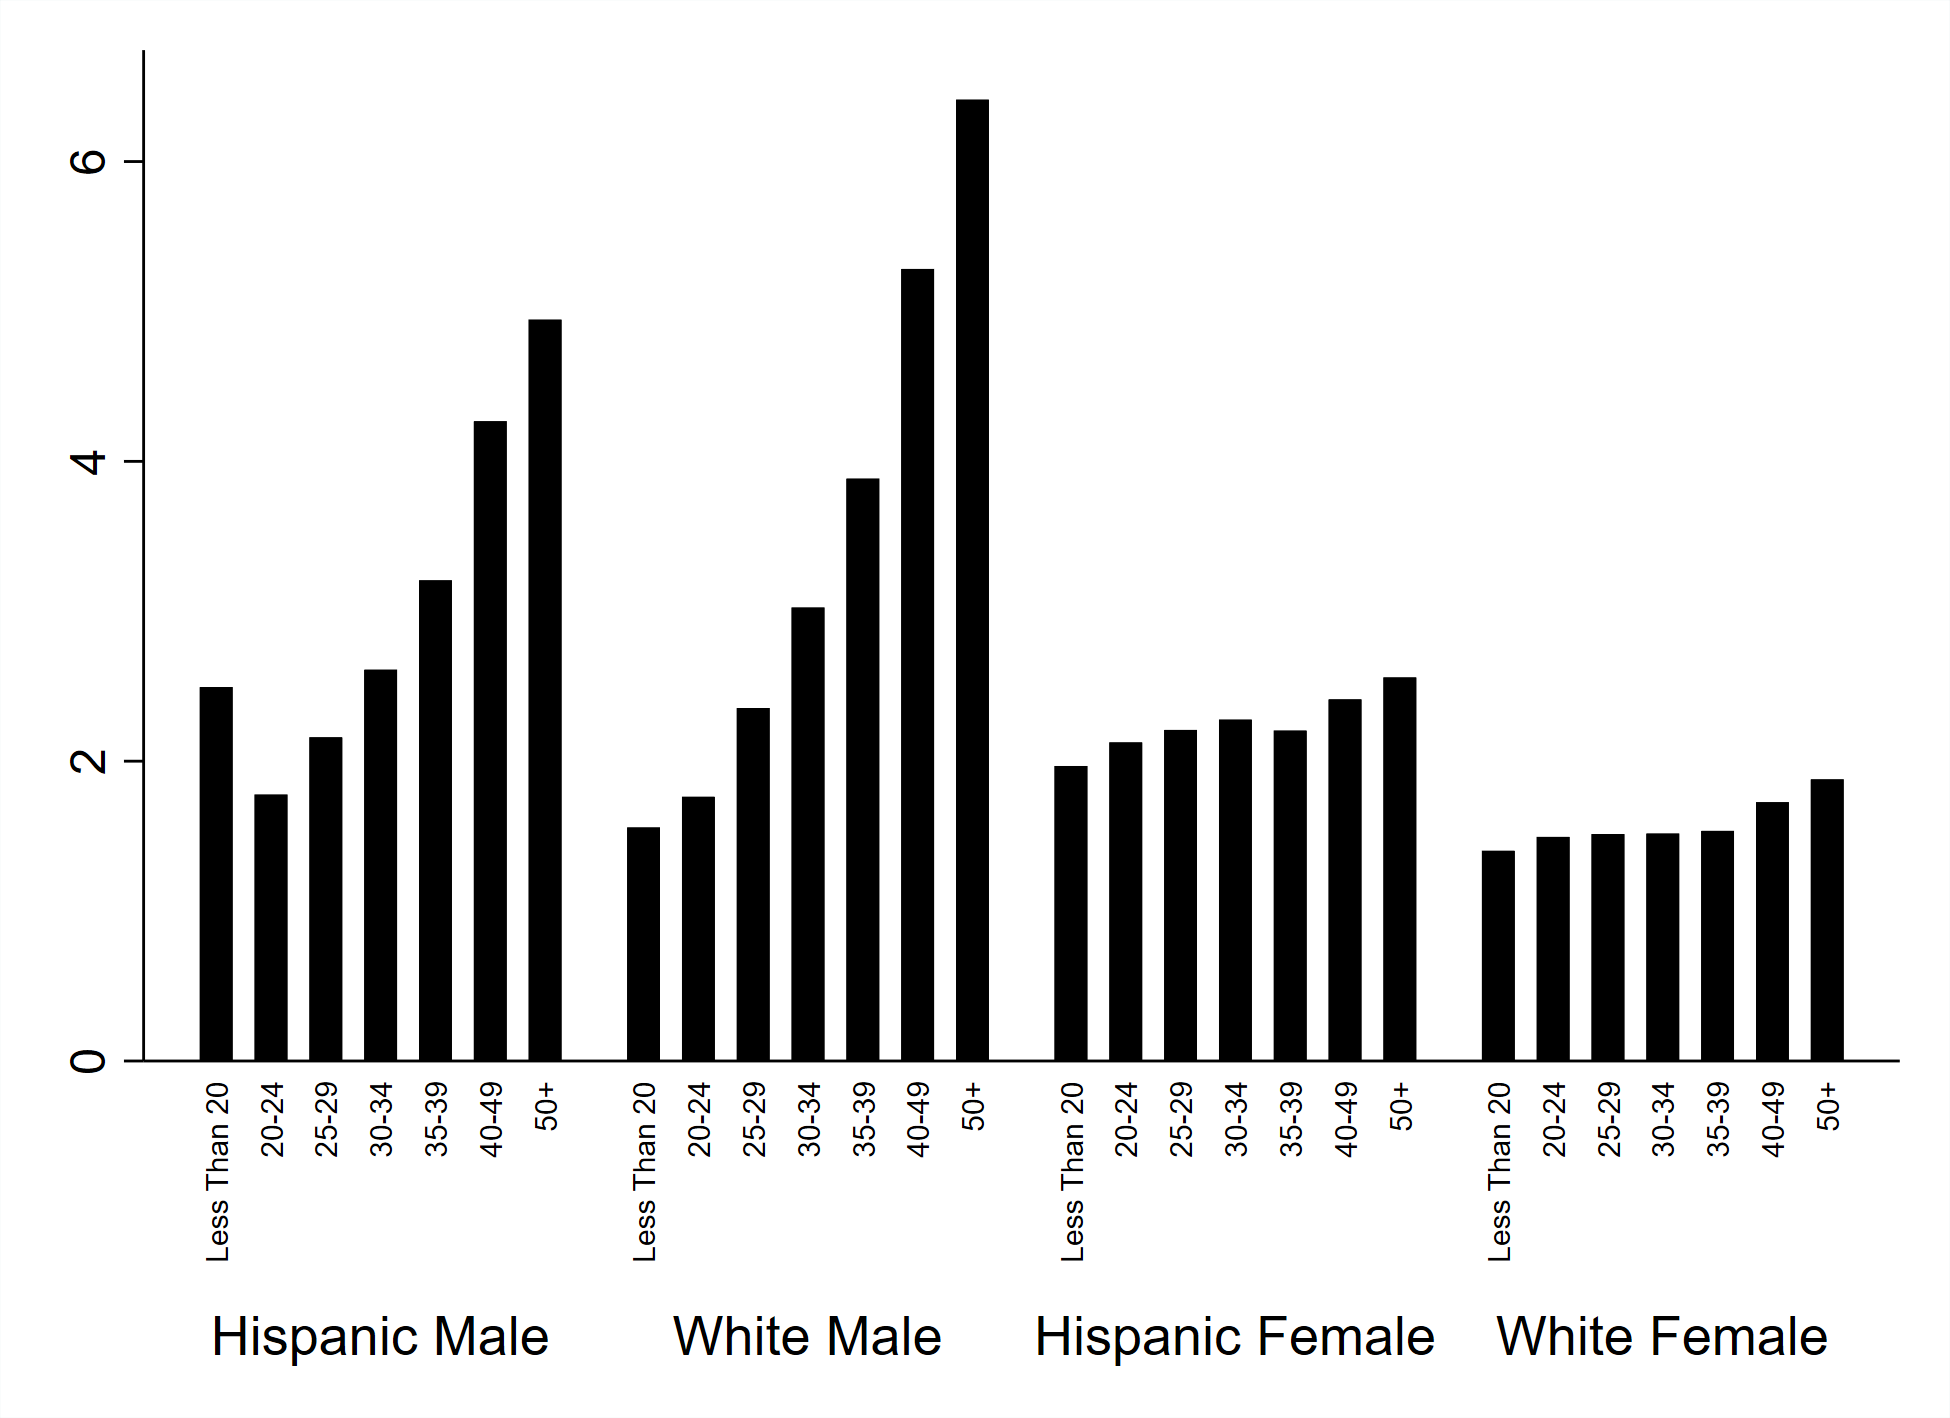
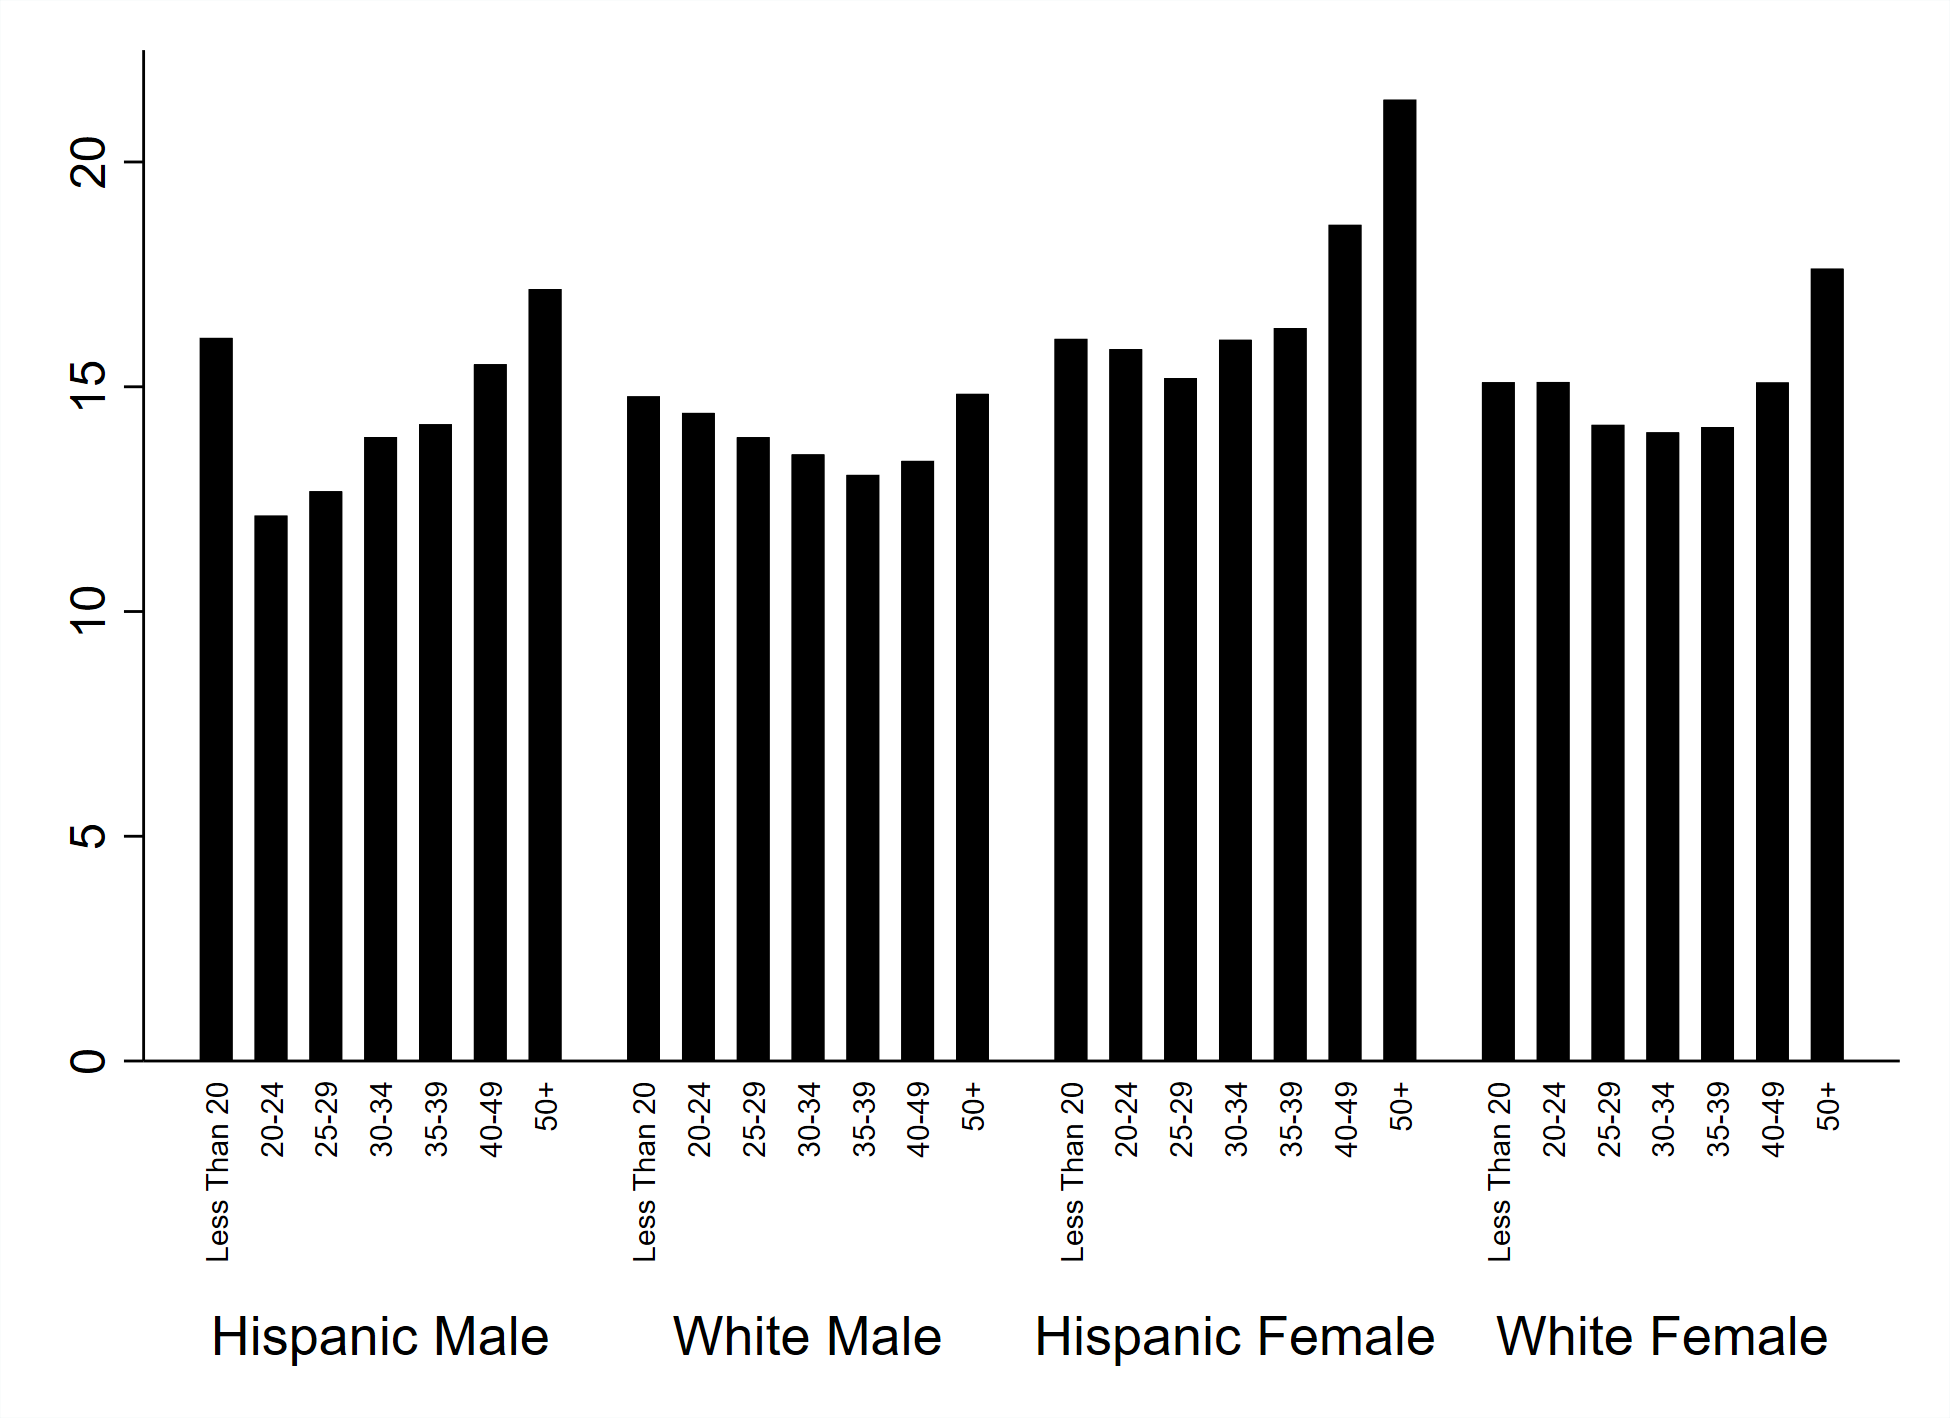
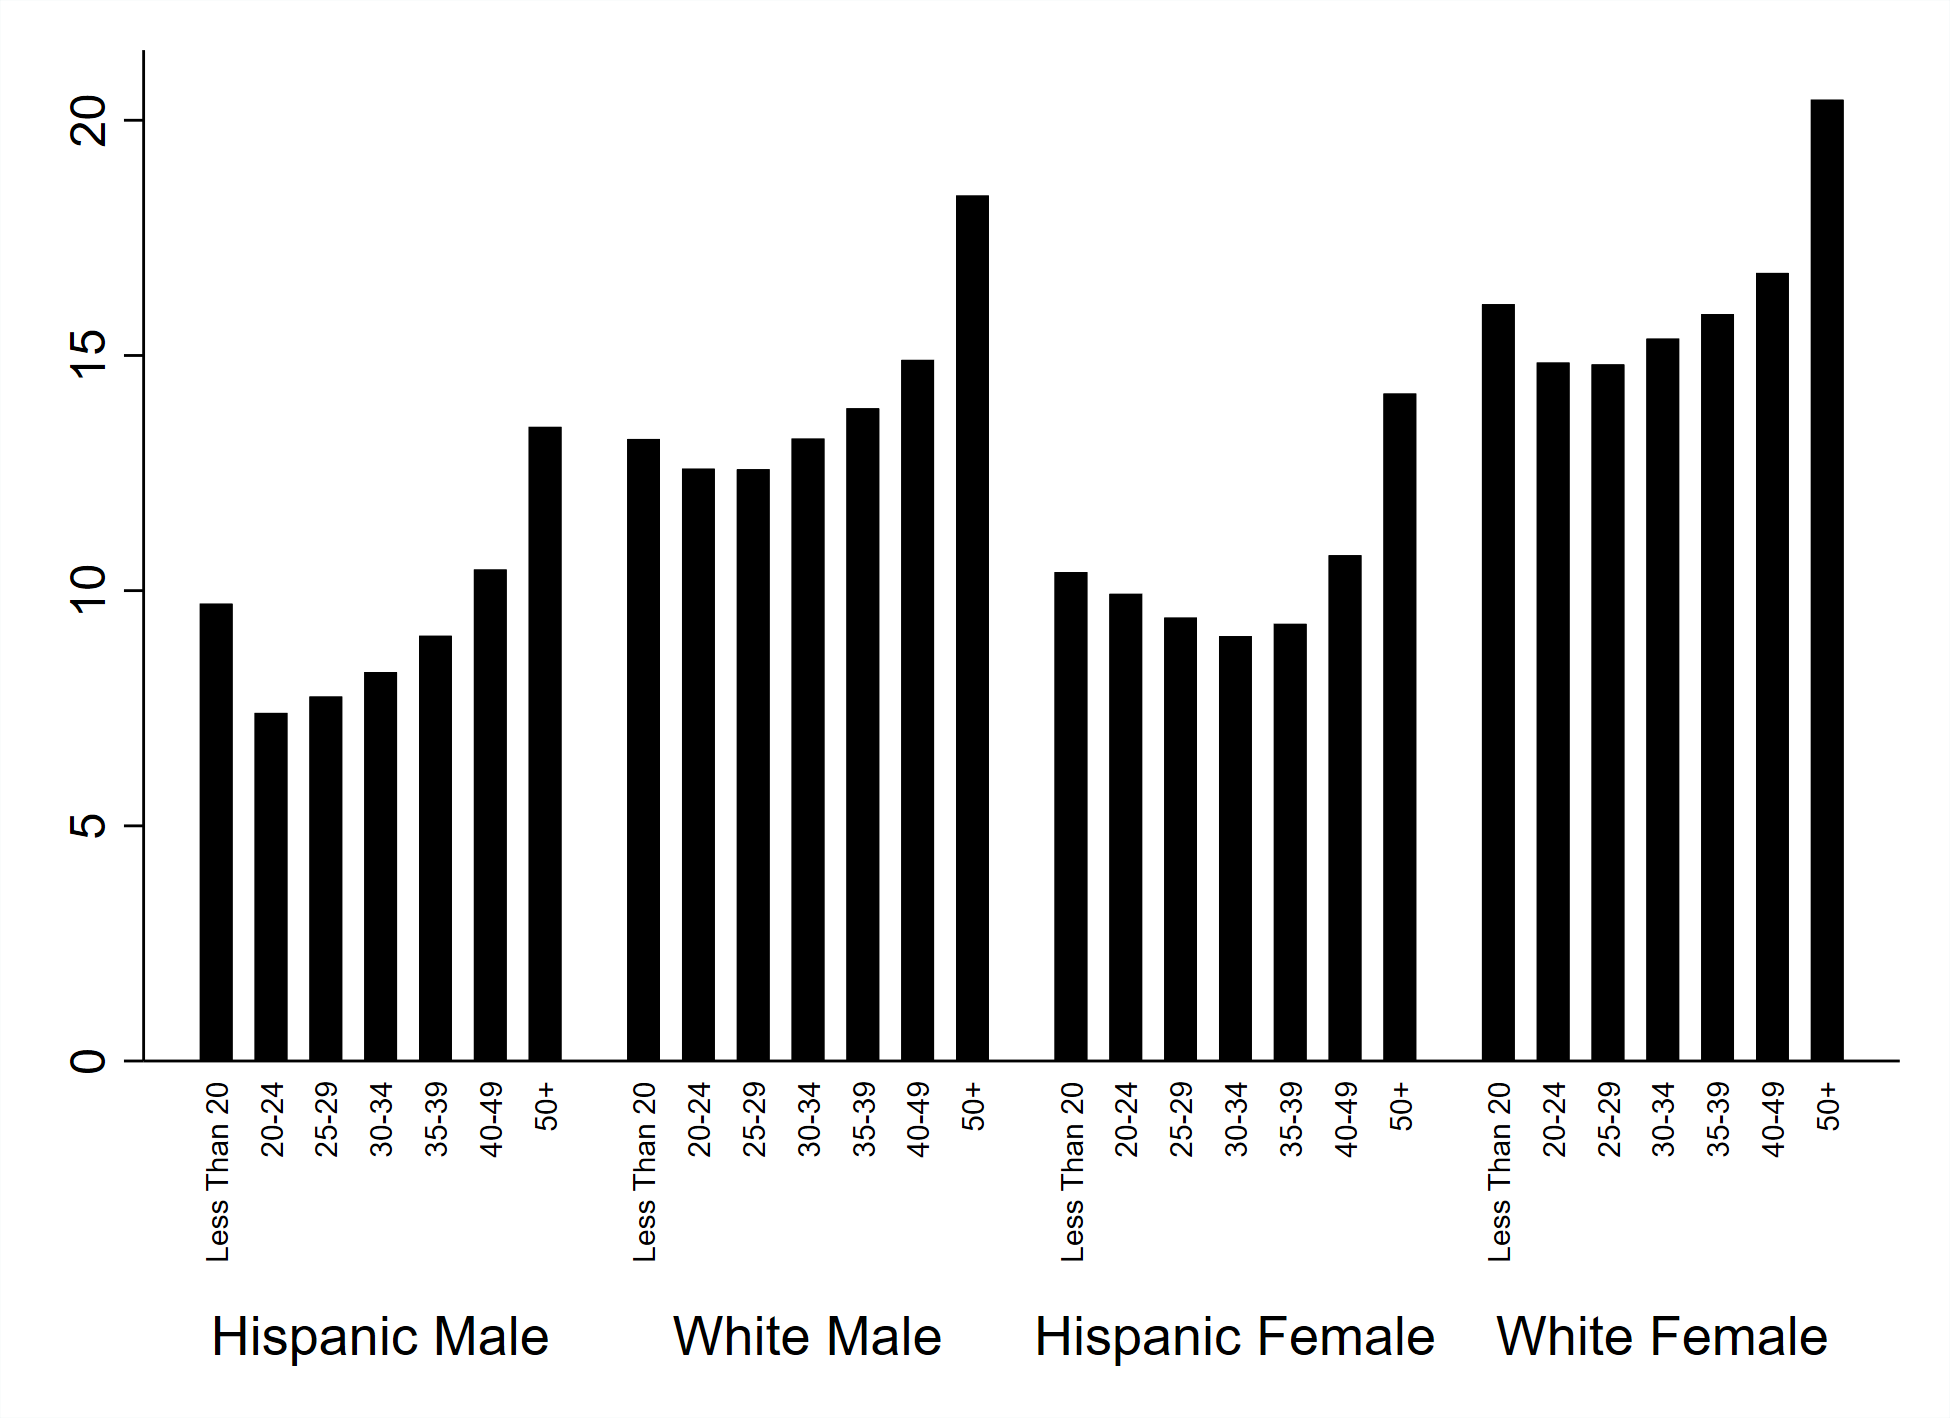
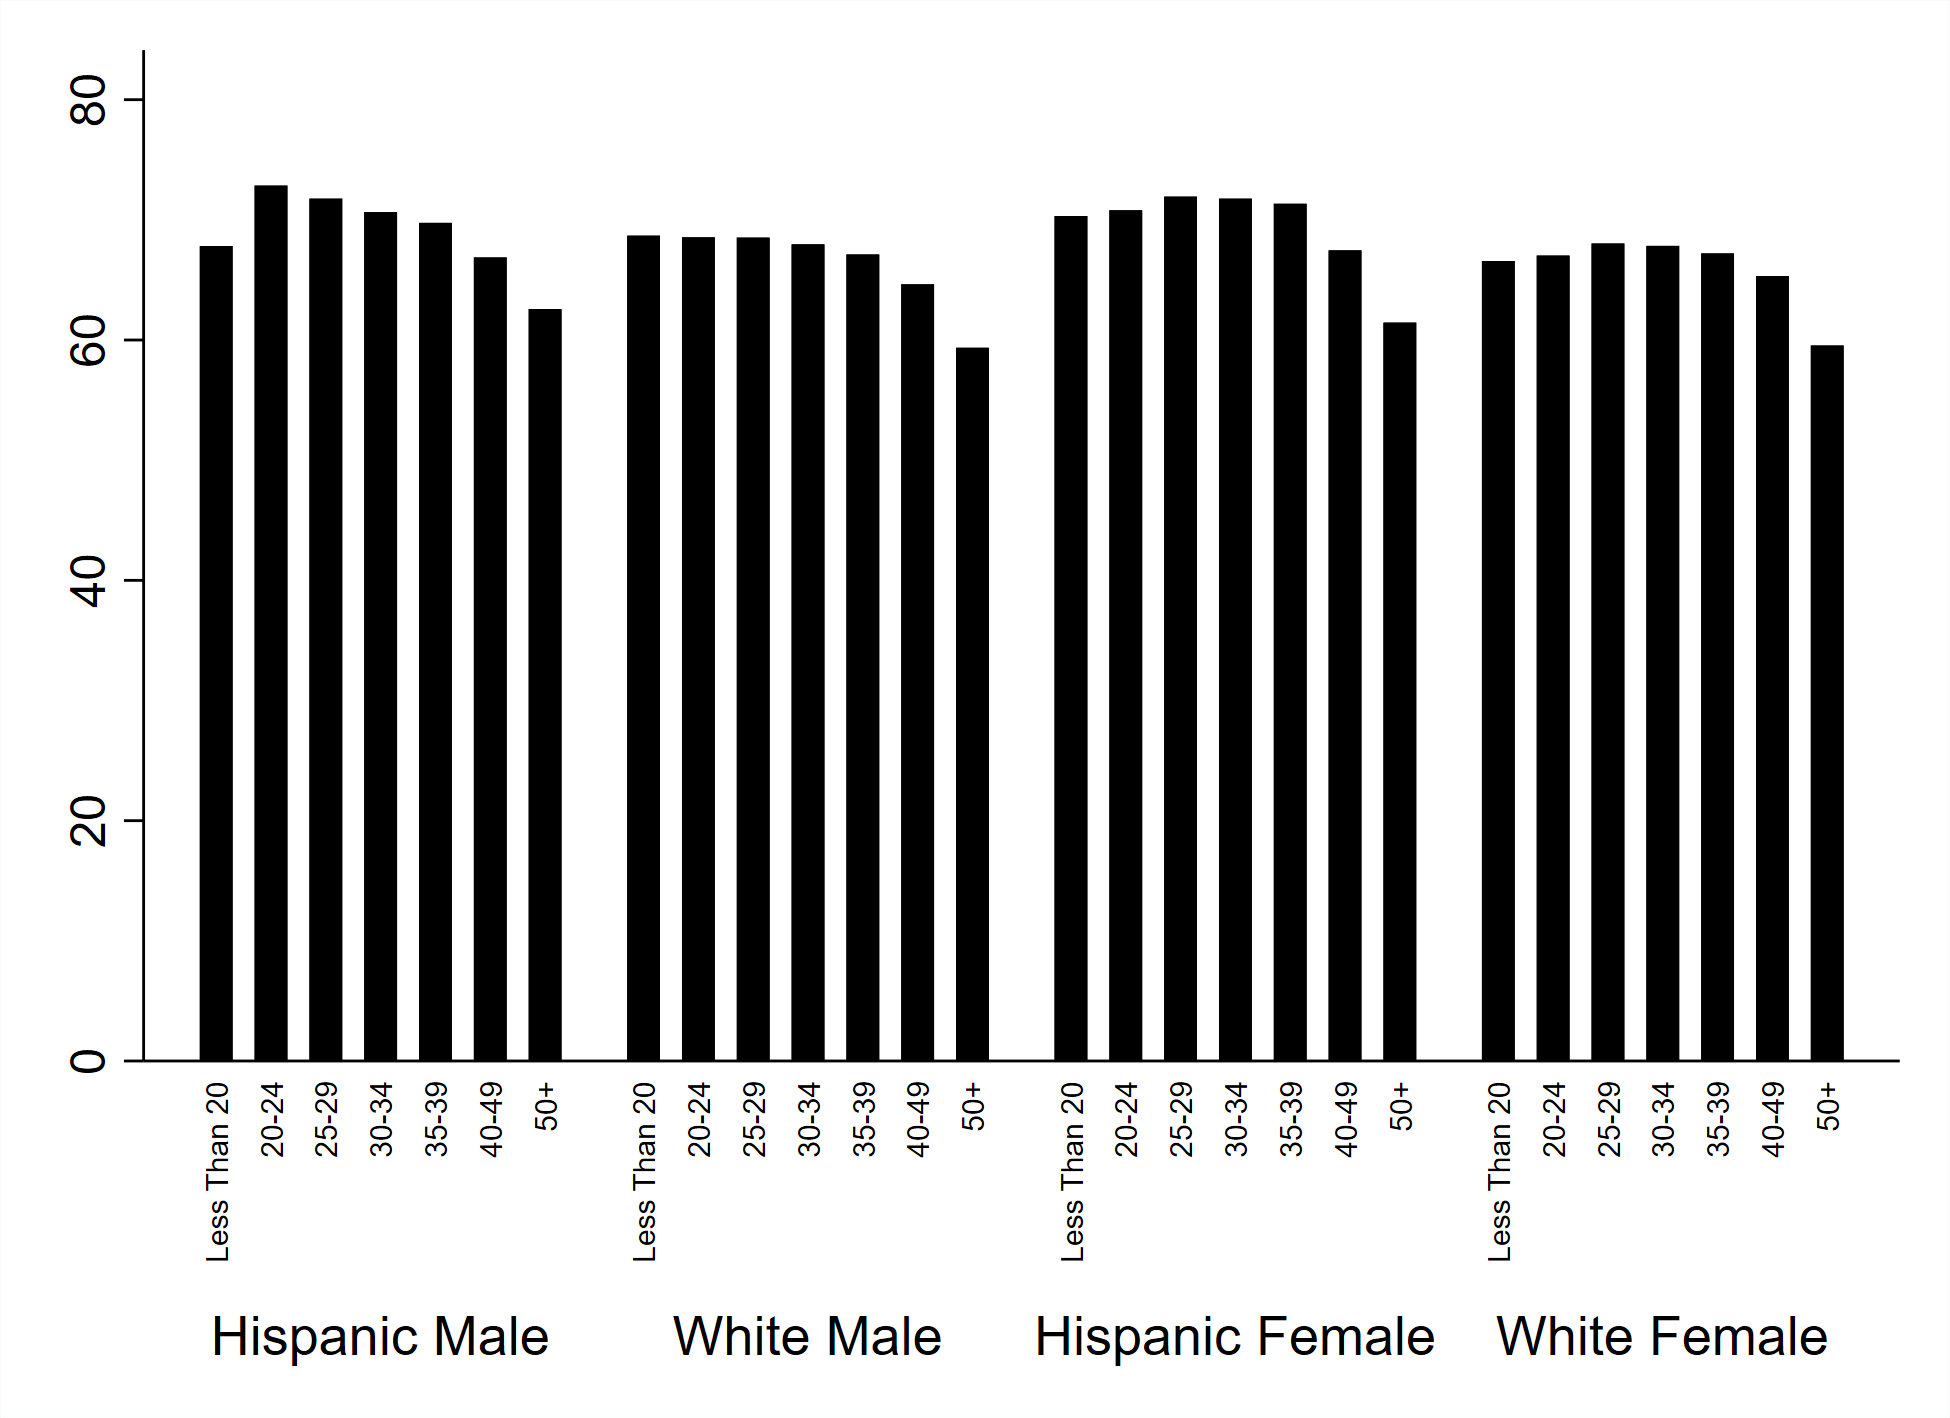
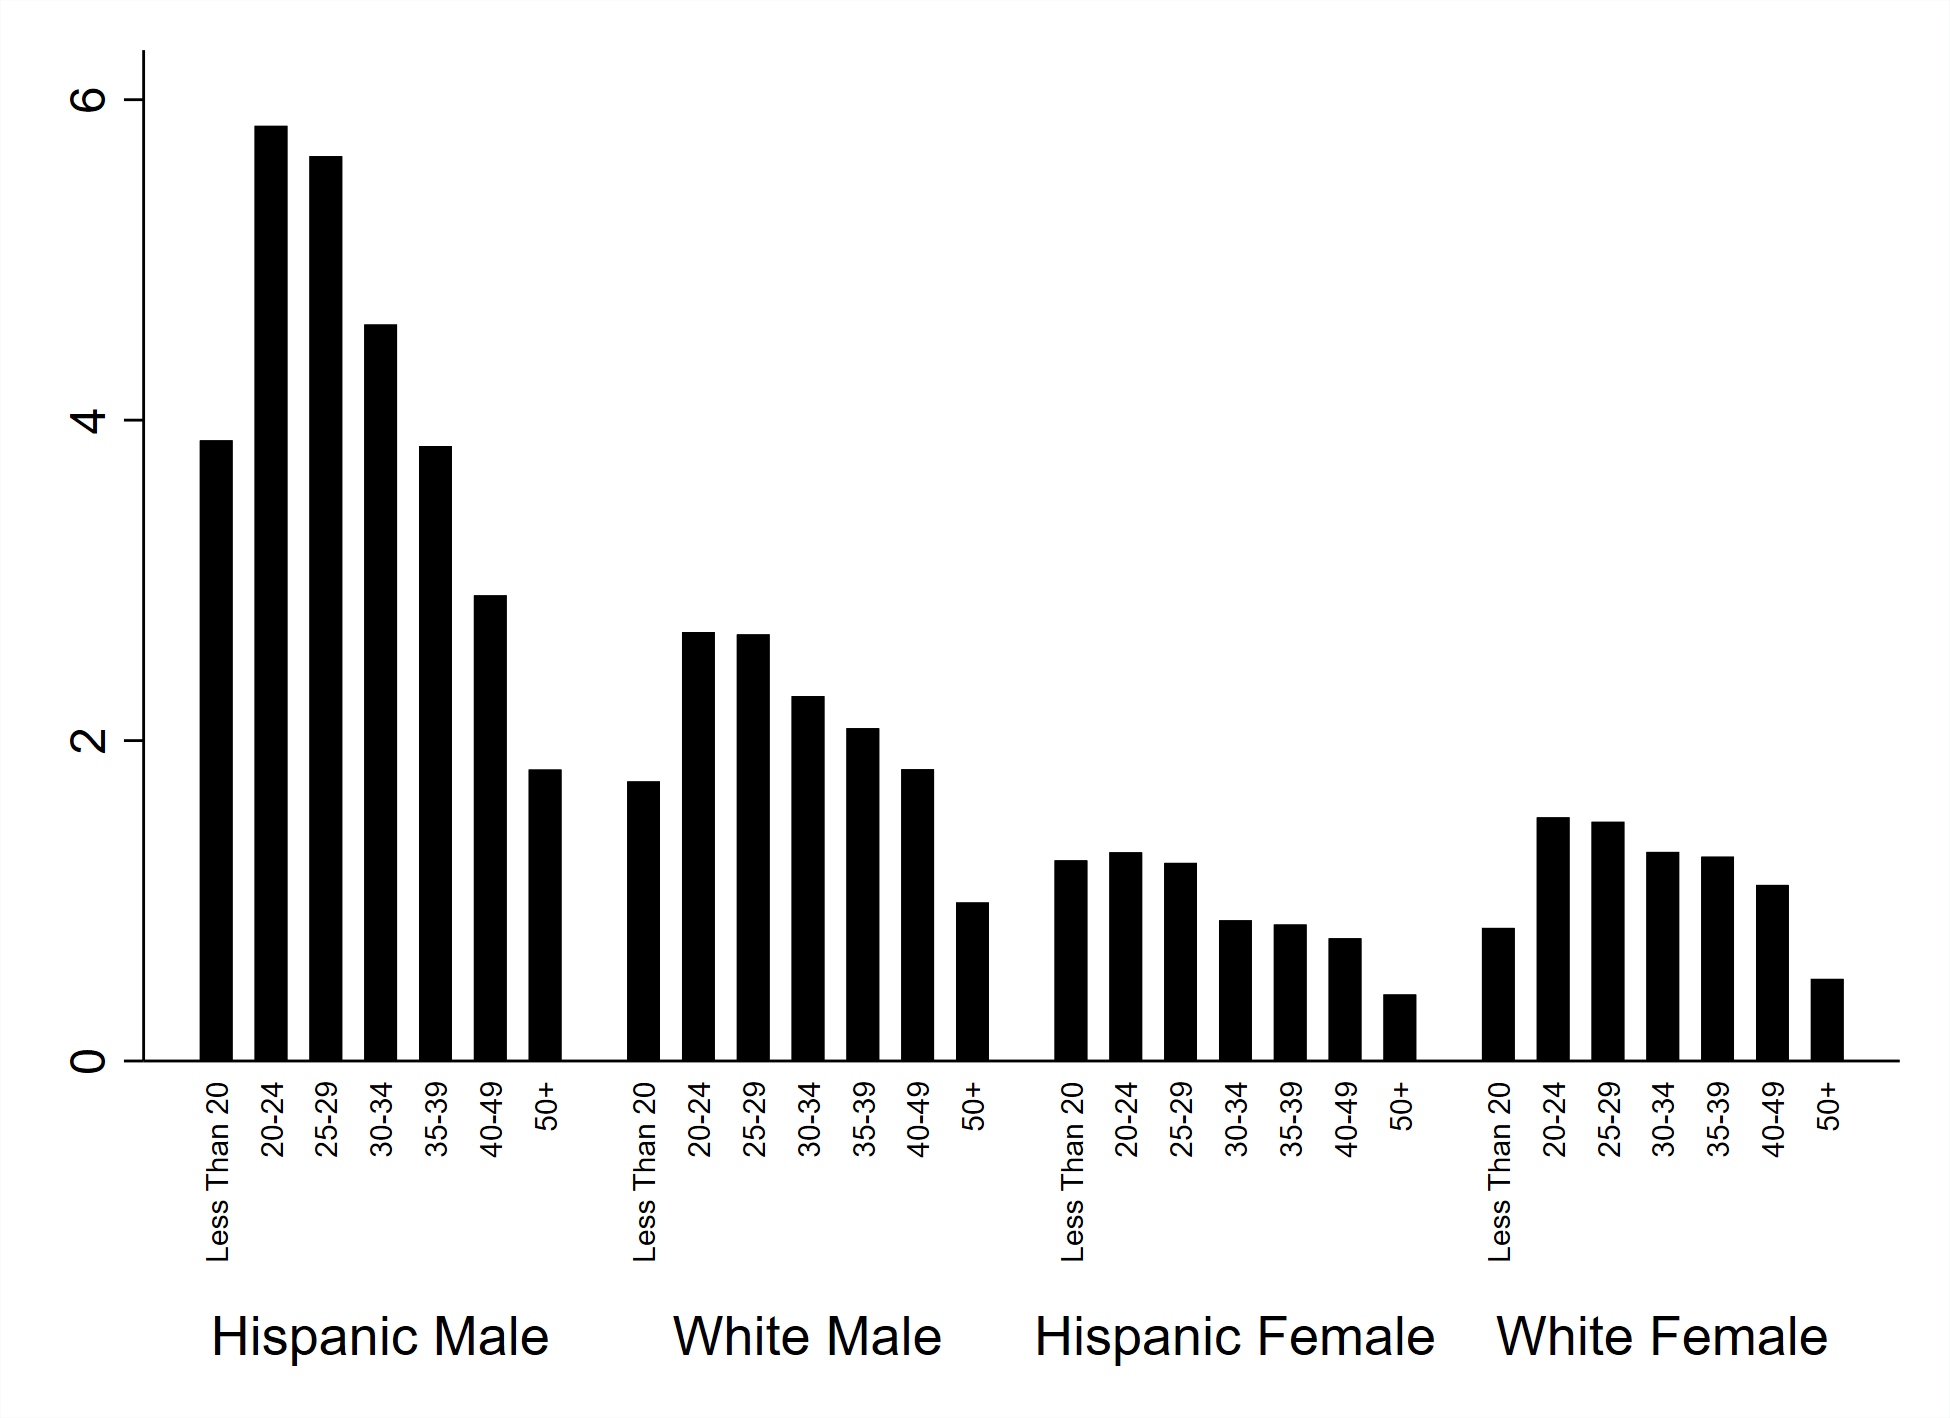
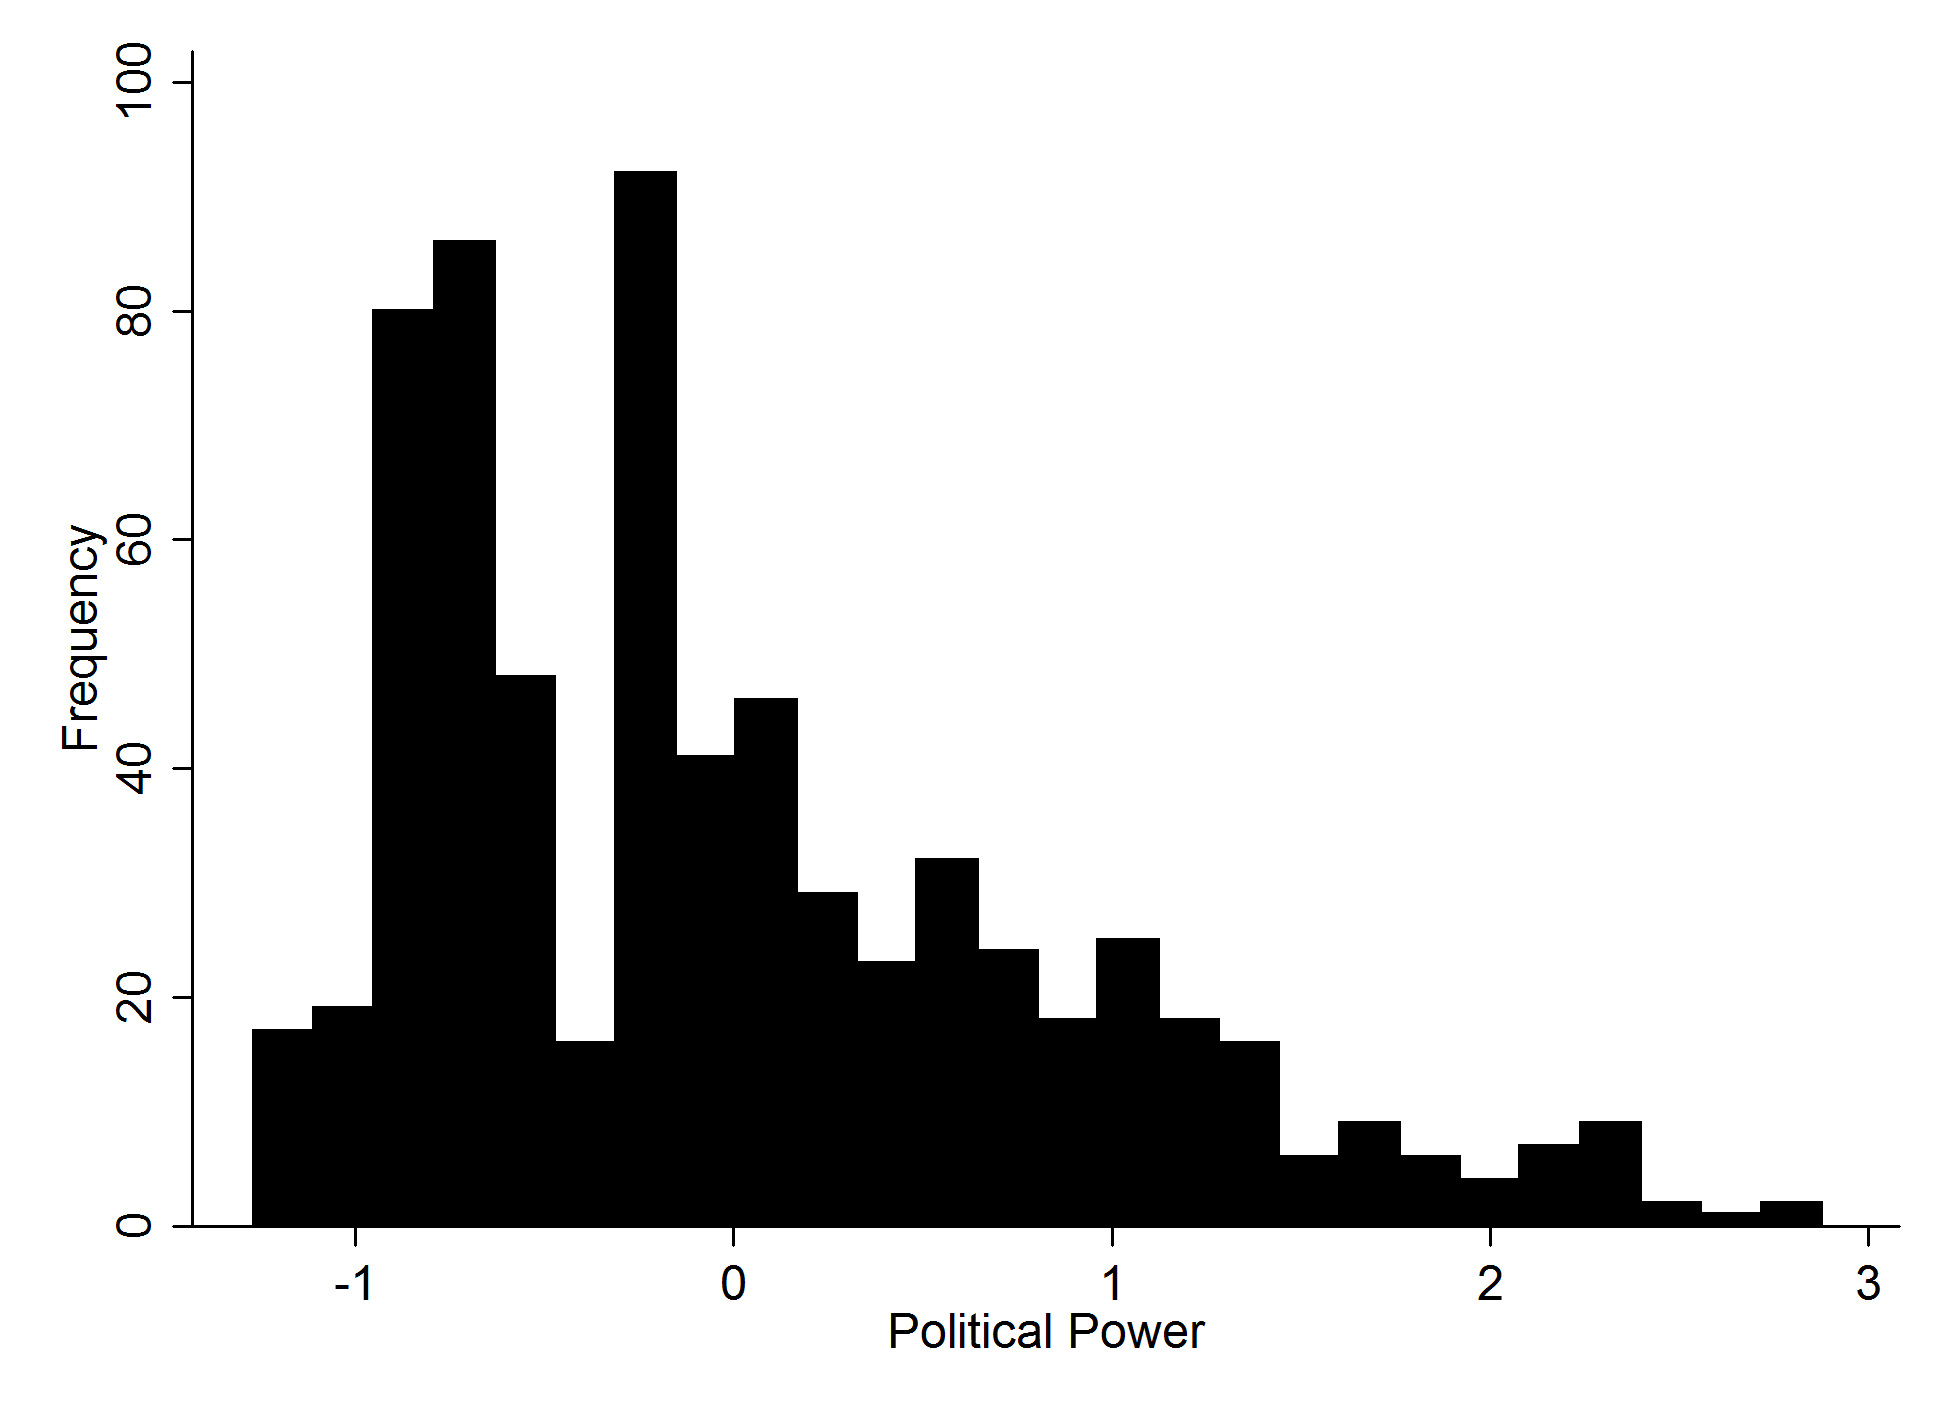
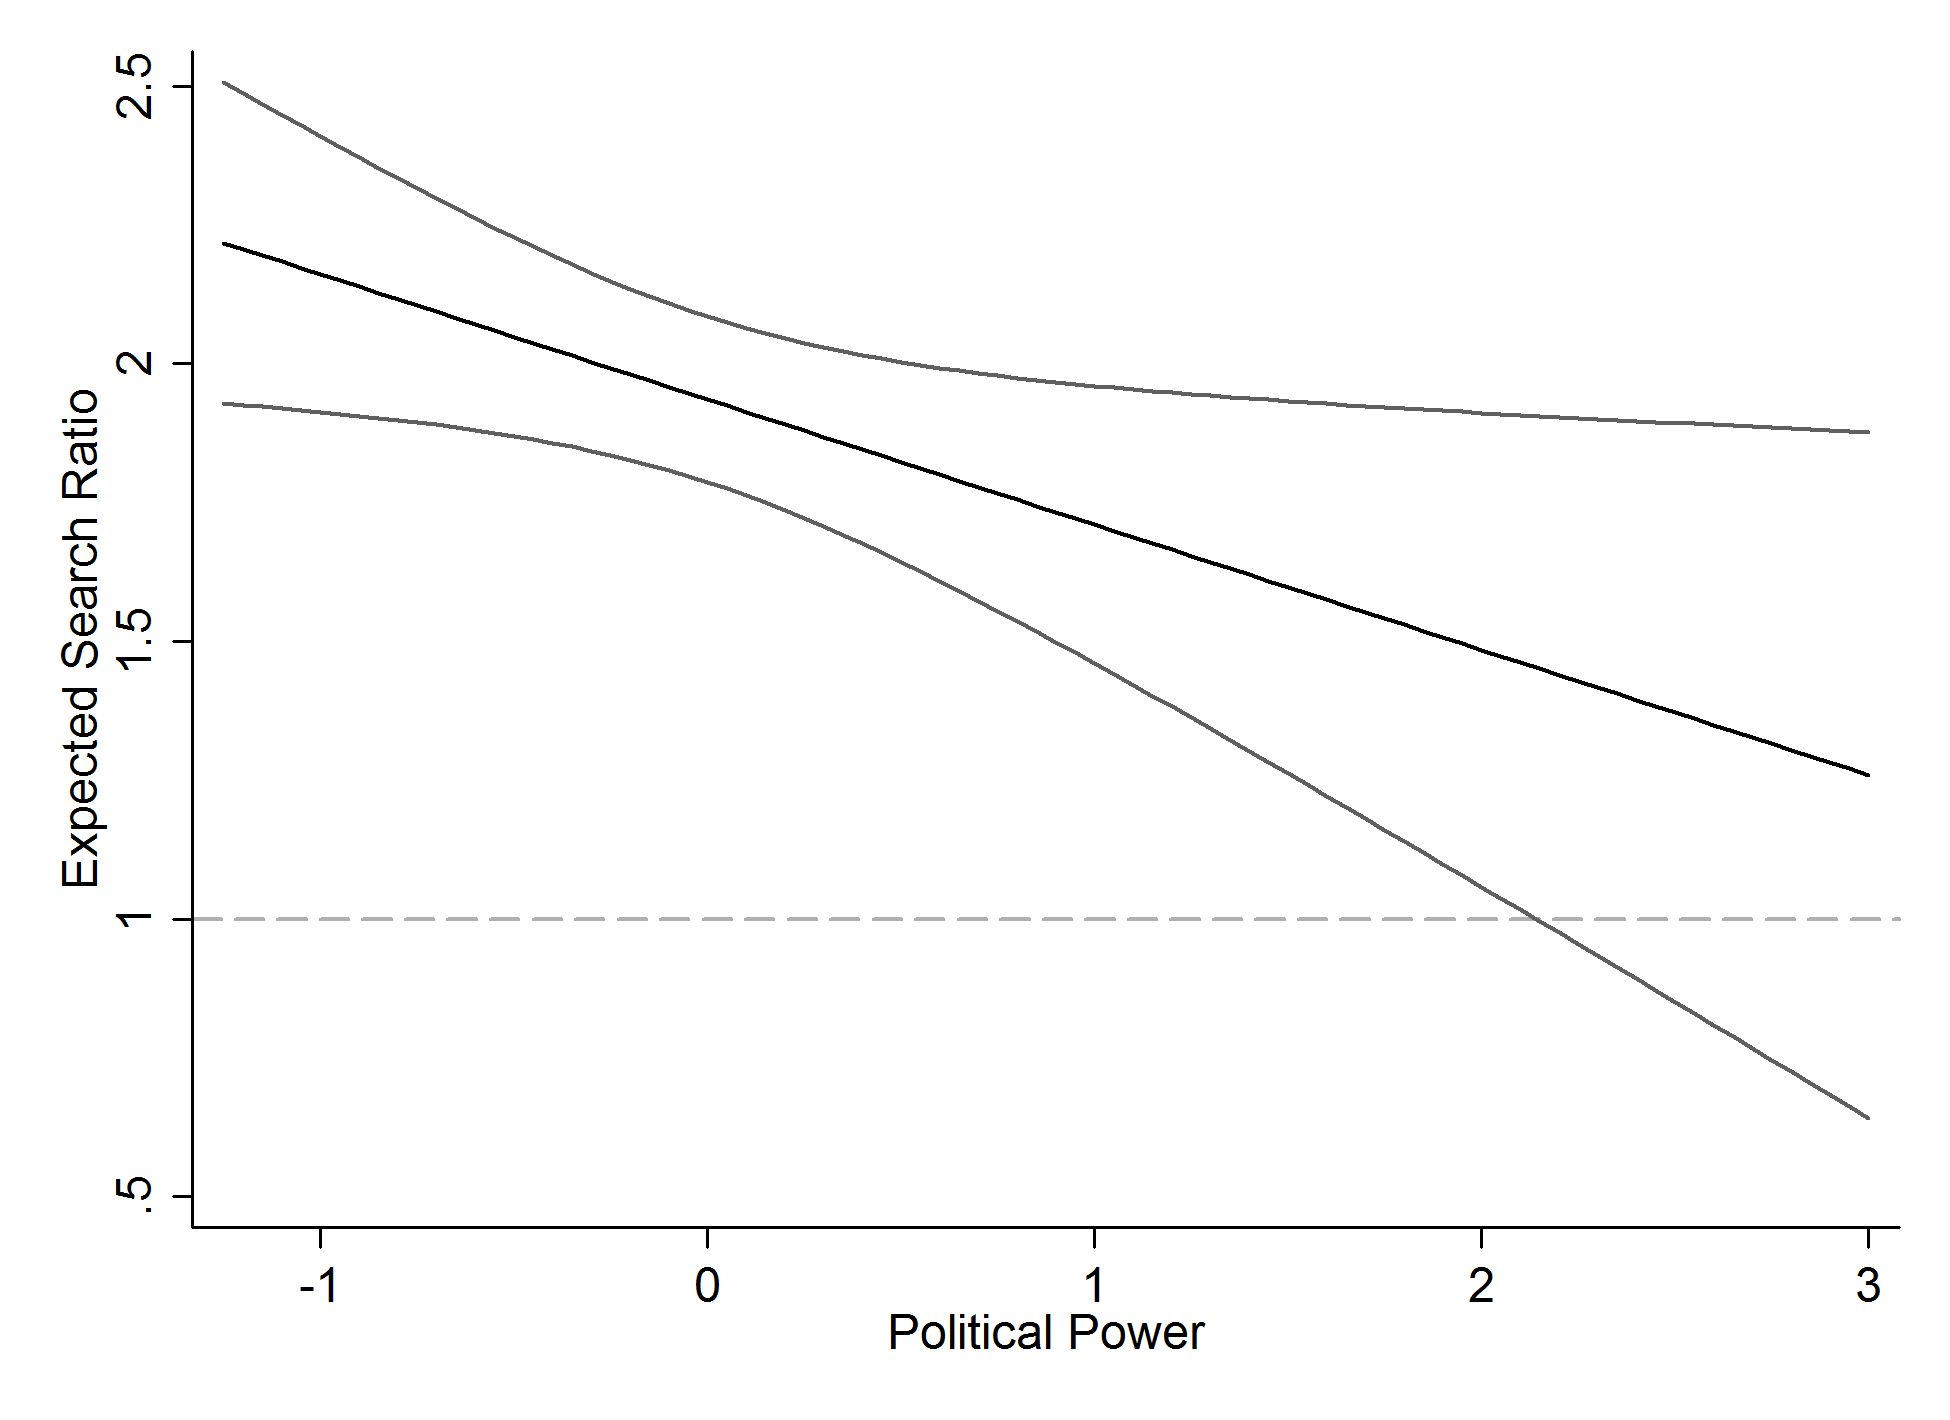
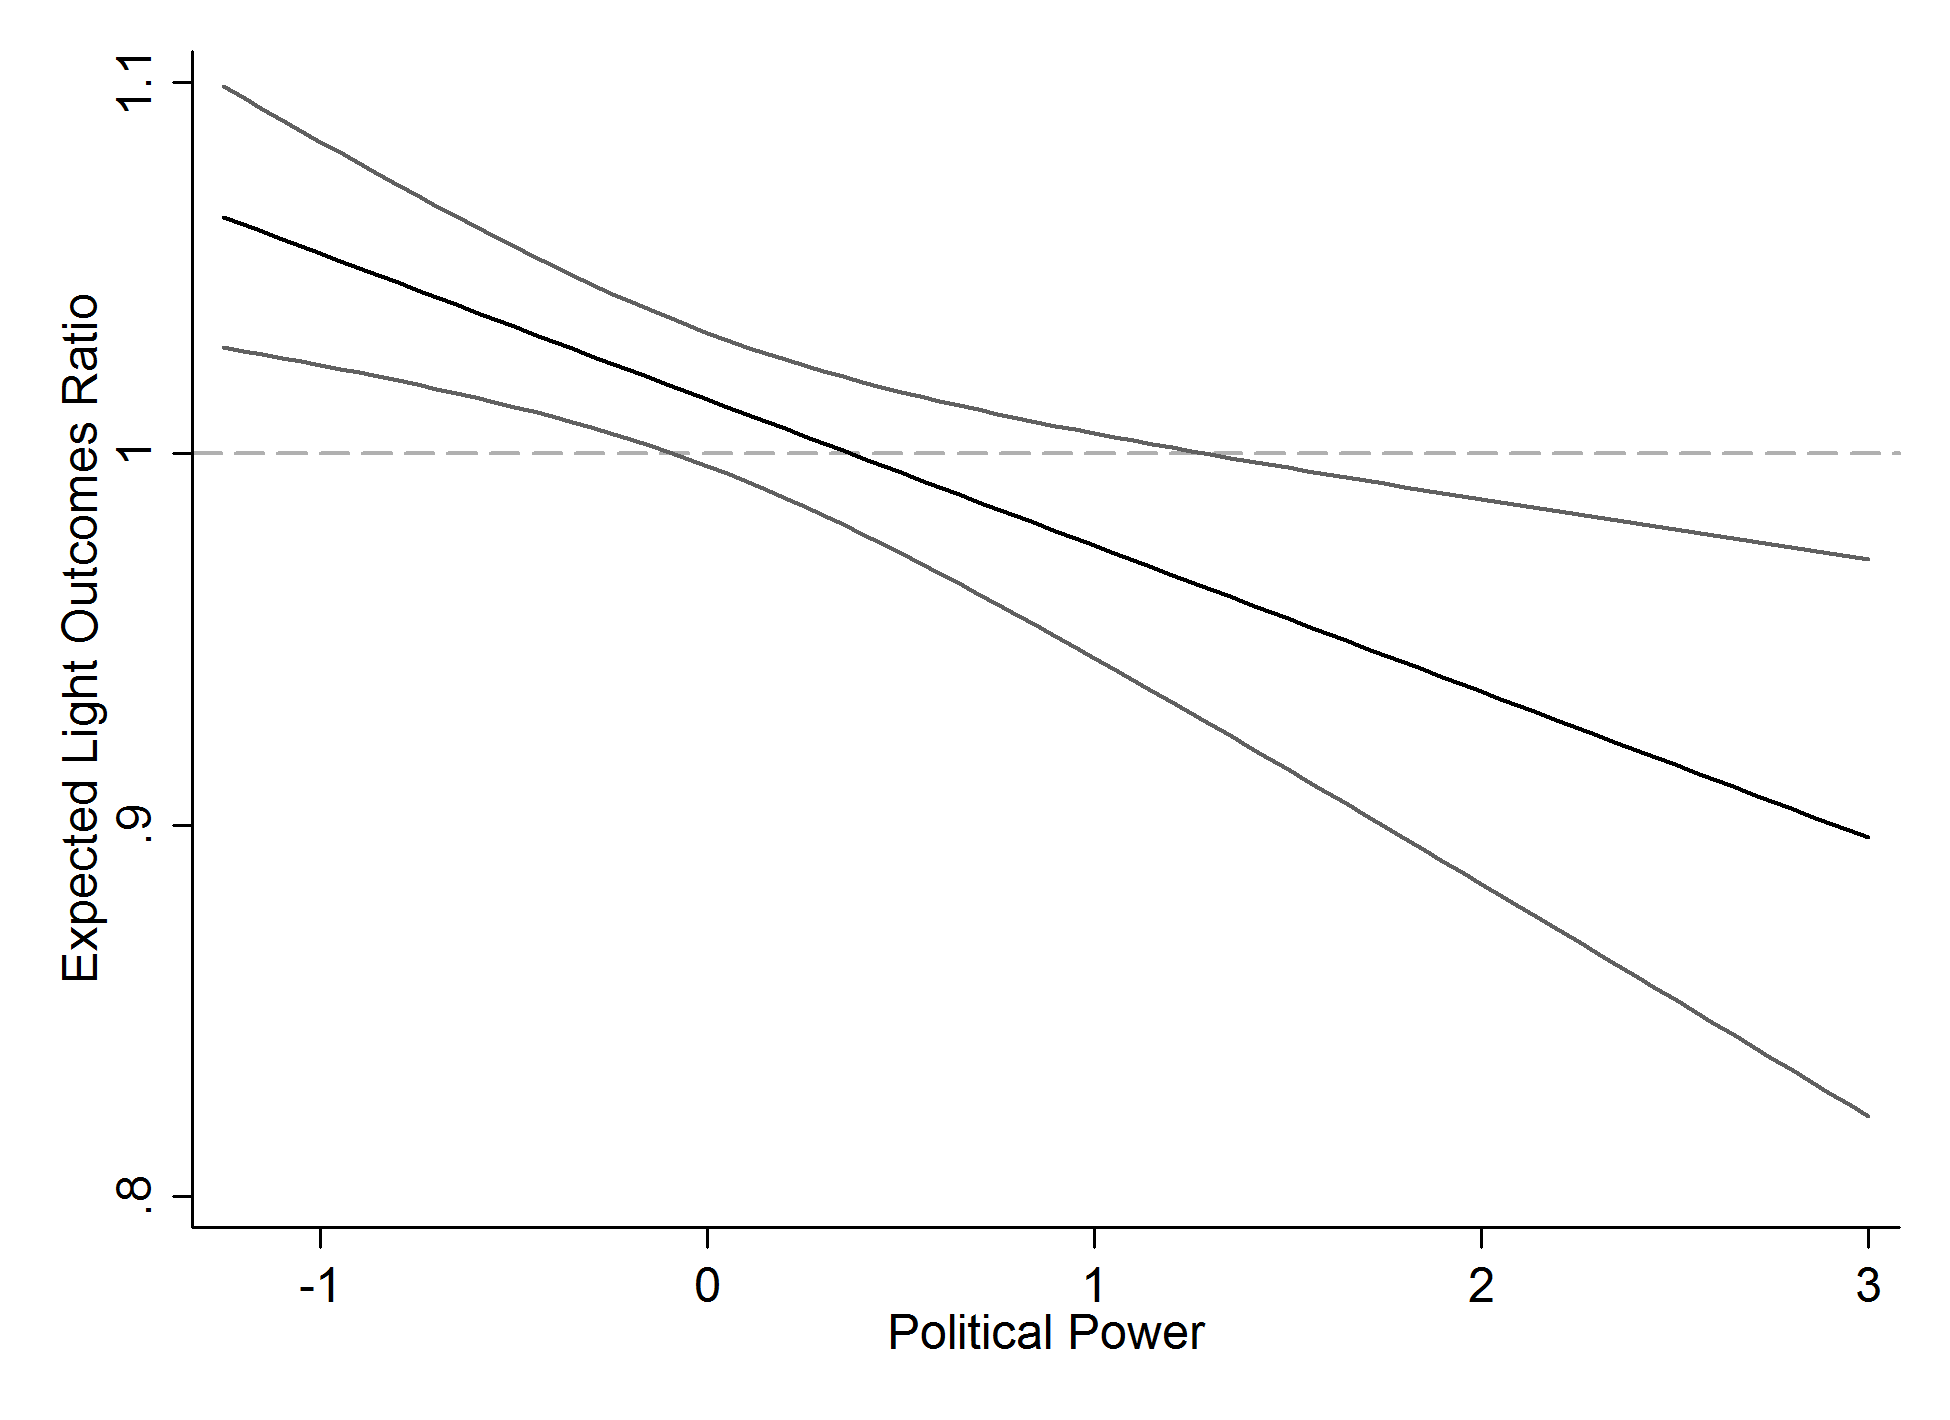
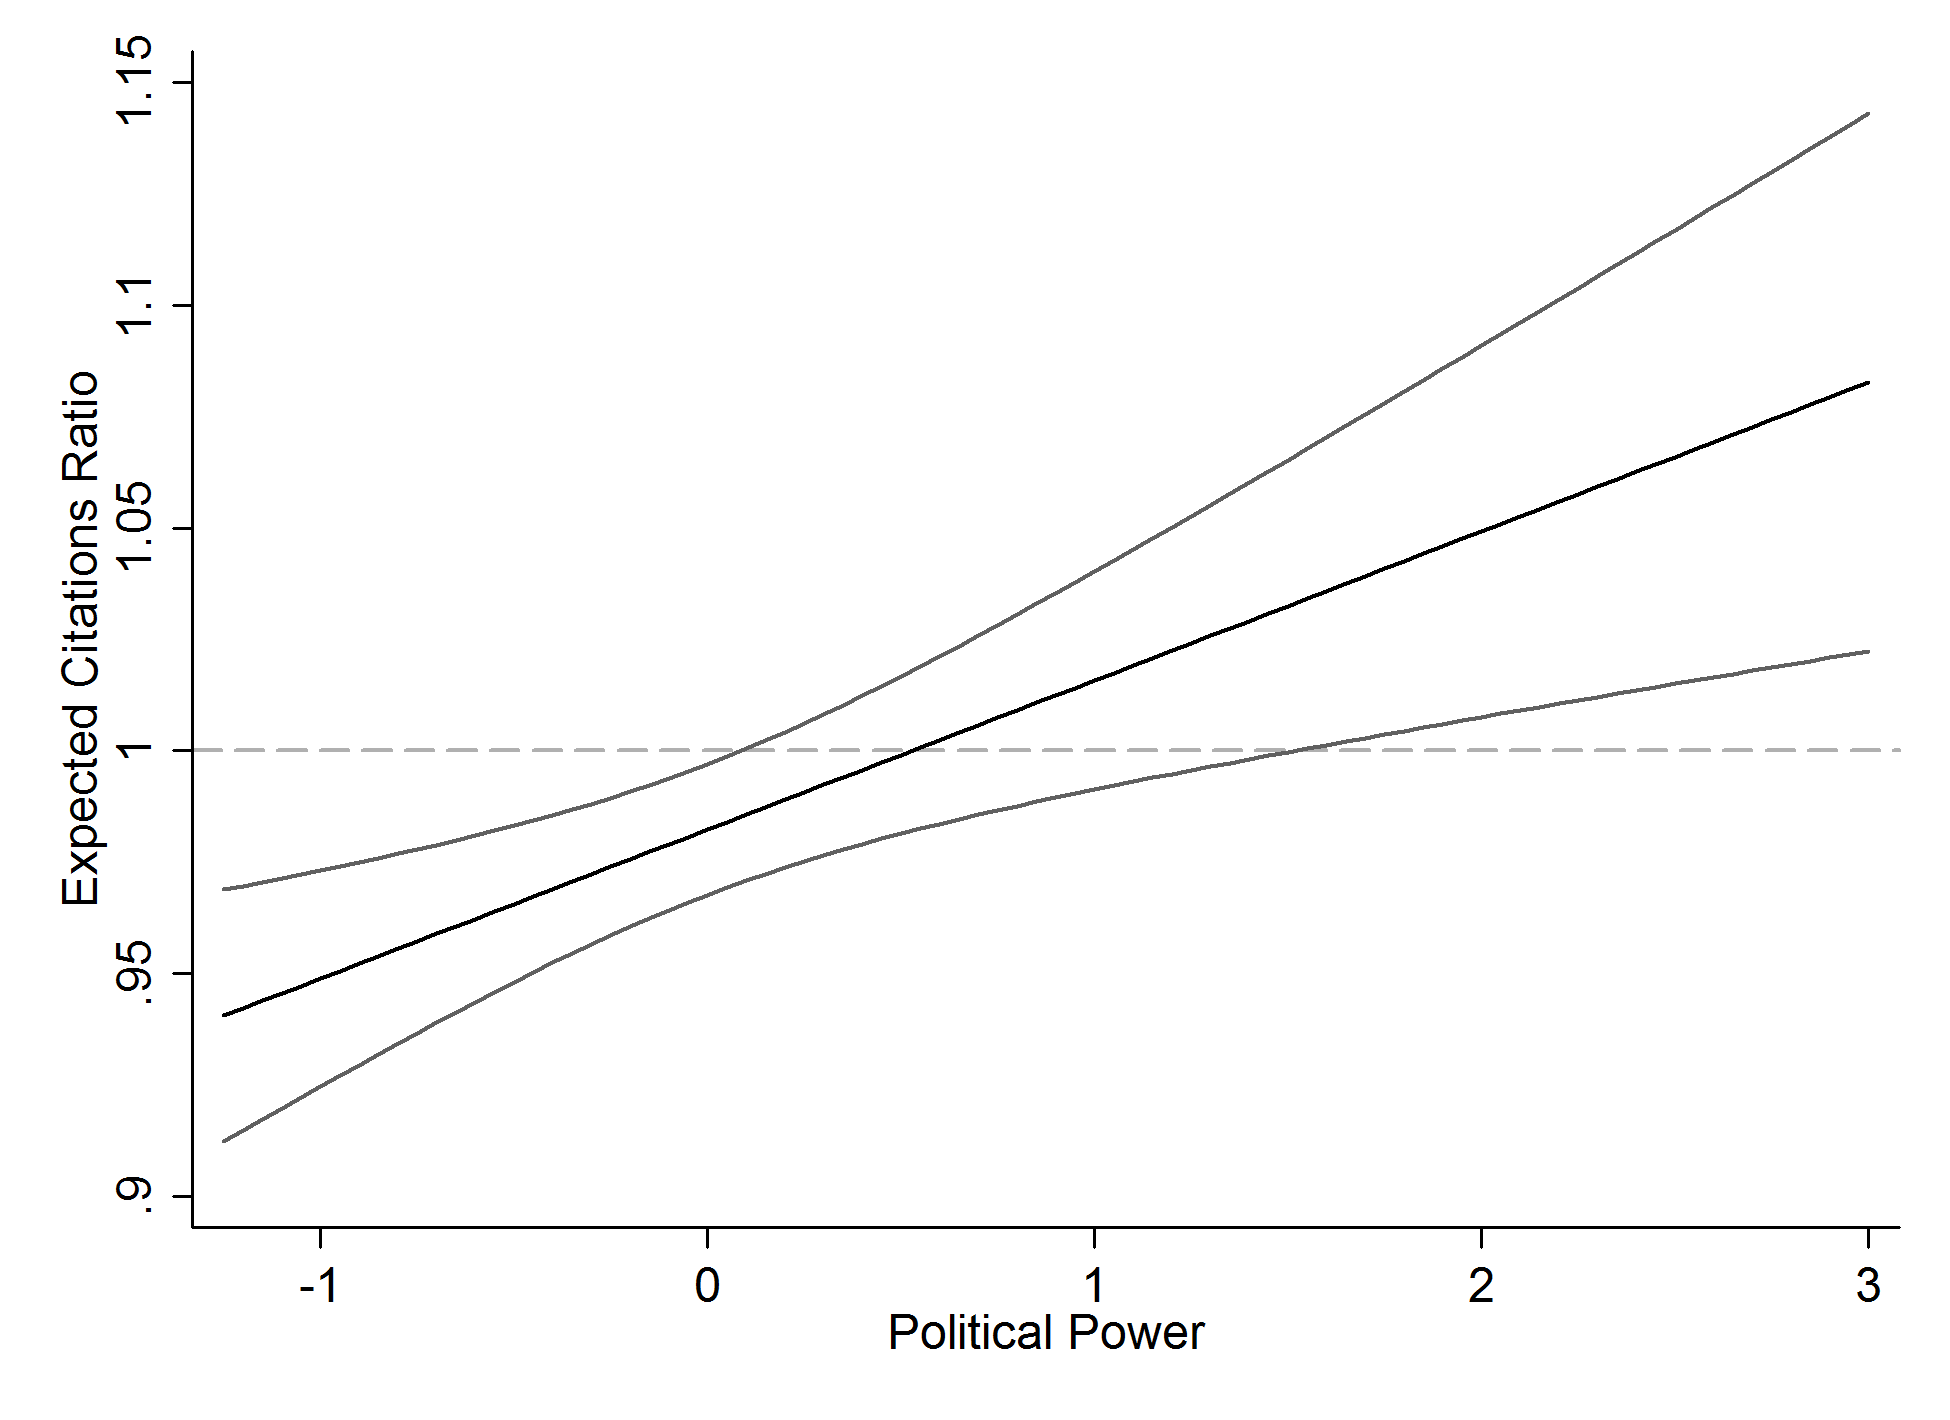
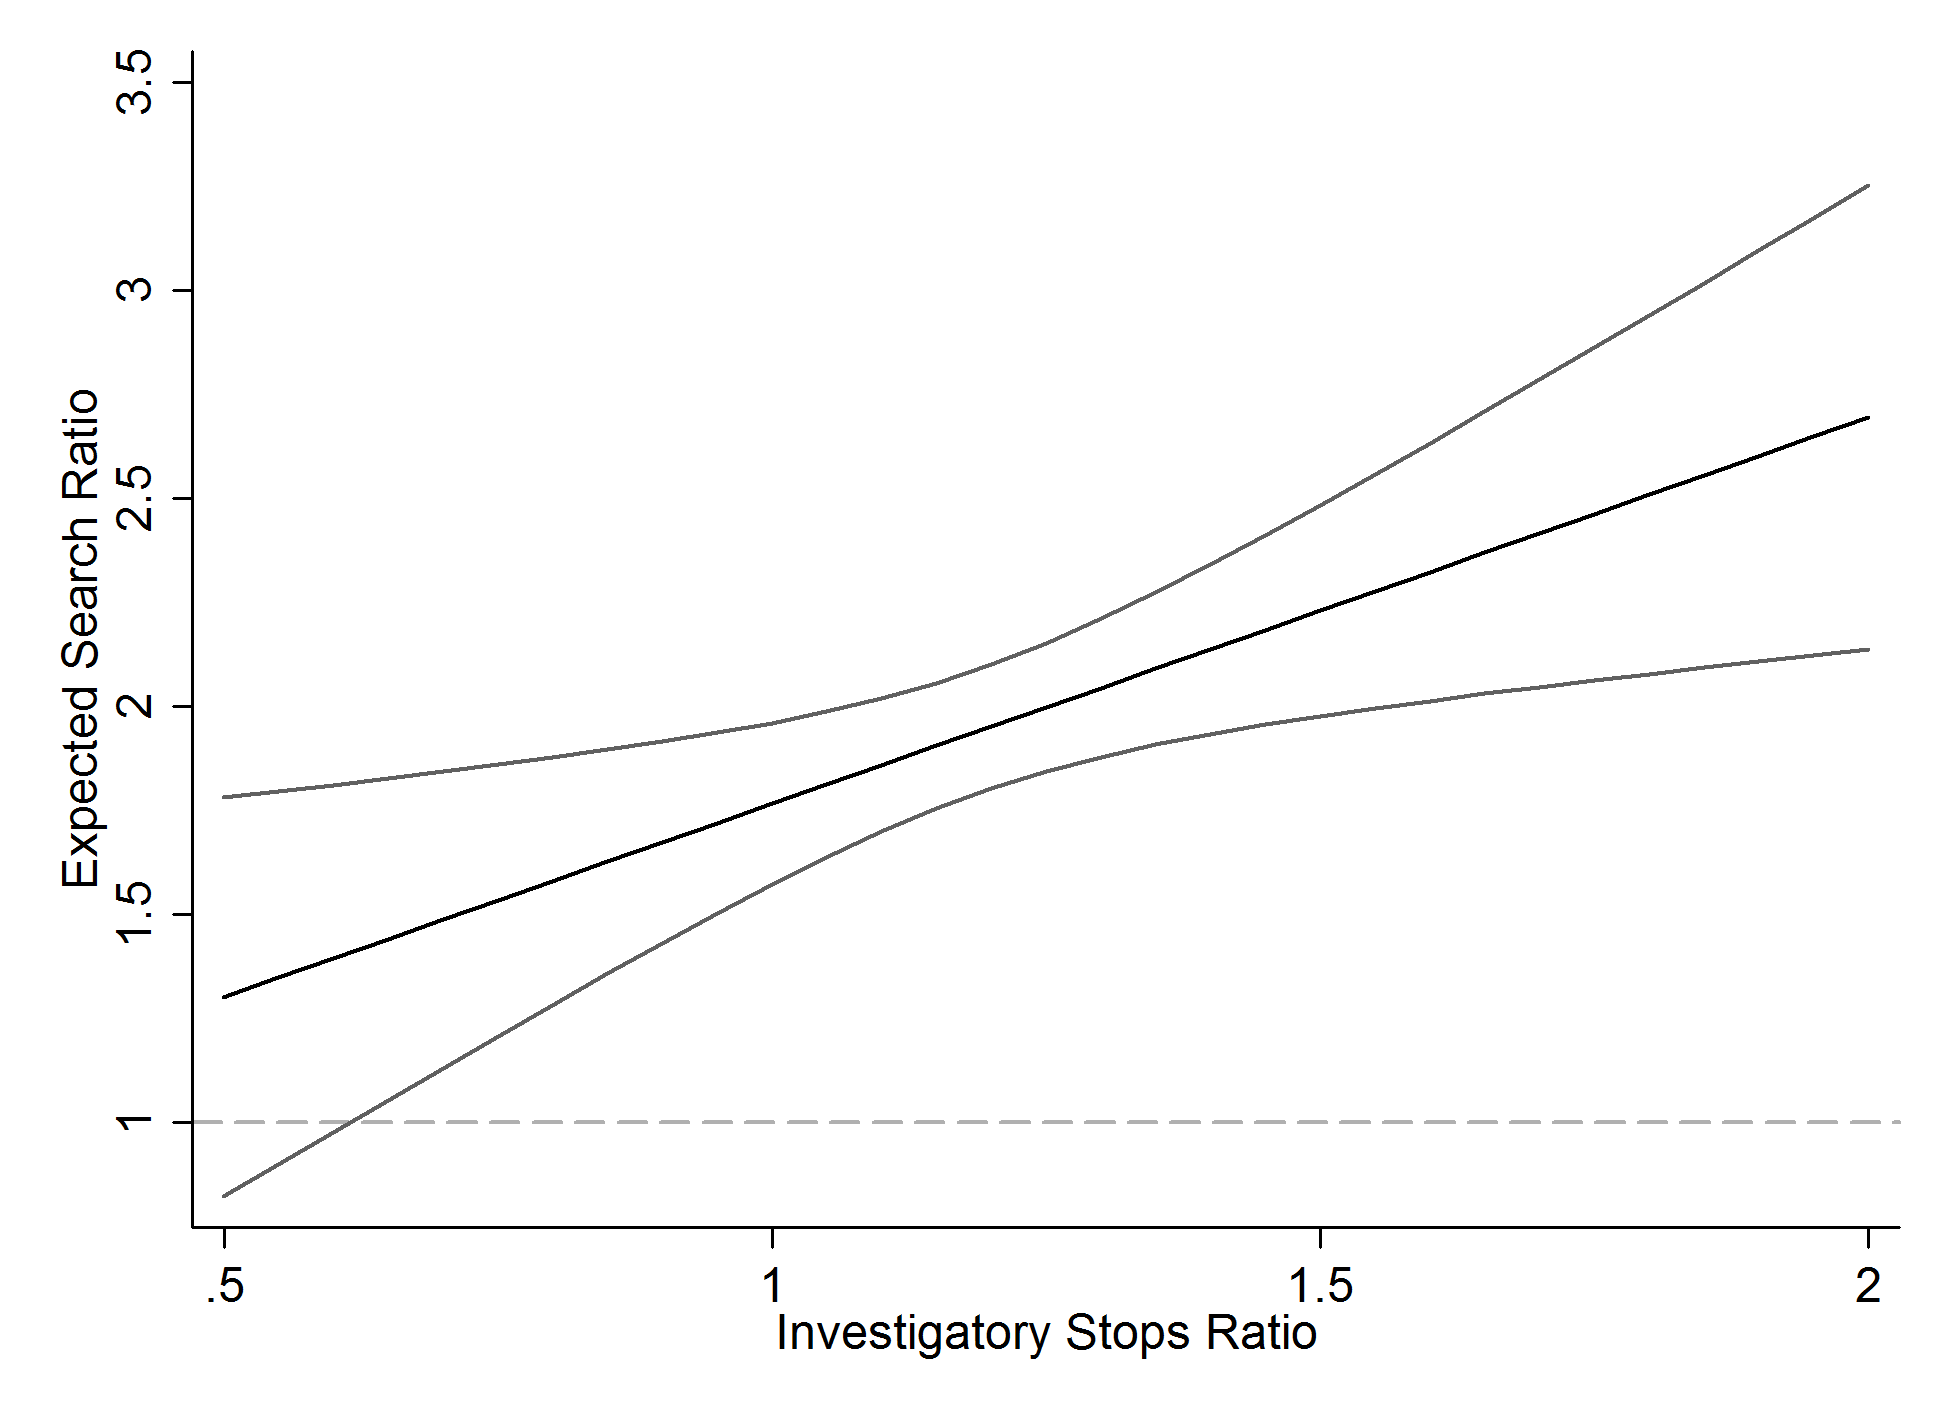
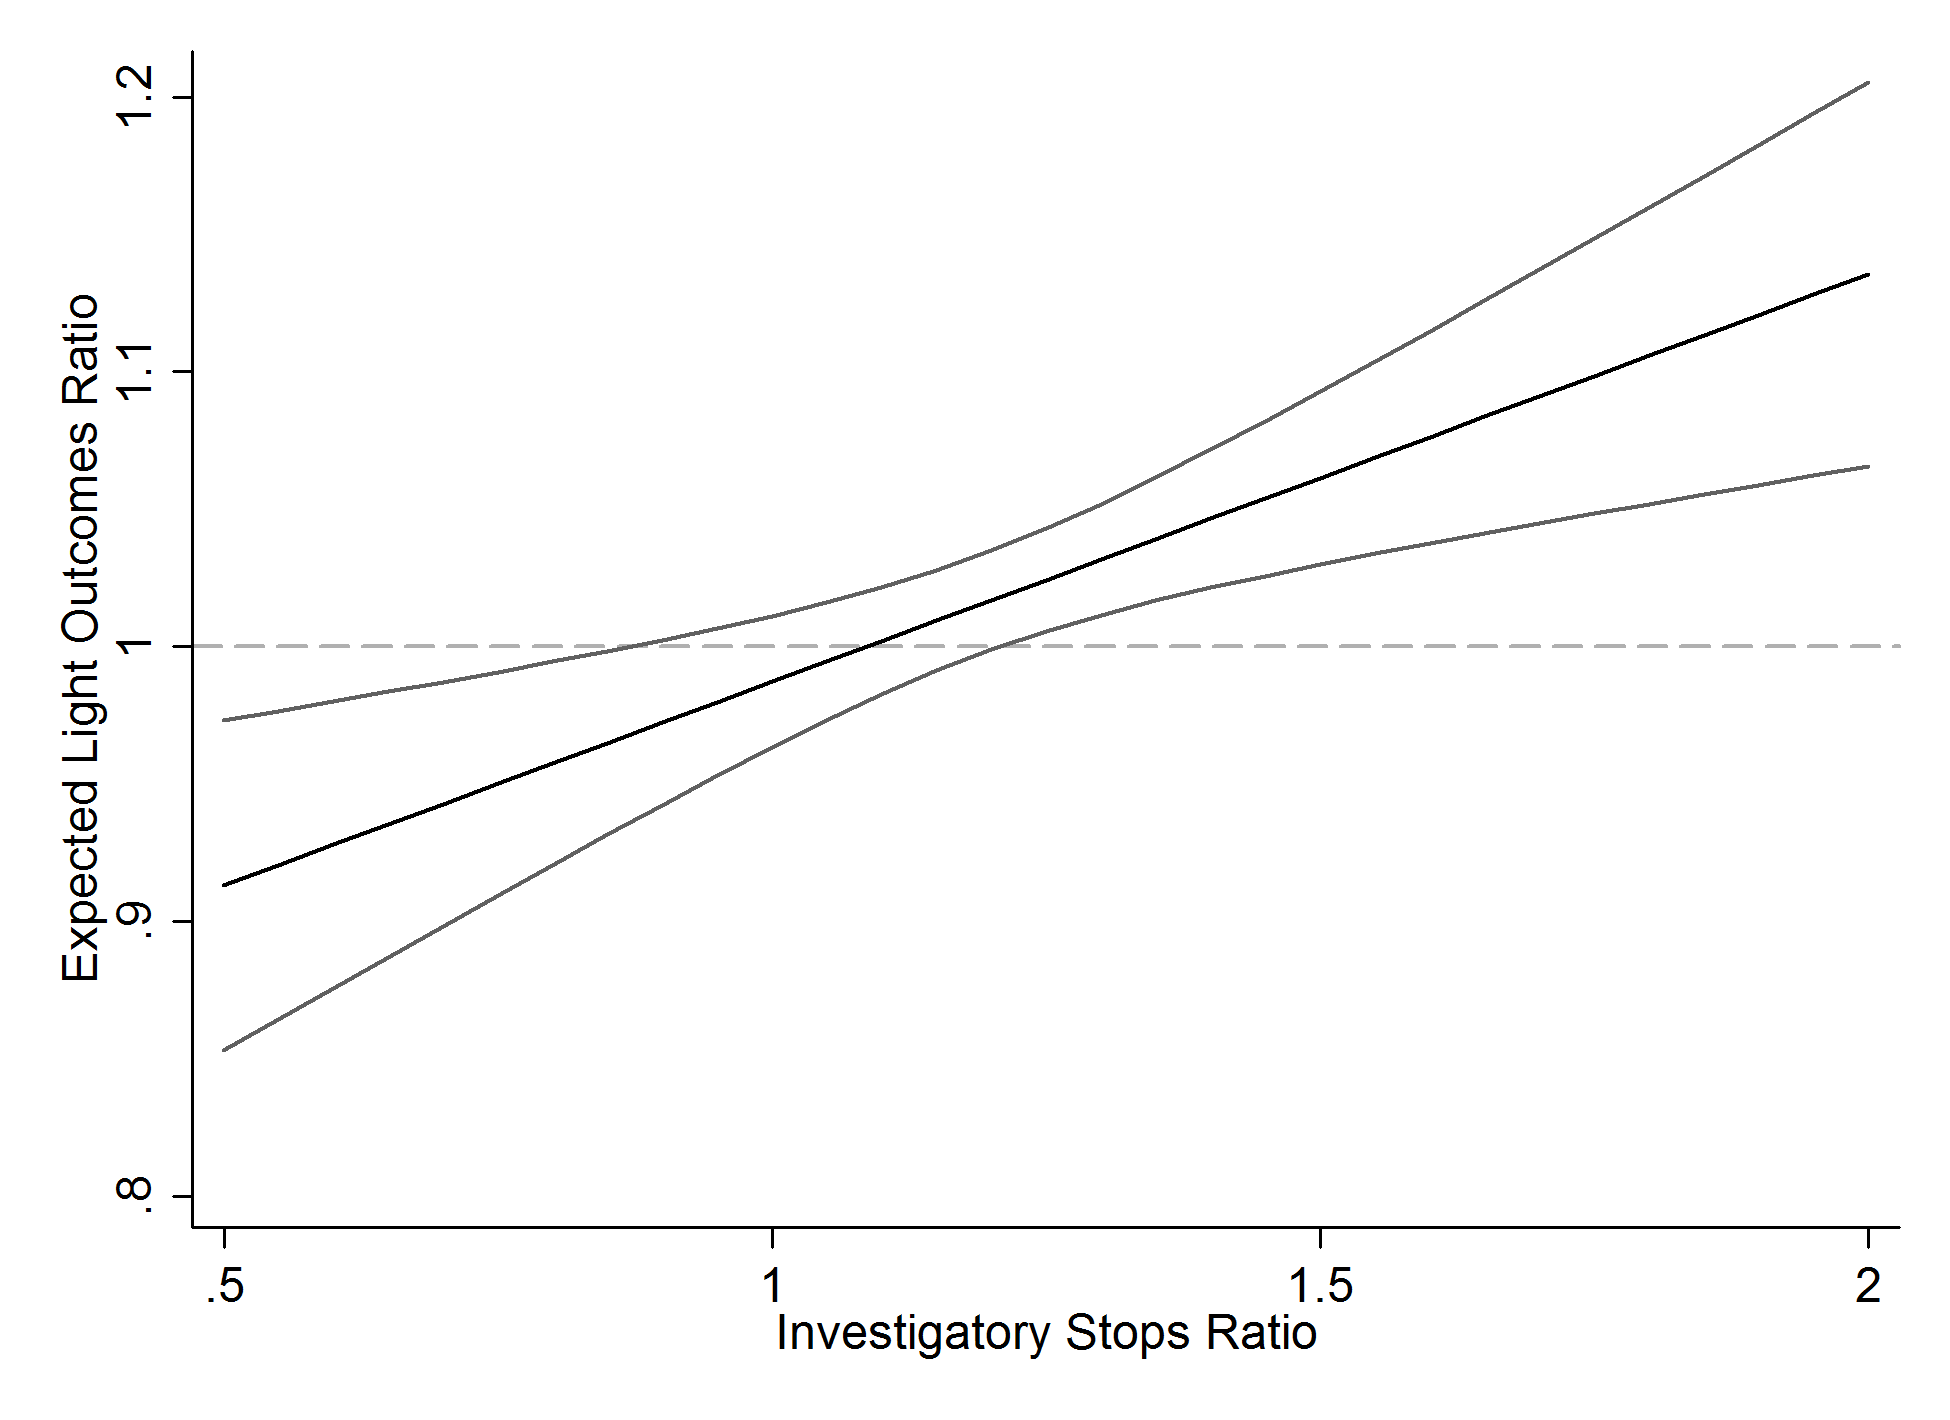
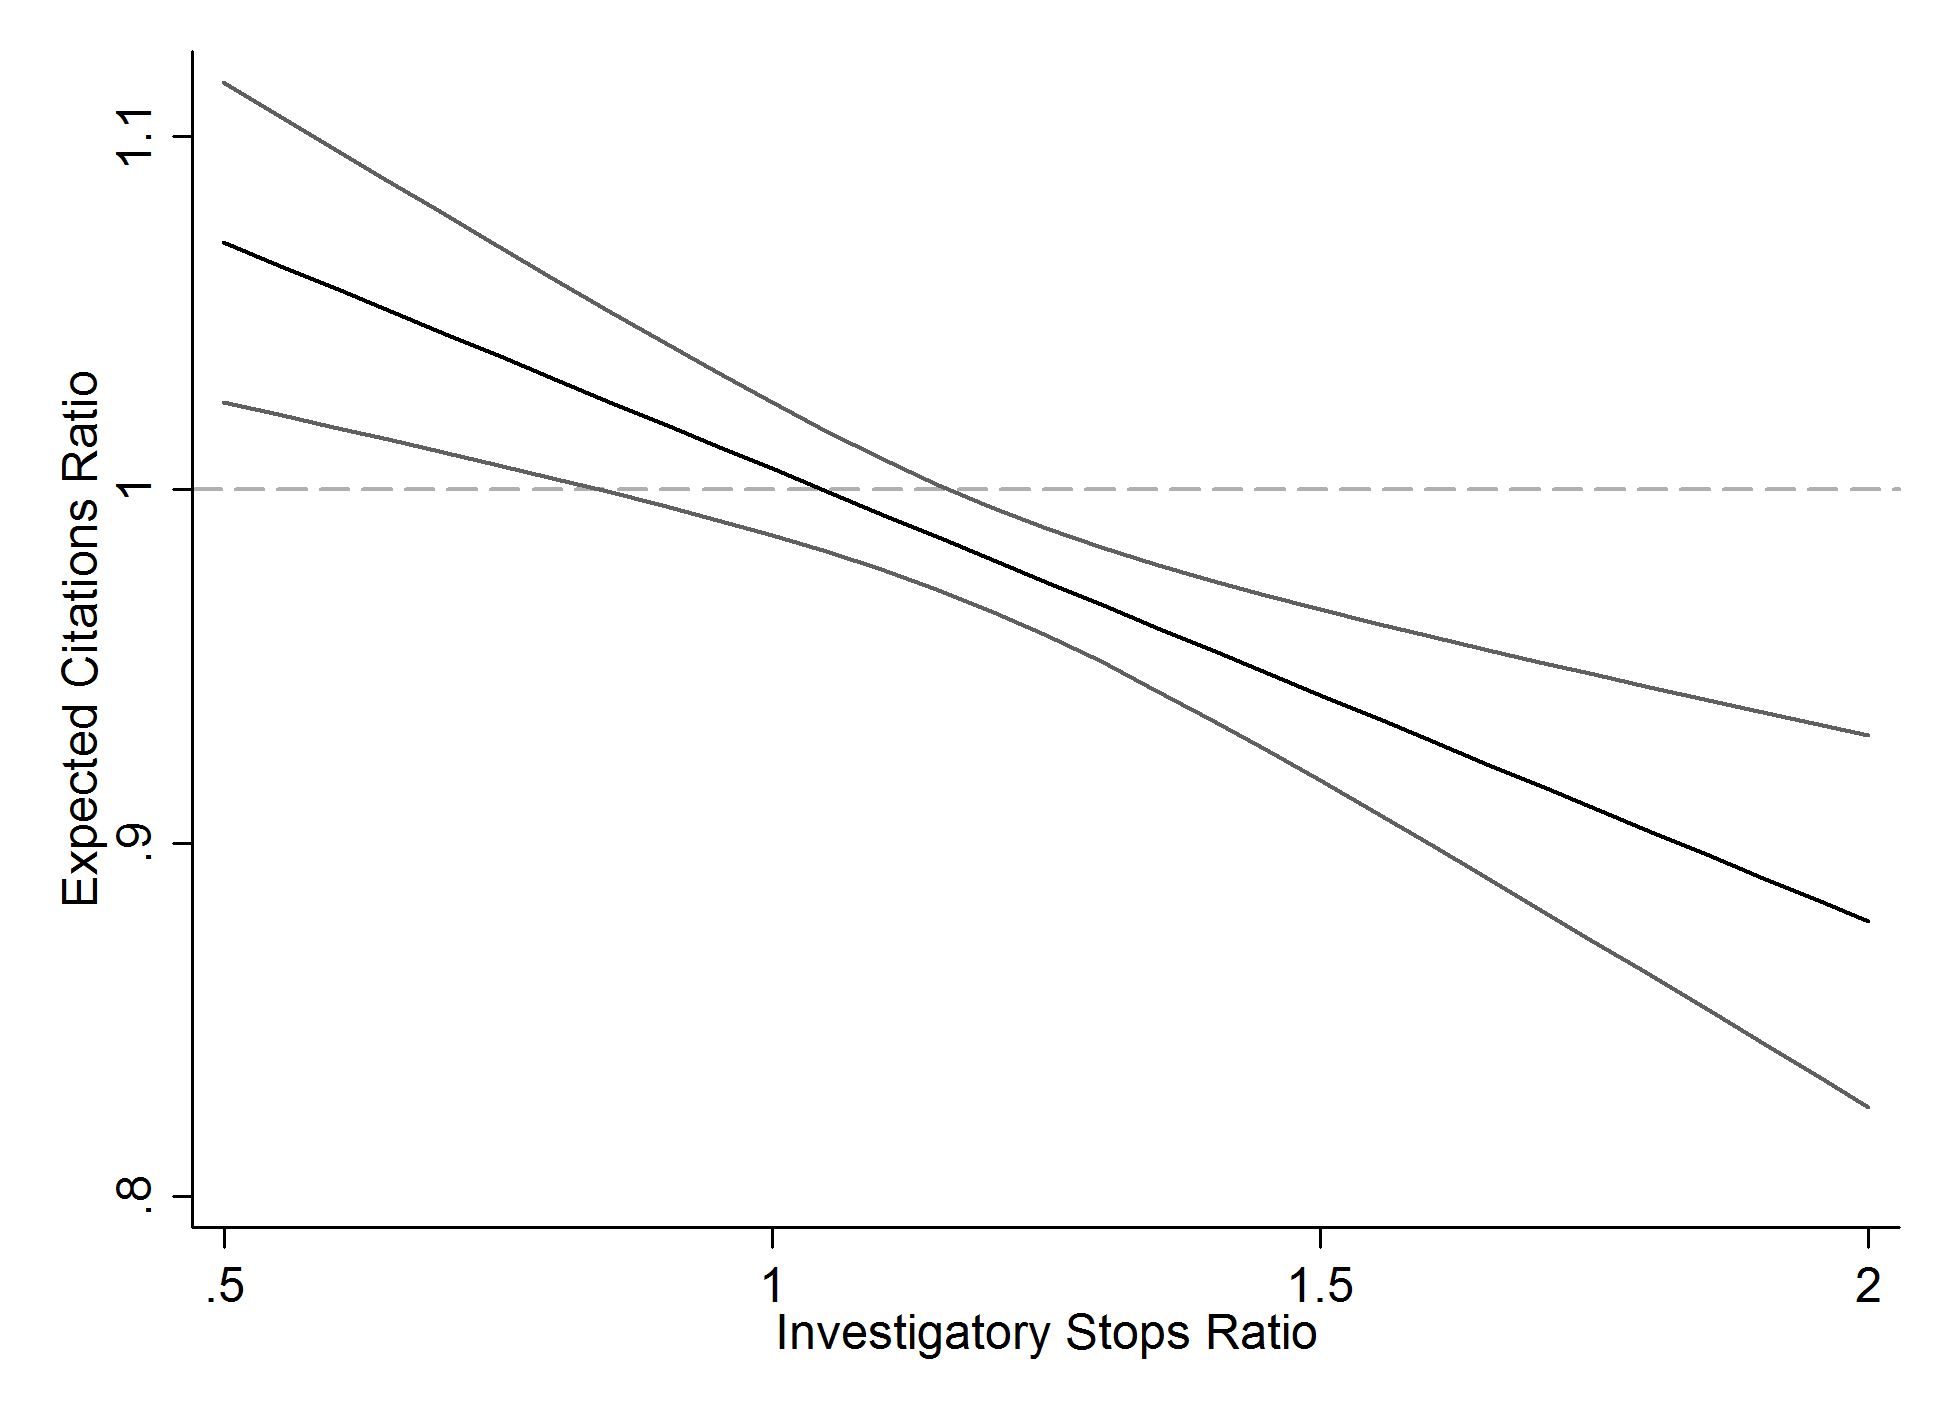
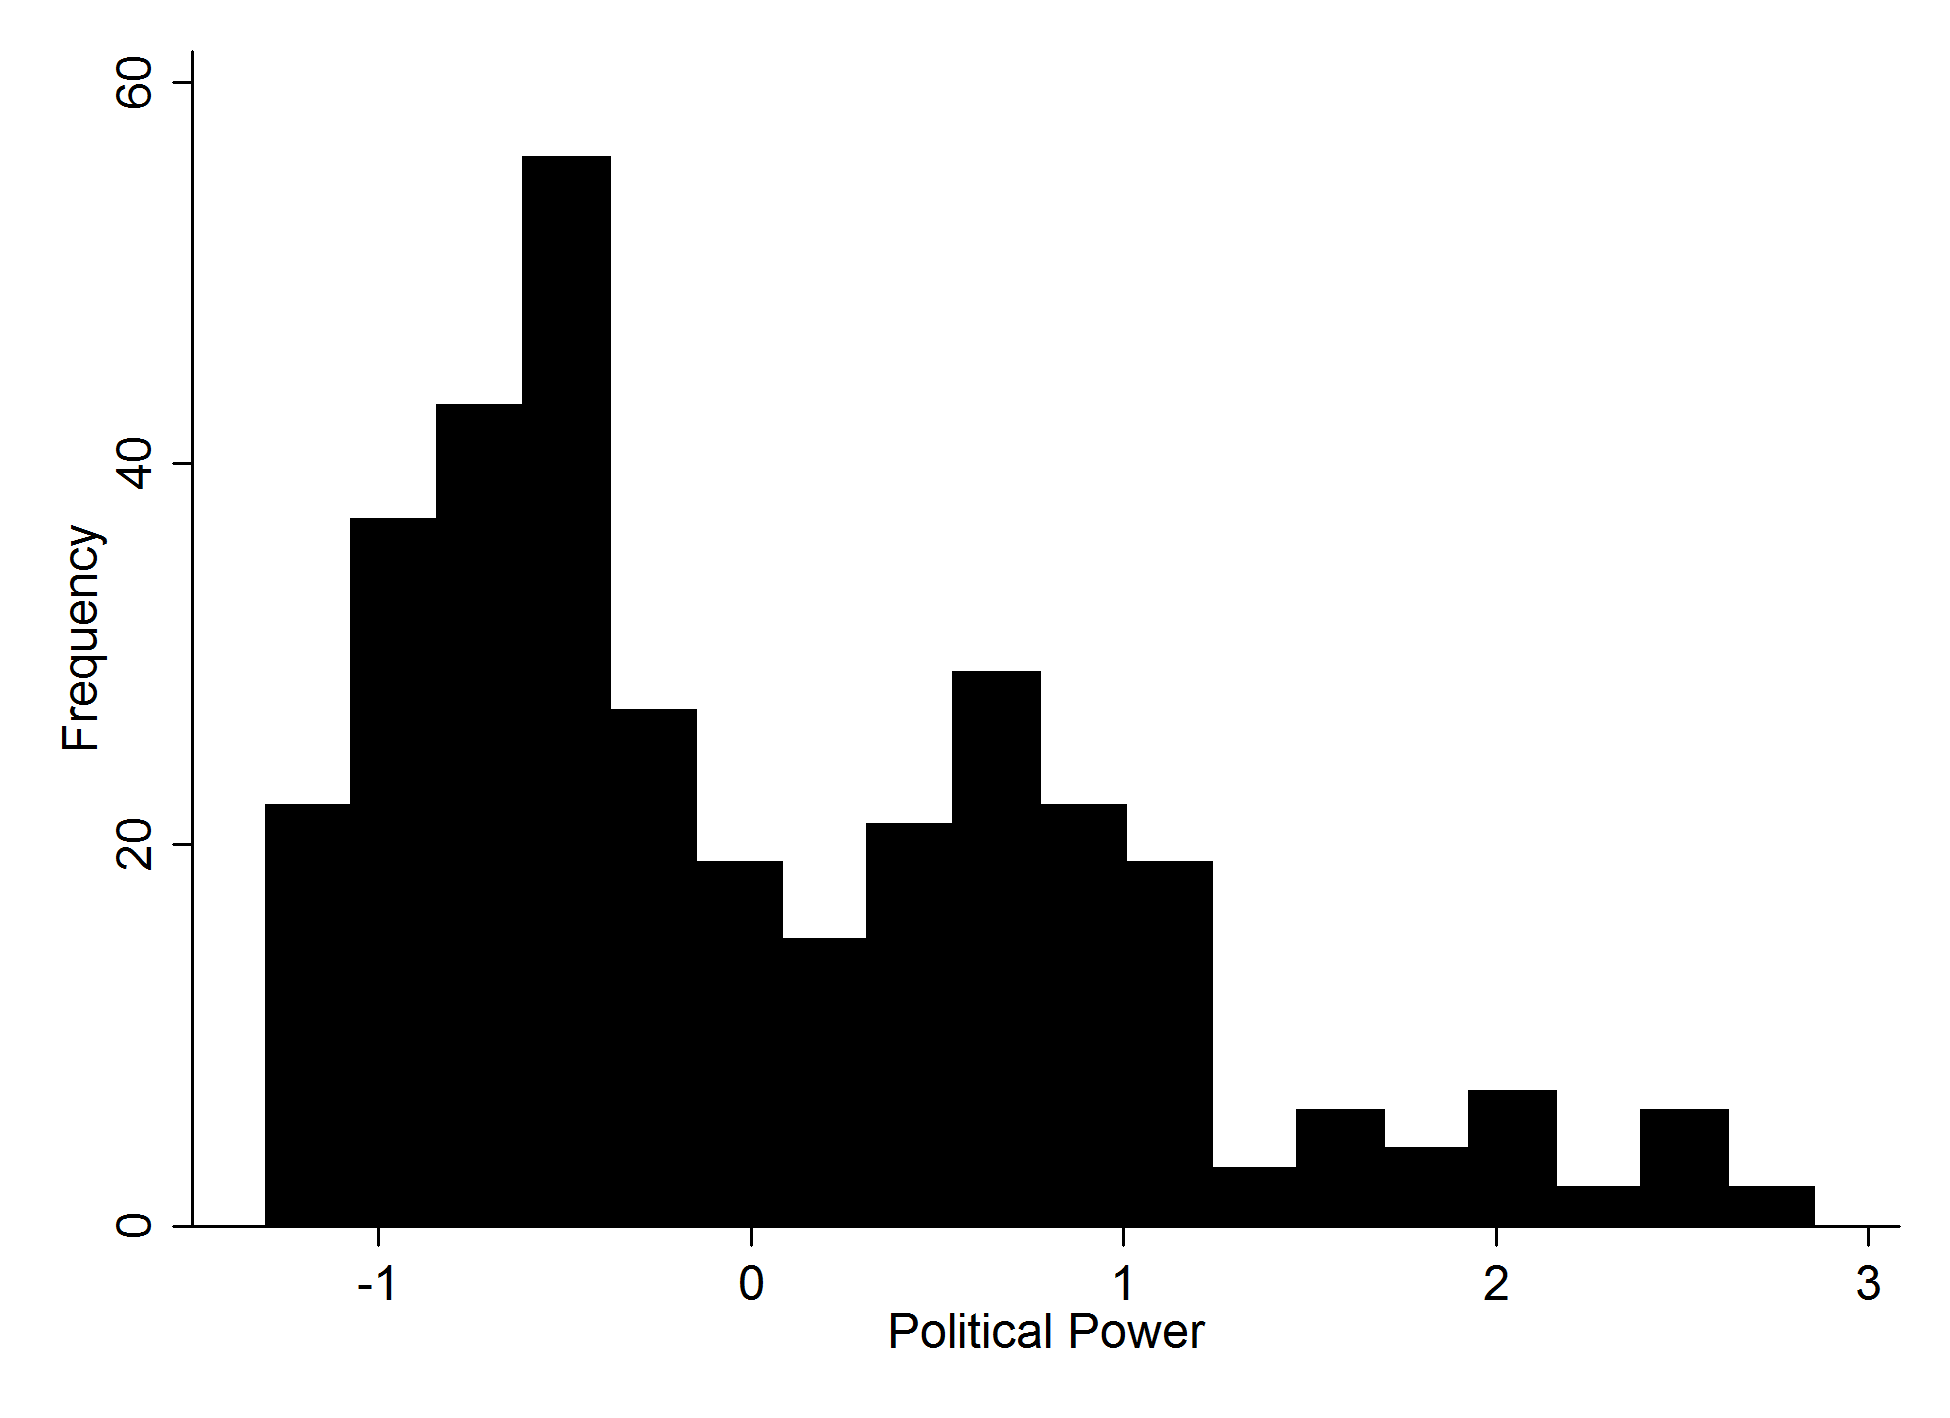
Figure 4.1a -- 4.1b -- 4.1c -- 4.1d -- 4.1e -- 4.1e -- 4.1f -- 4.1g -- 4.1h -- 4.2 -- 4.3a -- 4.3b -- 4.4a -- 4.4b -- 4.4c -- 4.4d -- 4.4e -- 4.4f
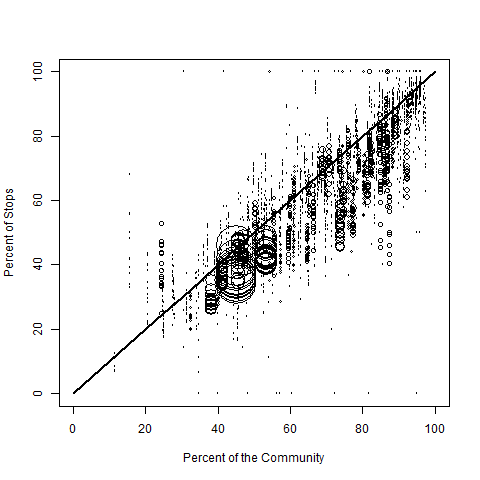
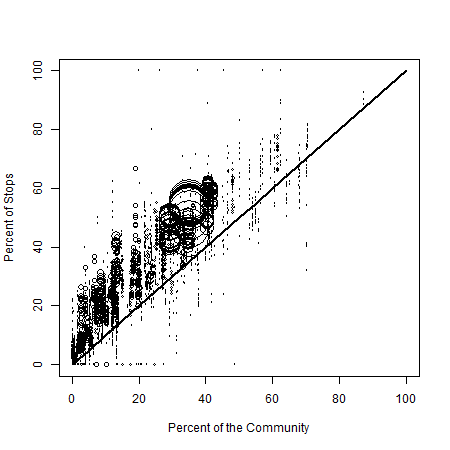
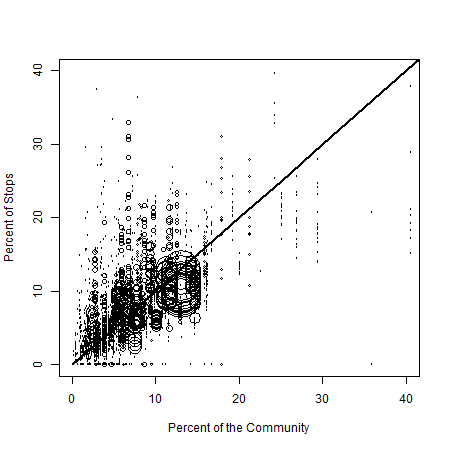
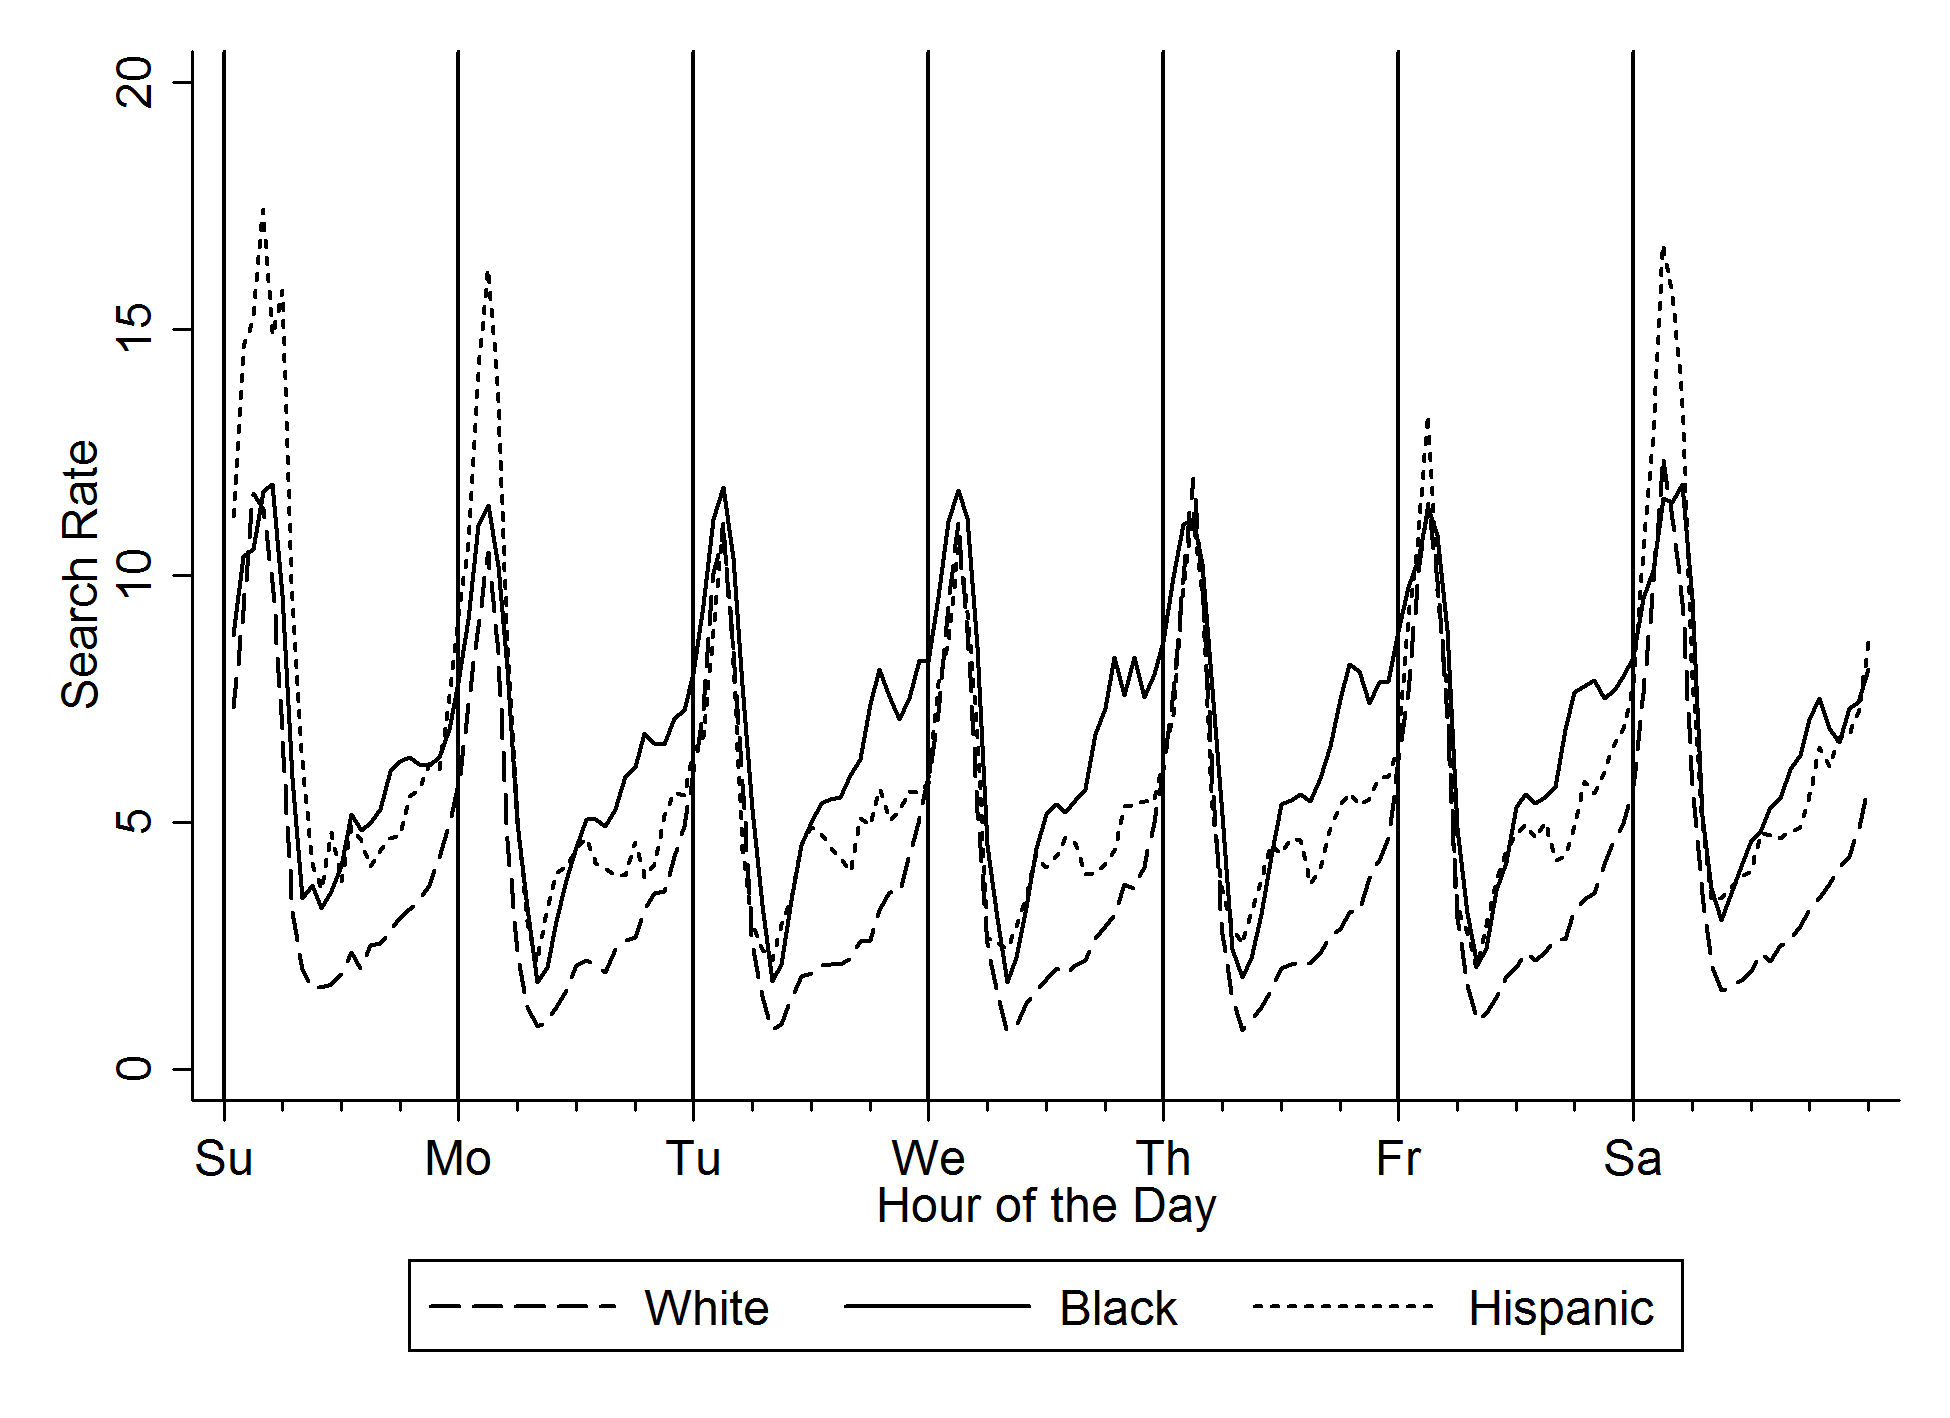
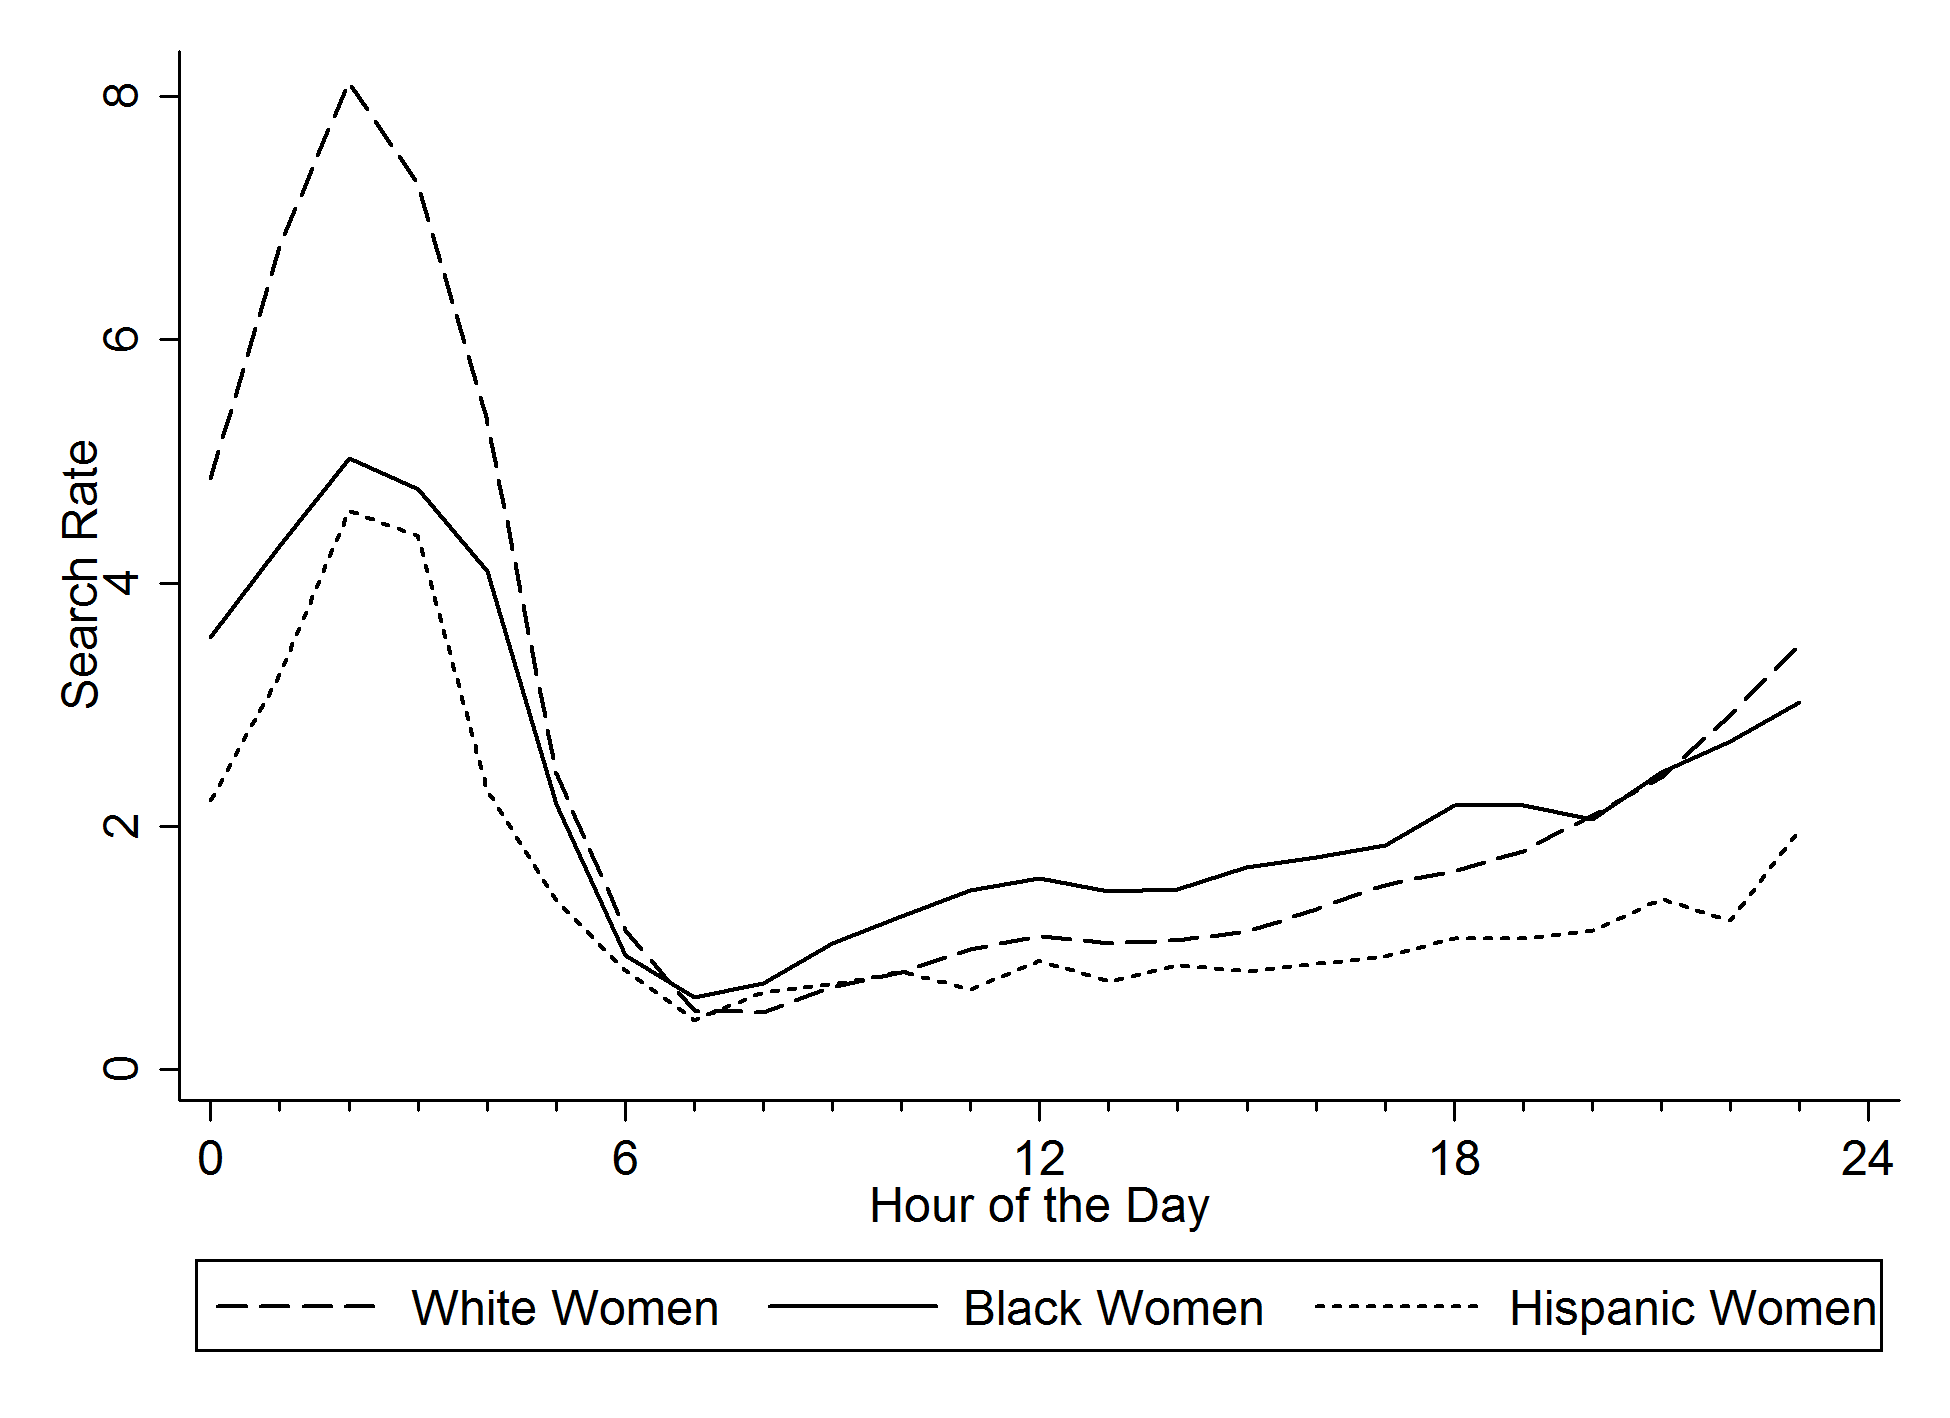
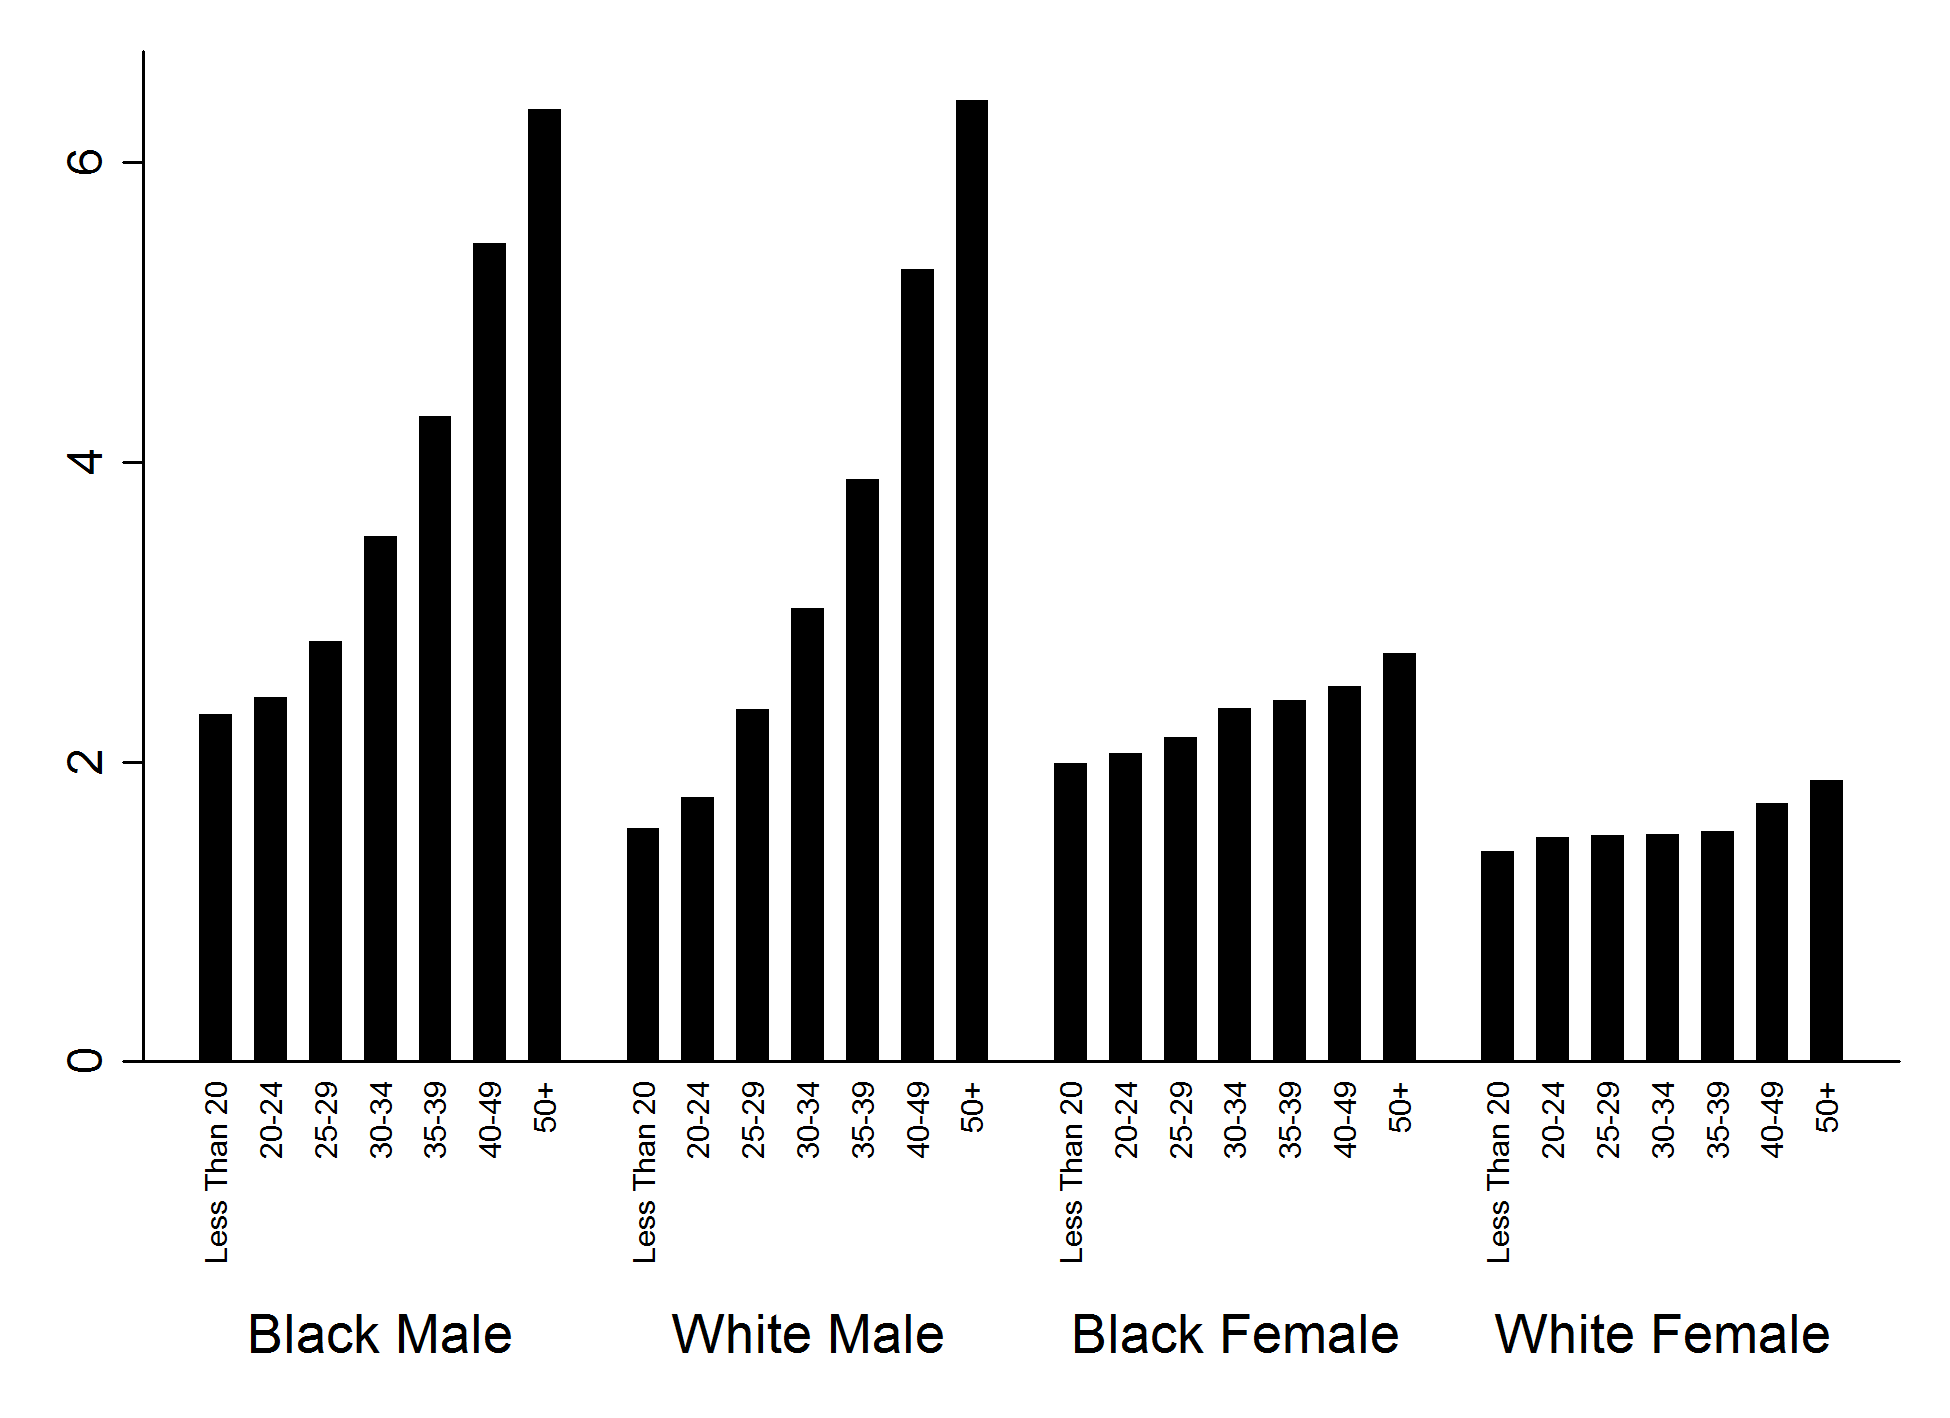
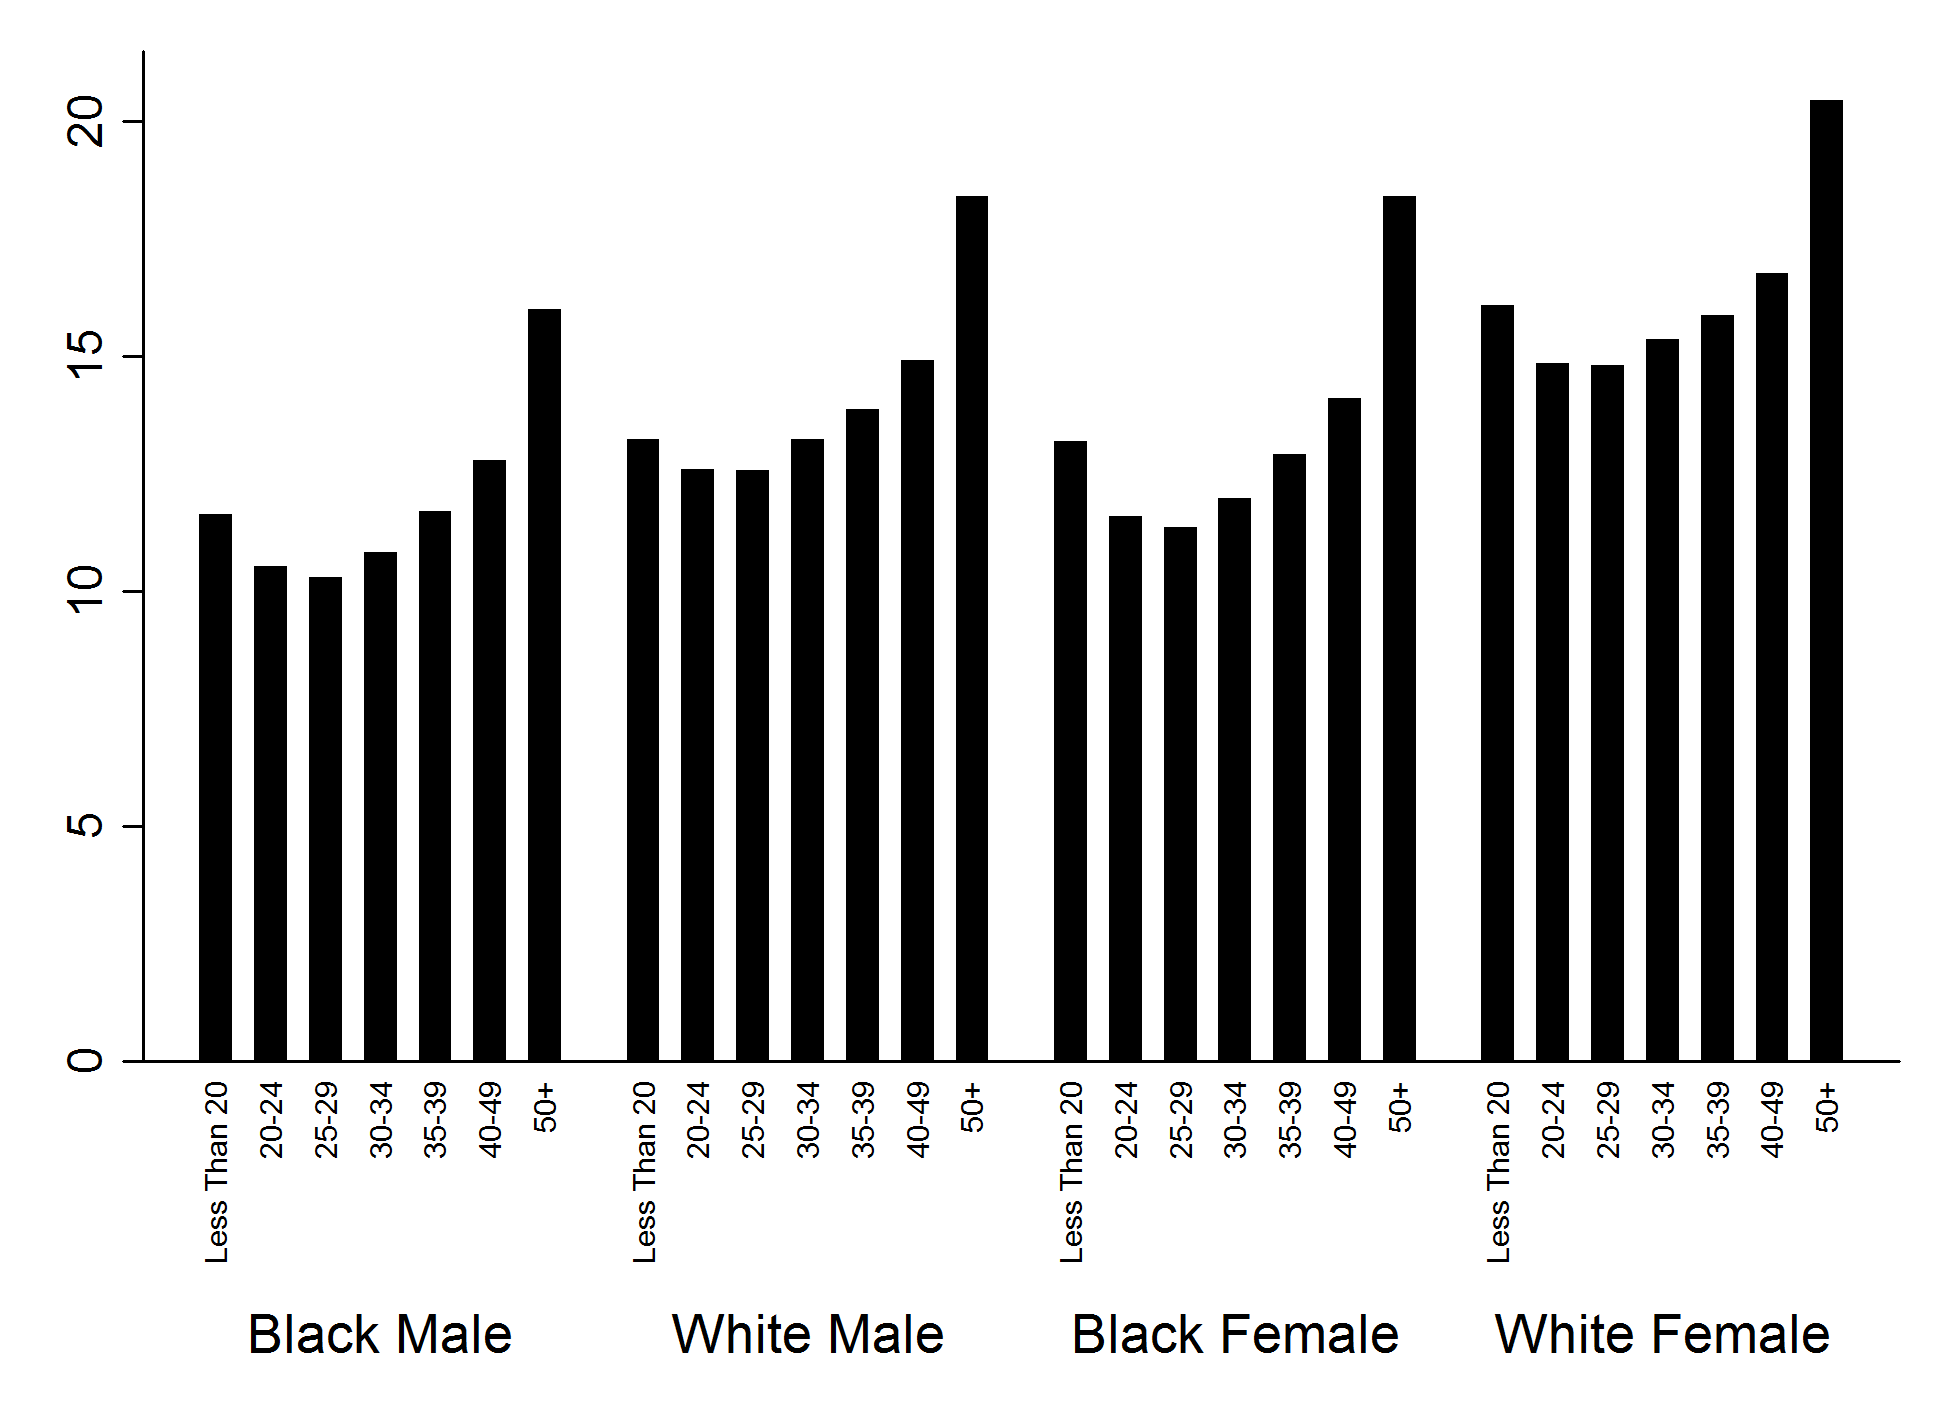
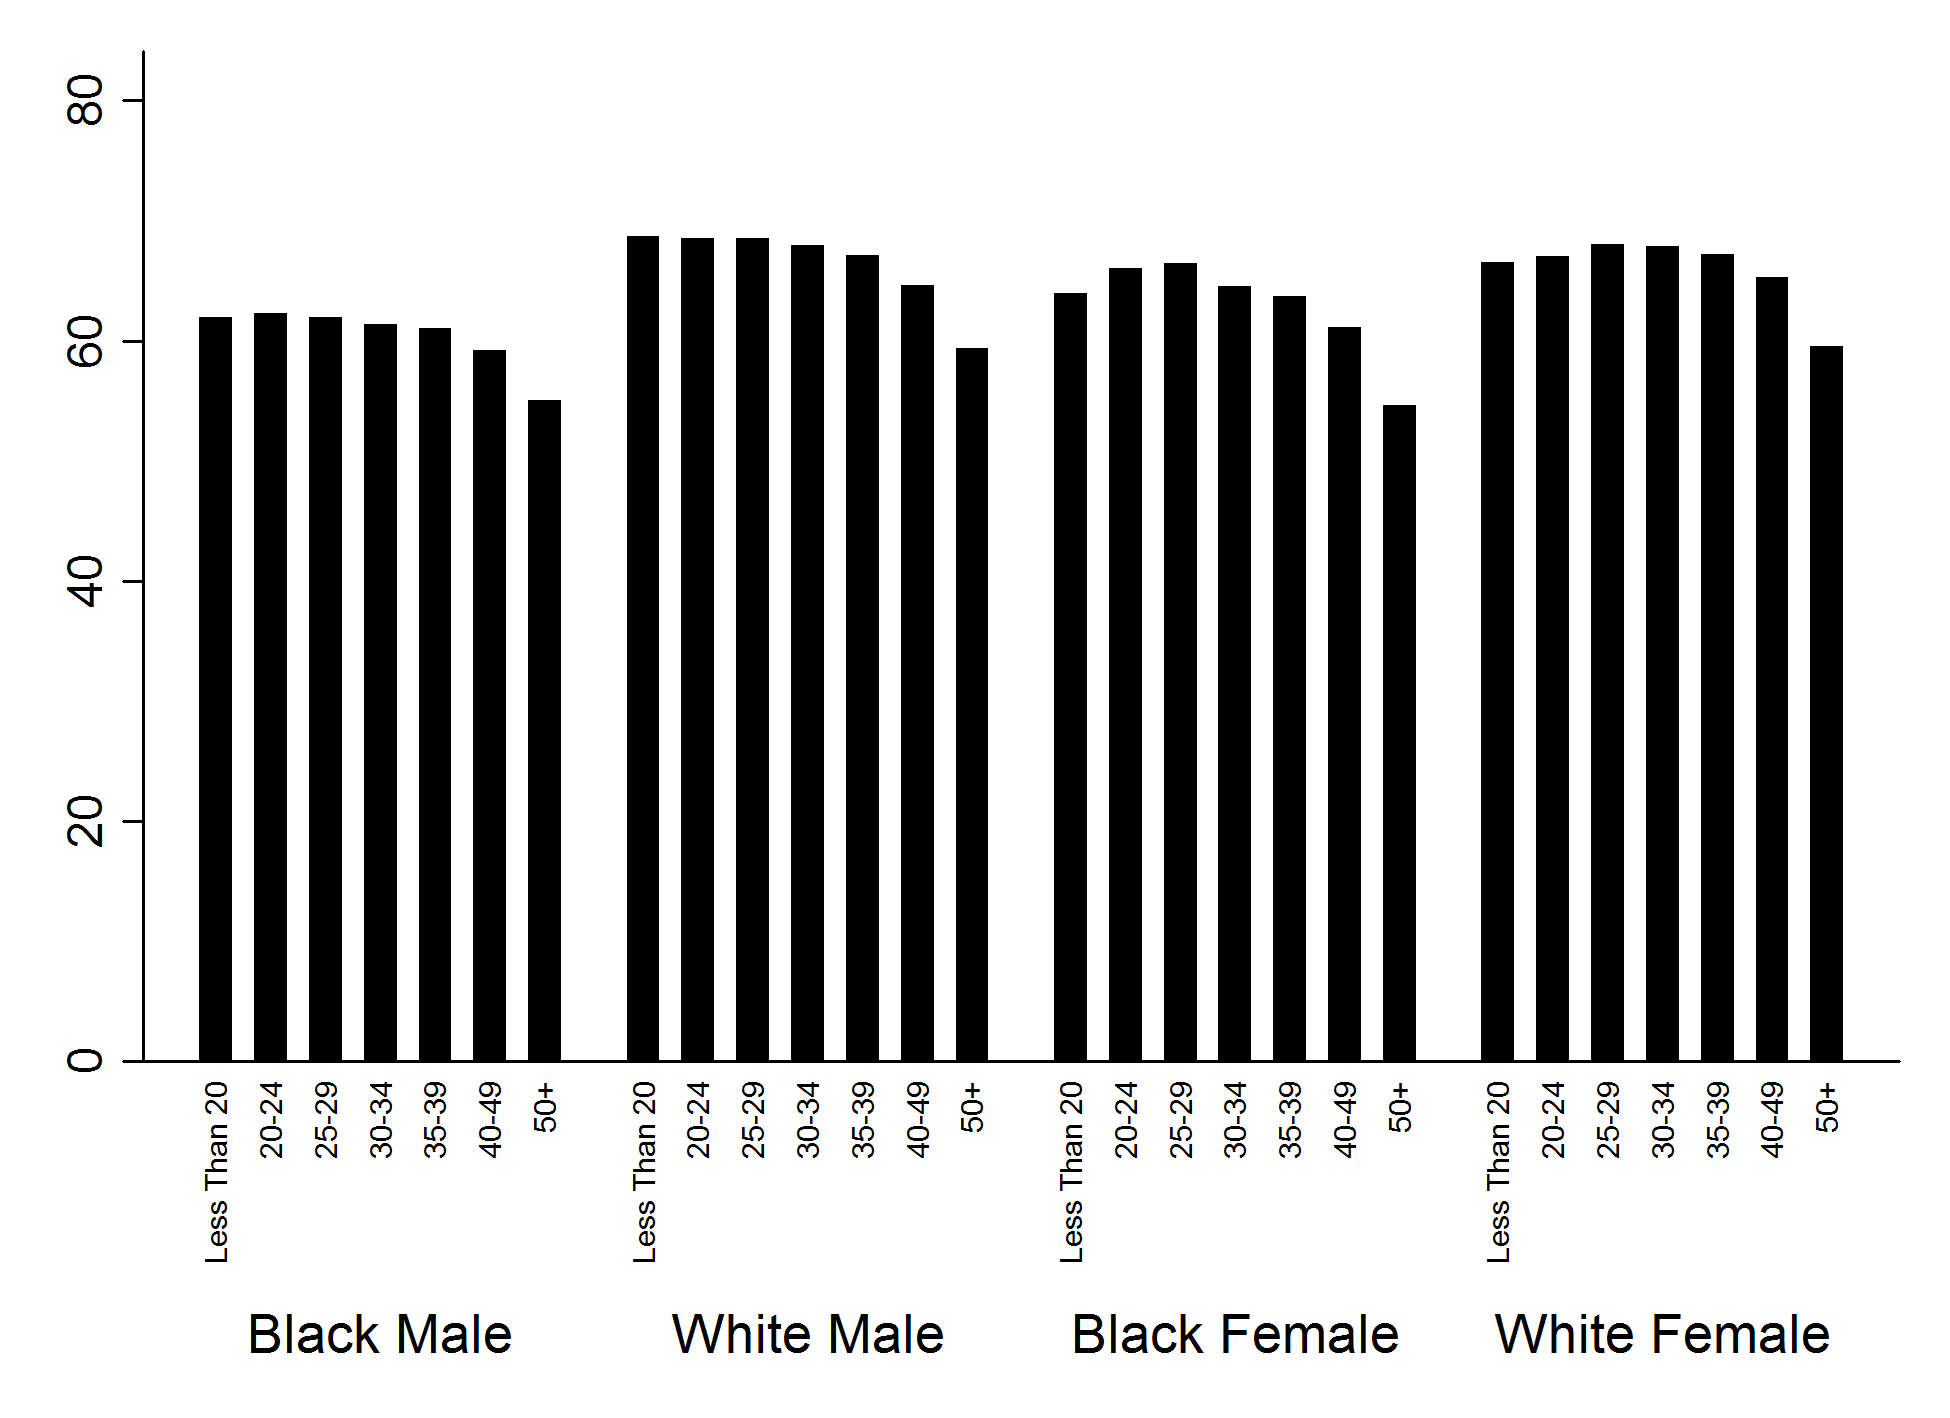
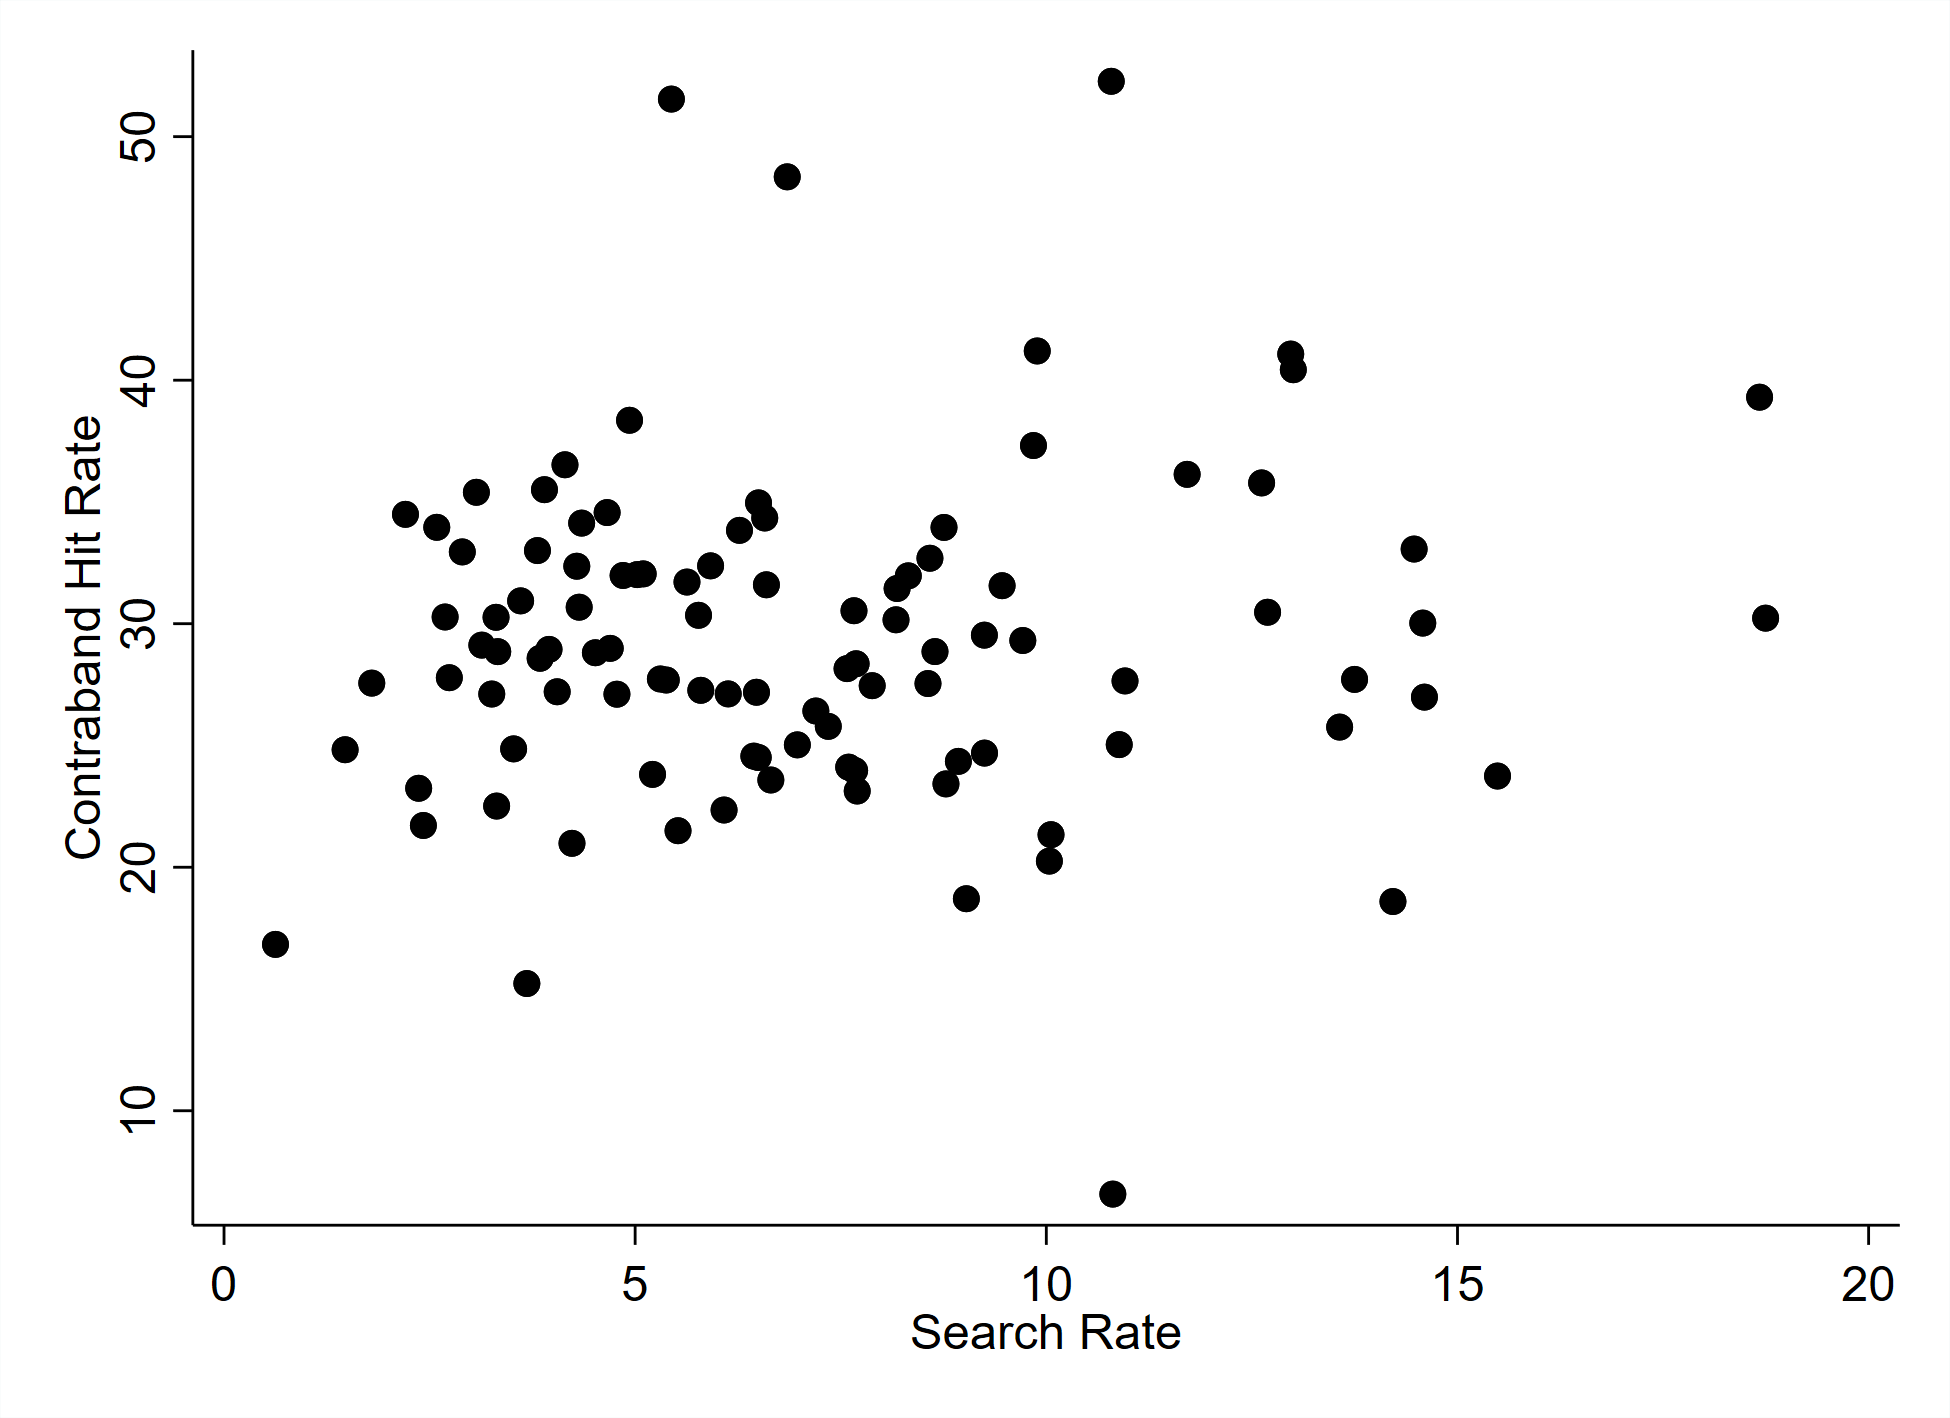
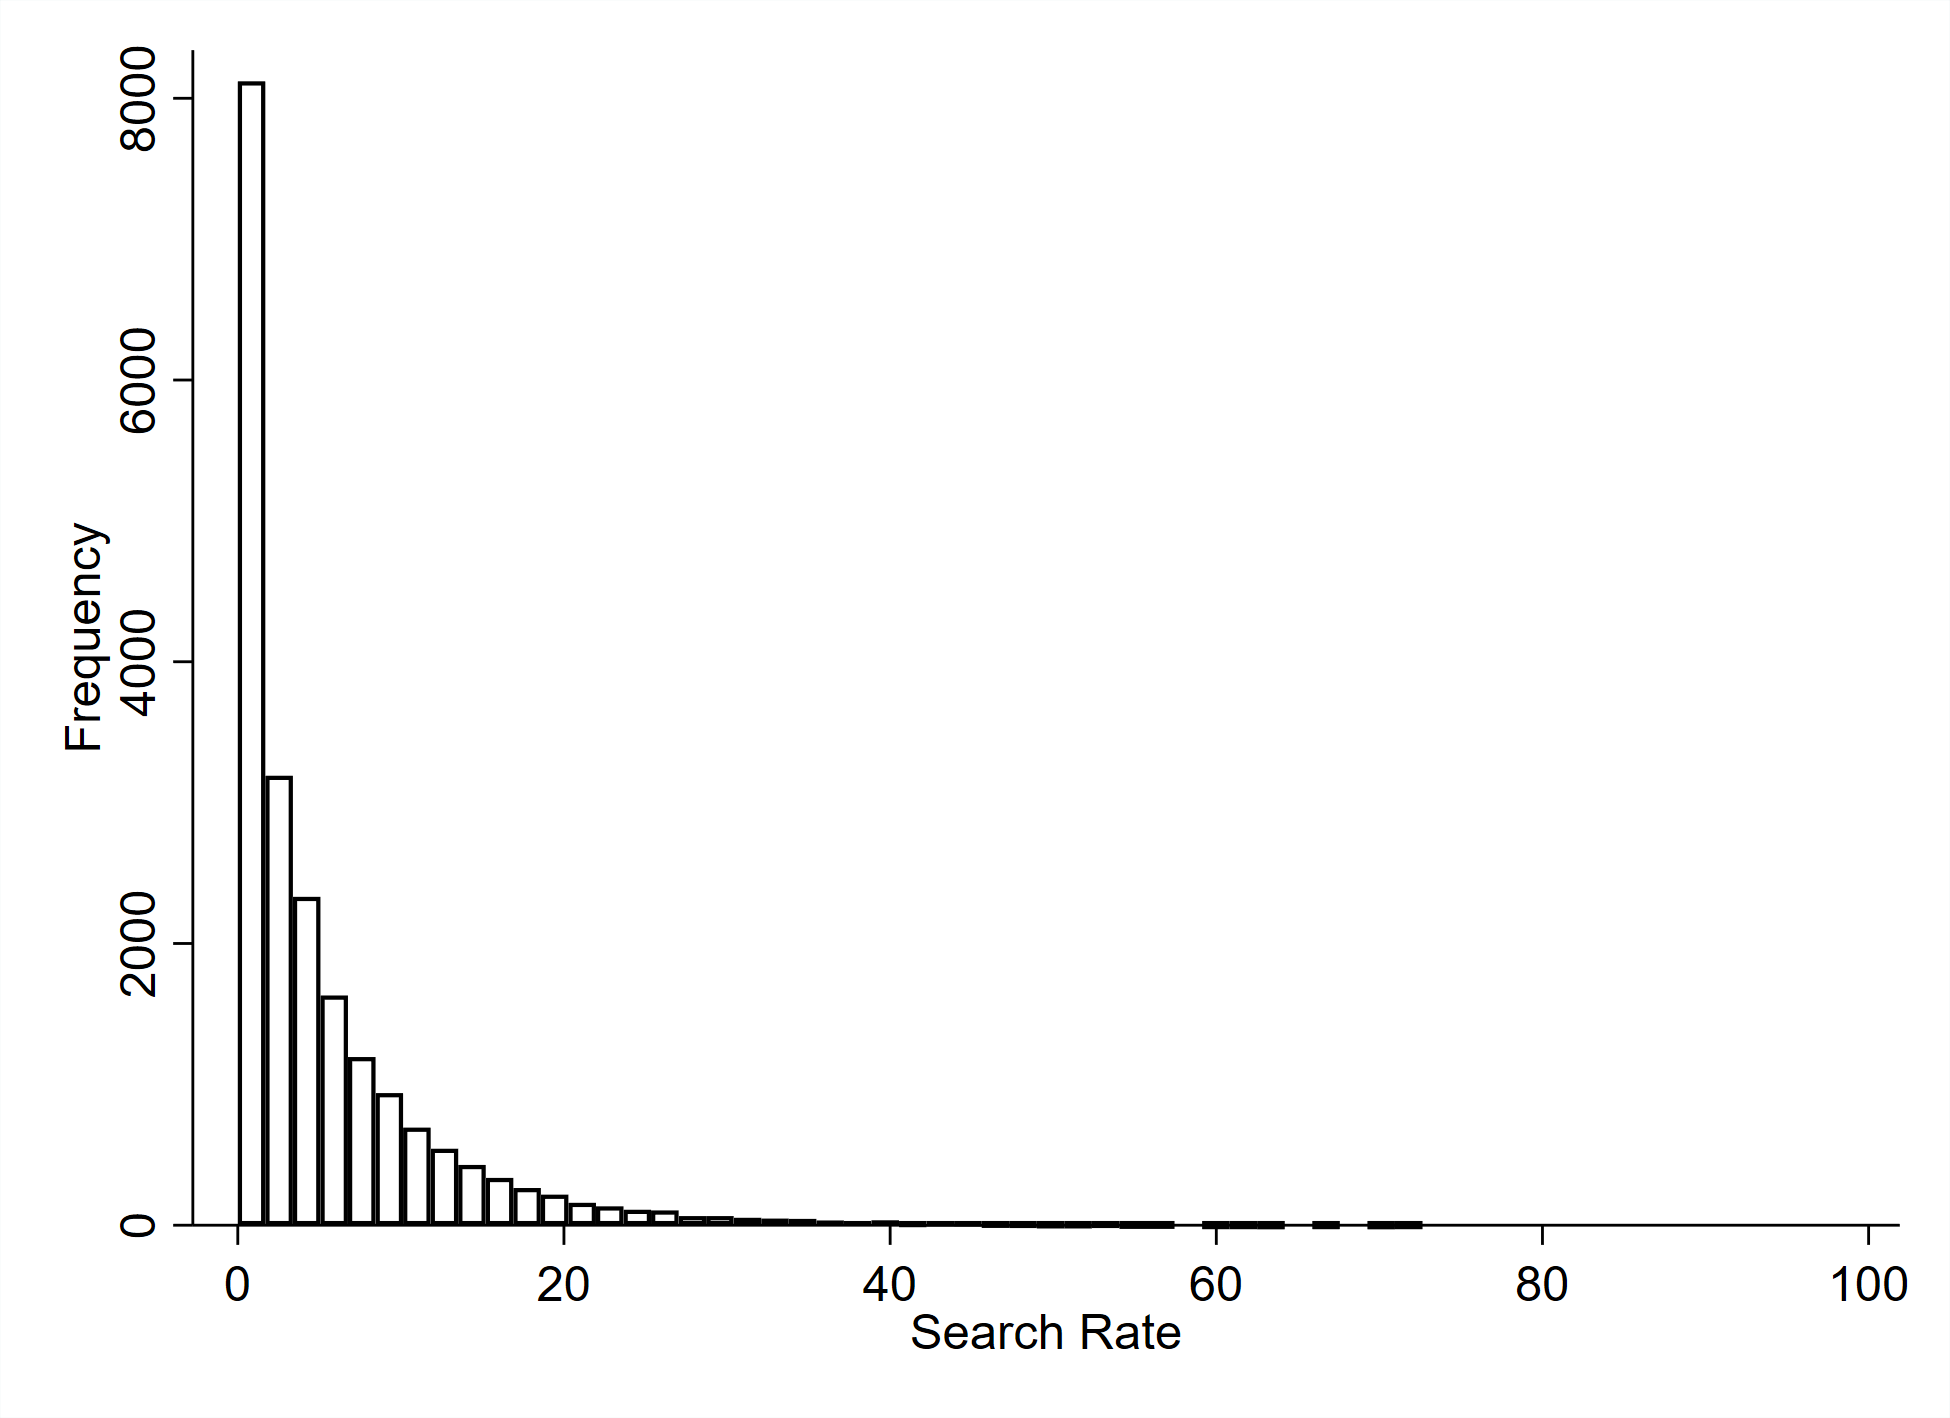
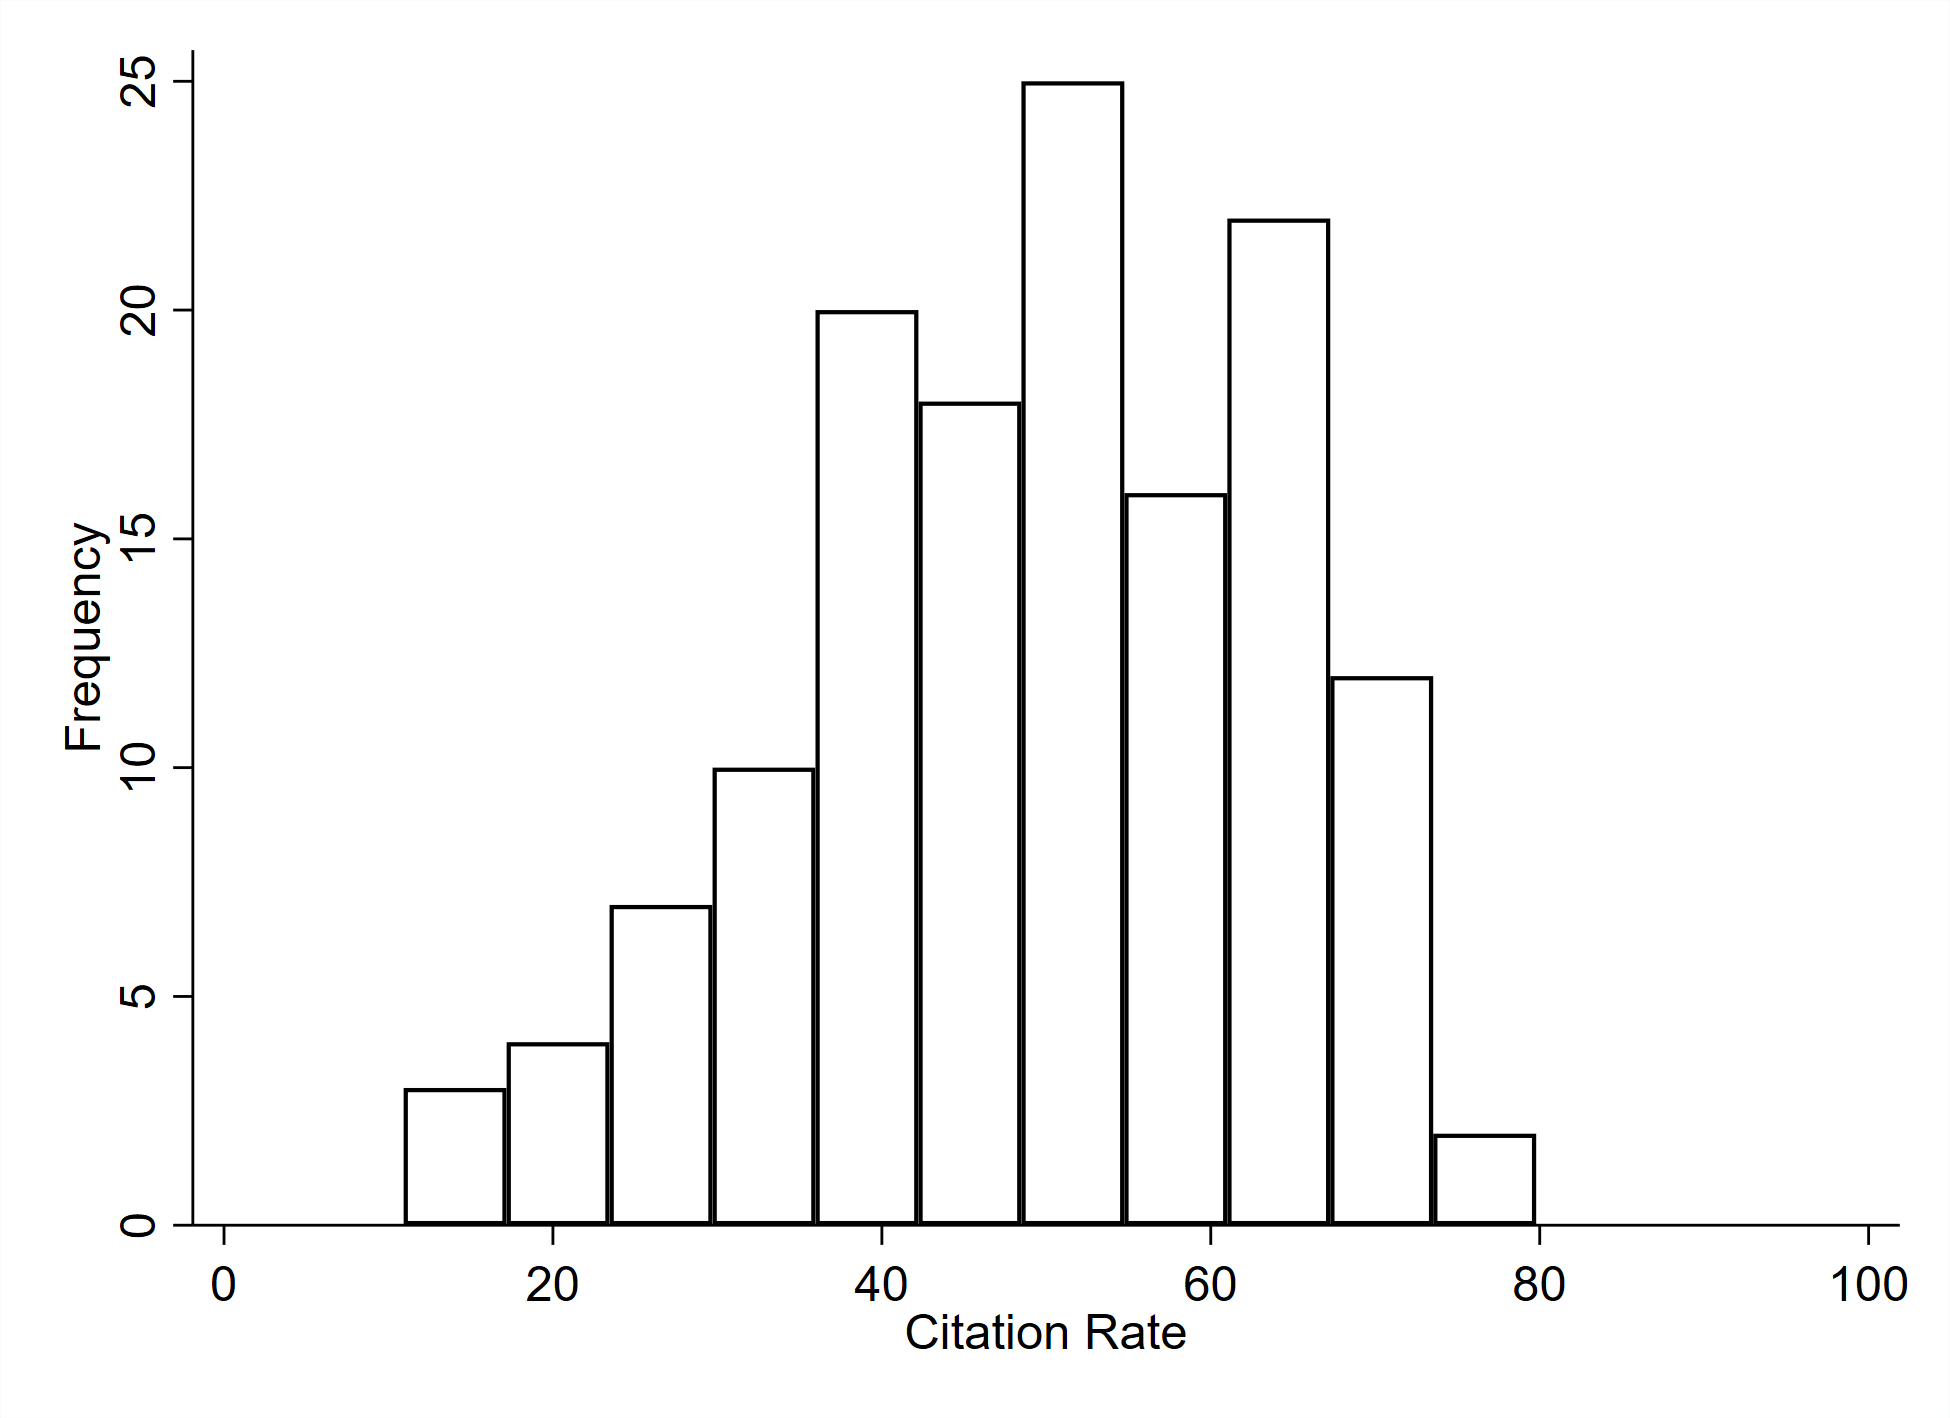
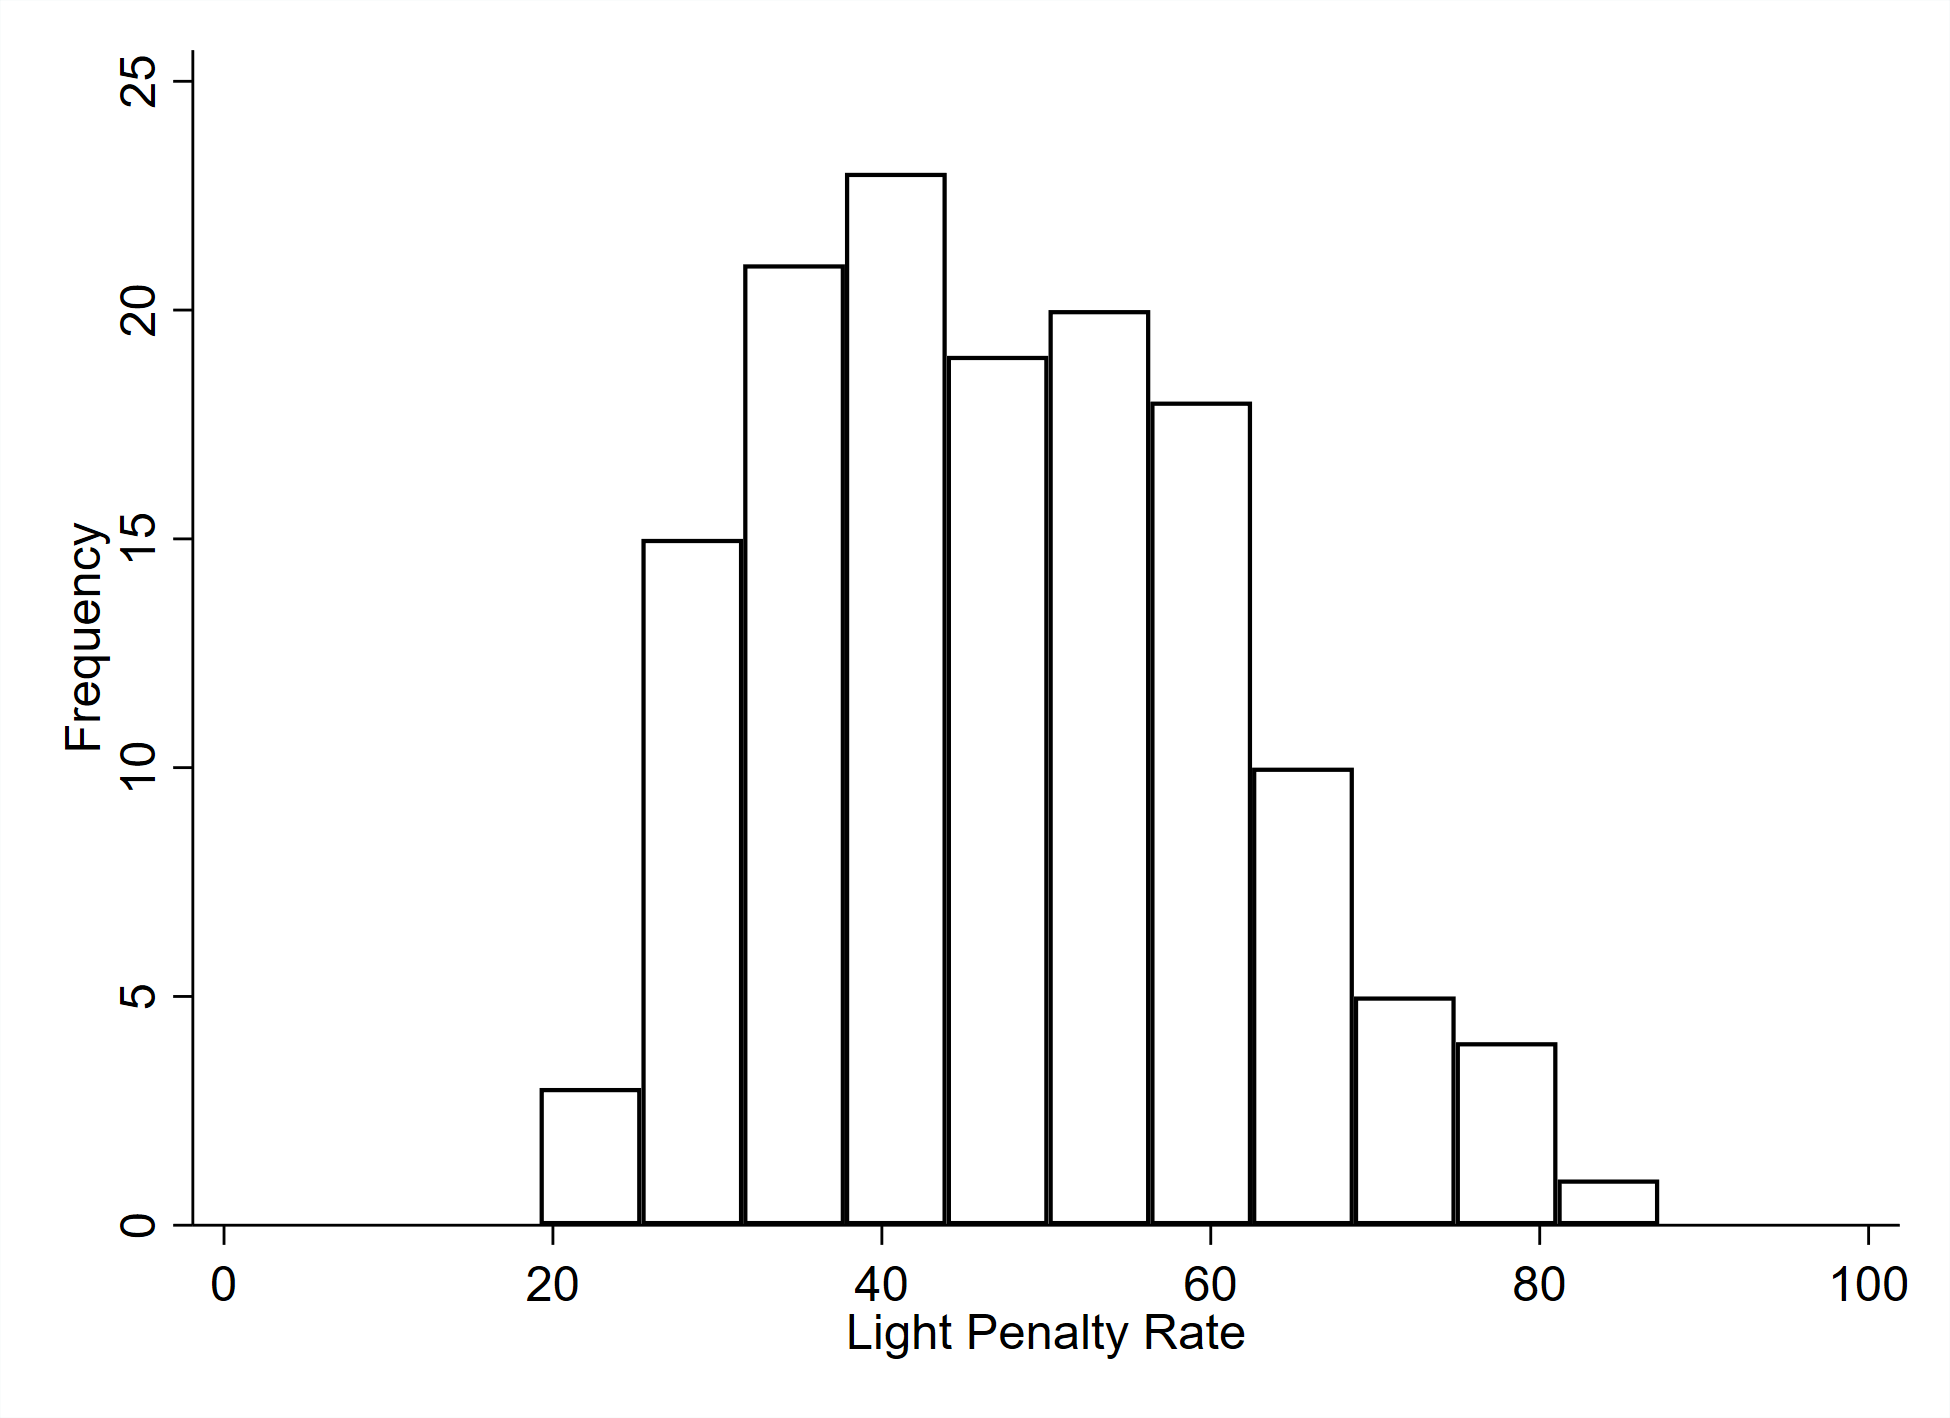
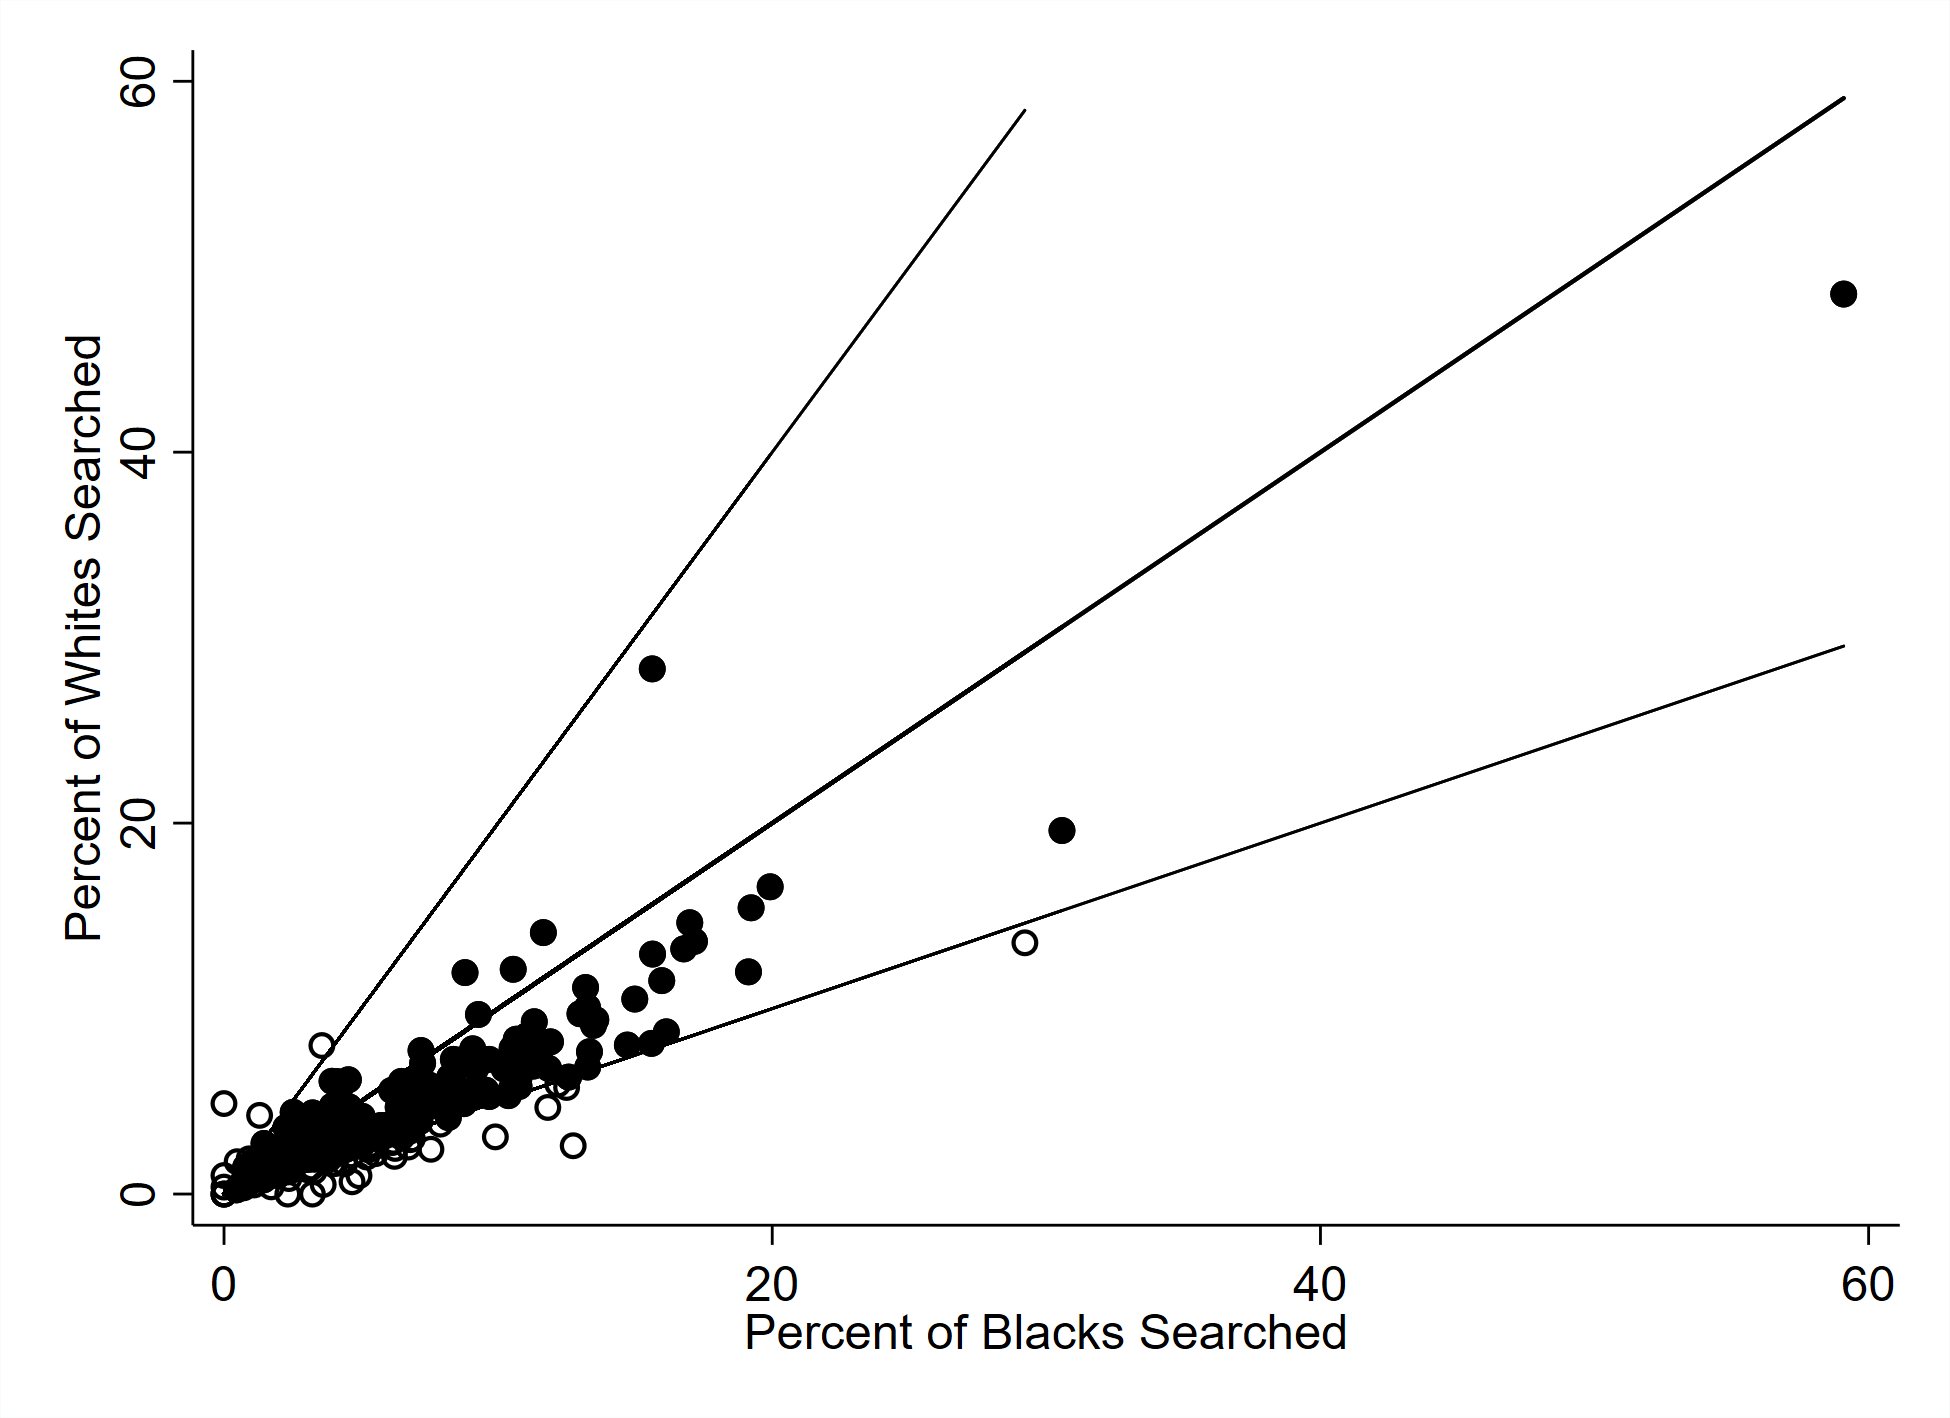
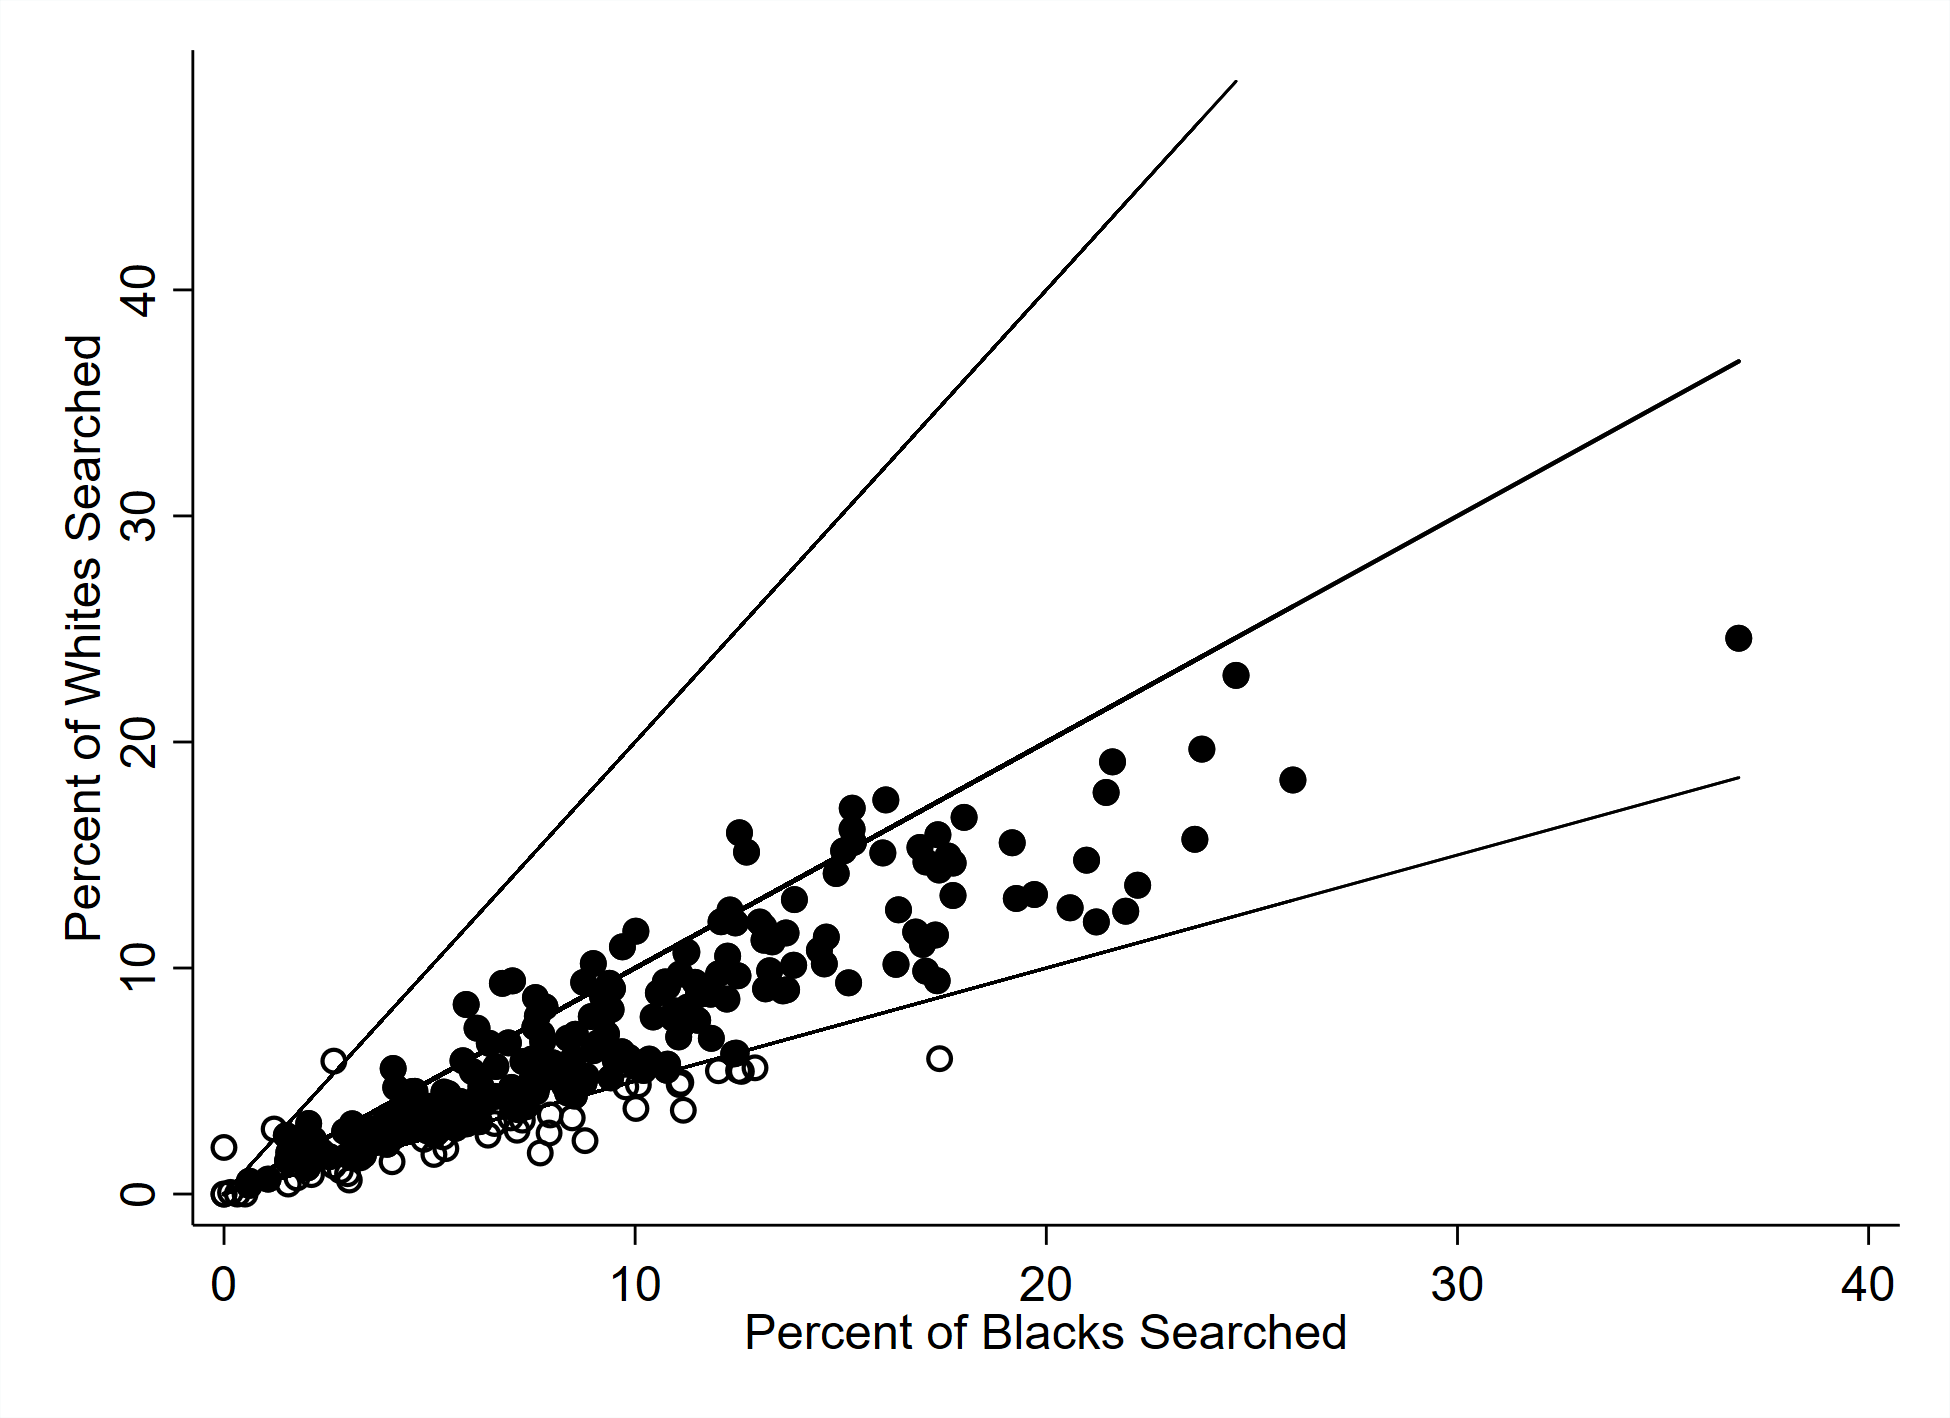
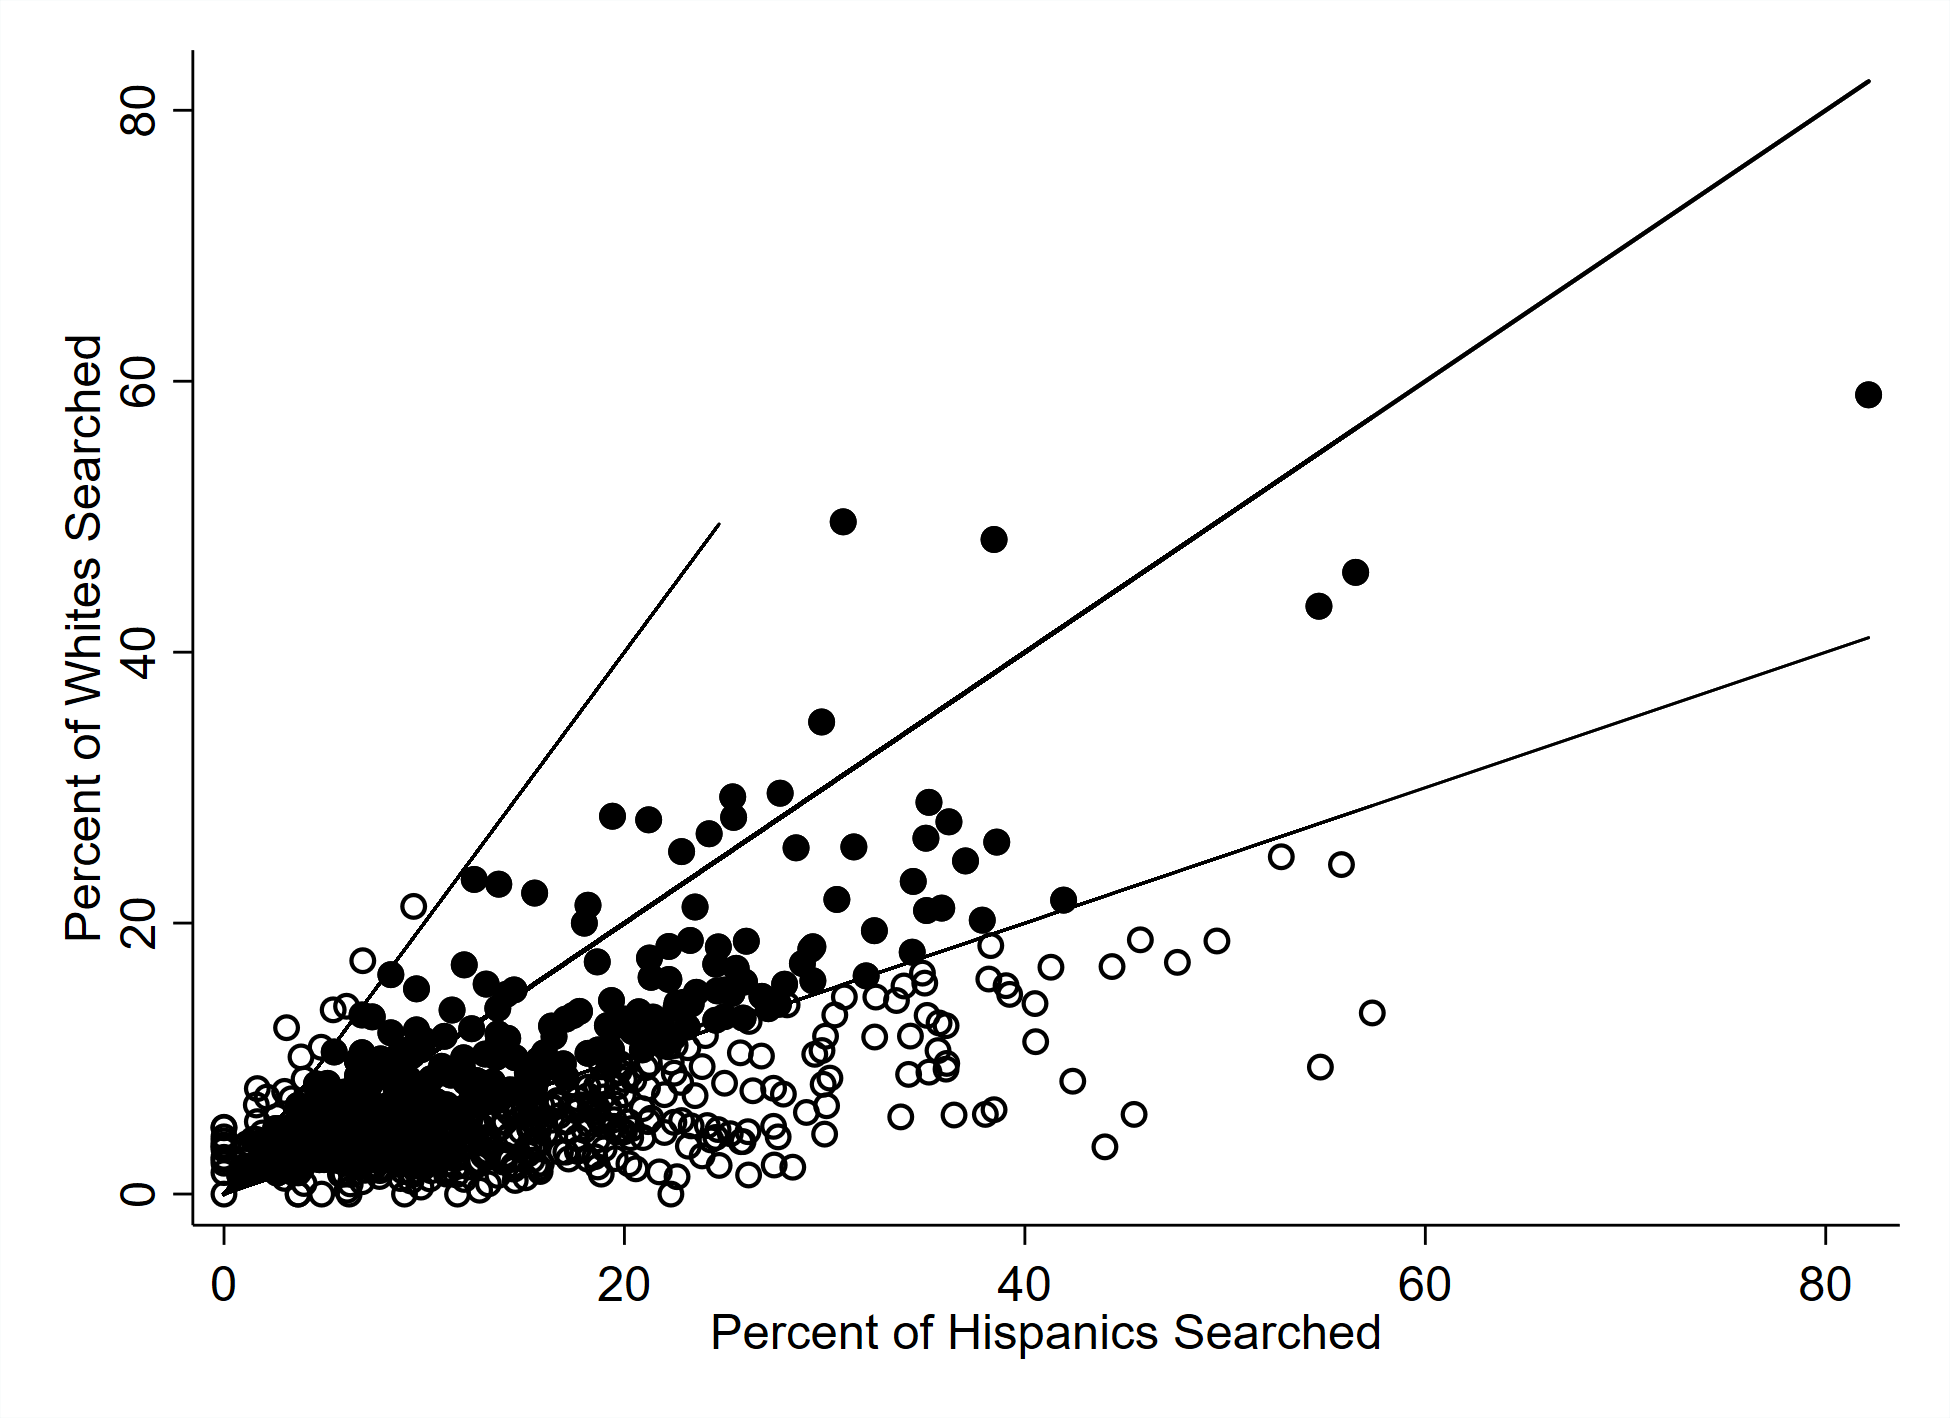
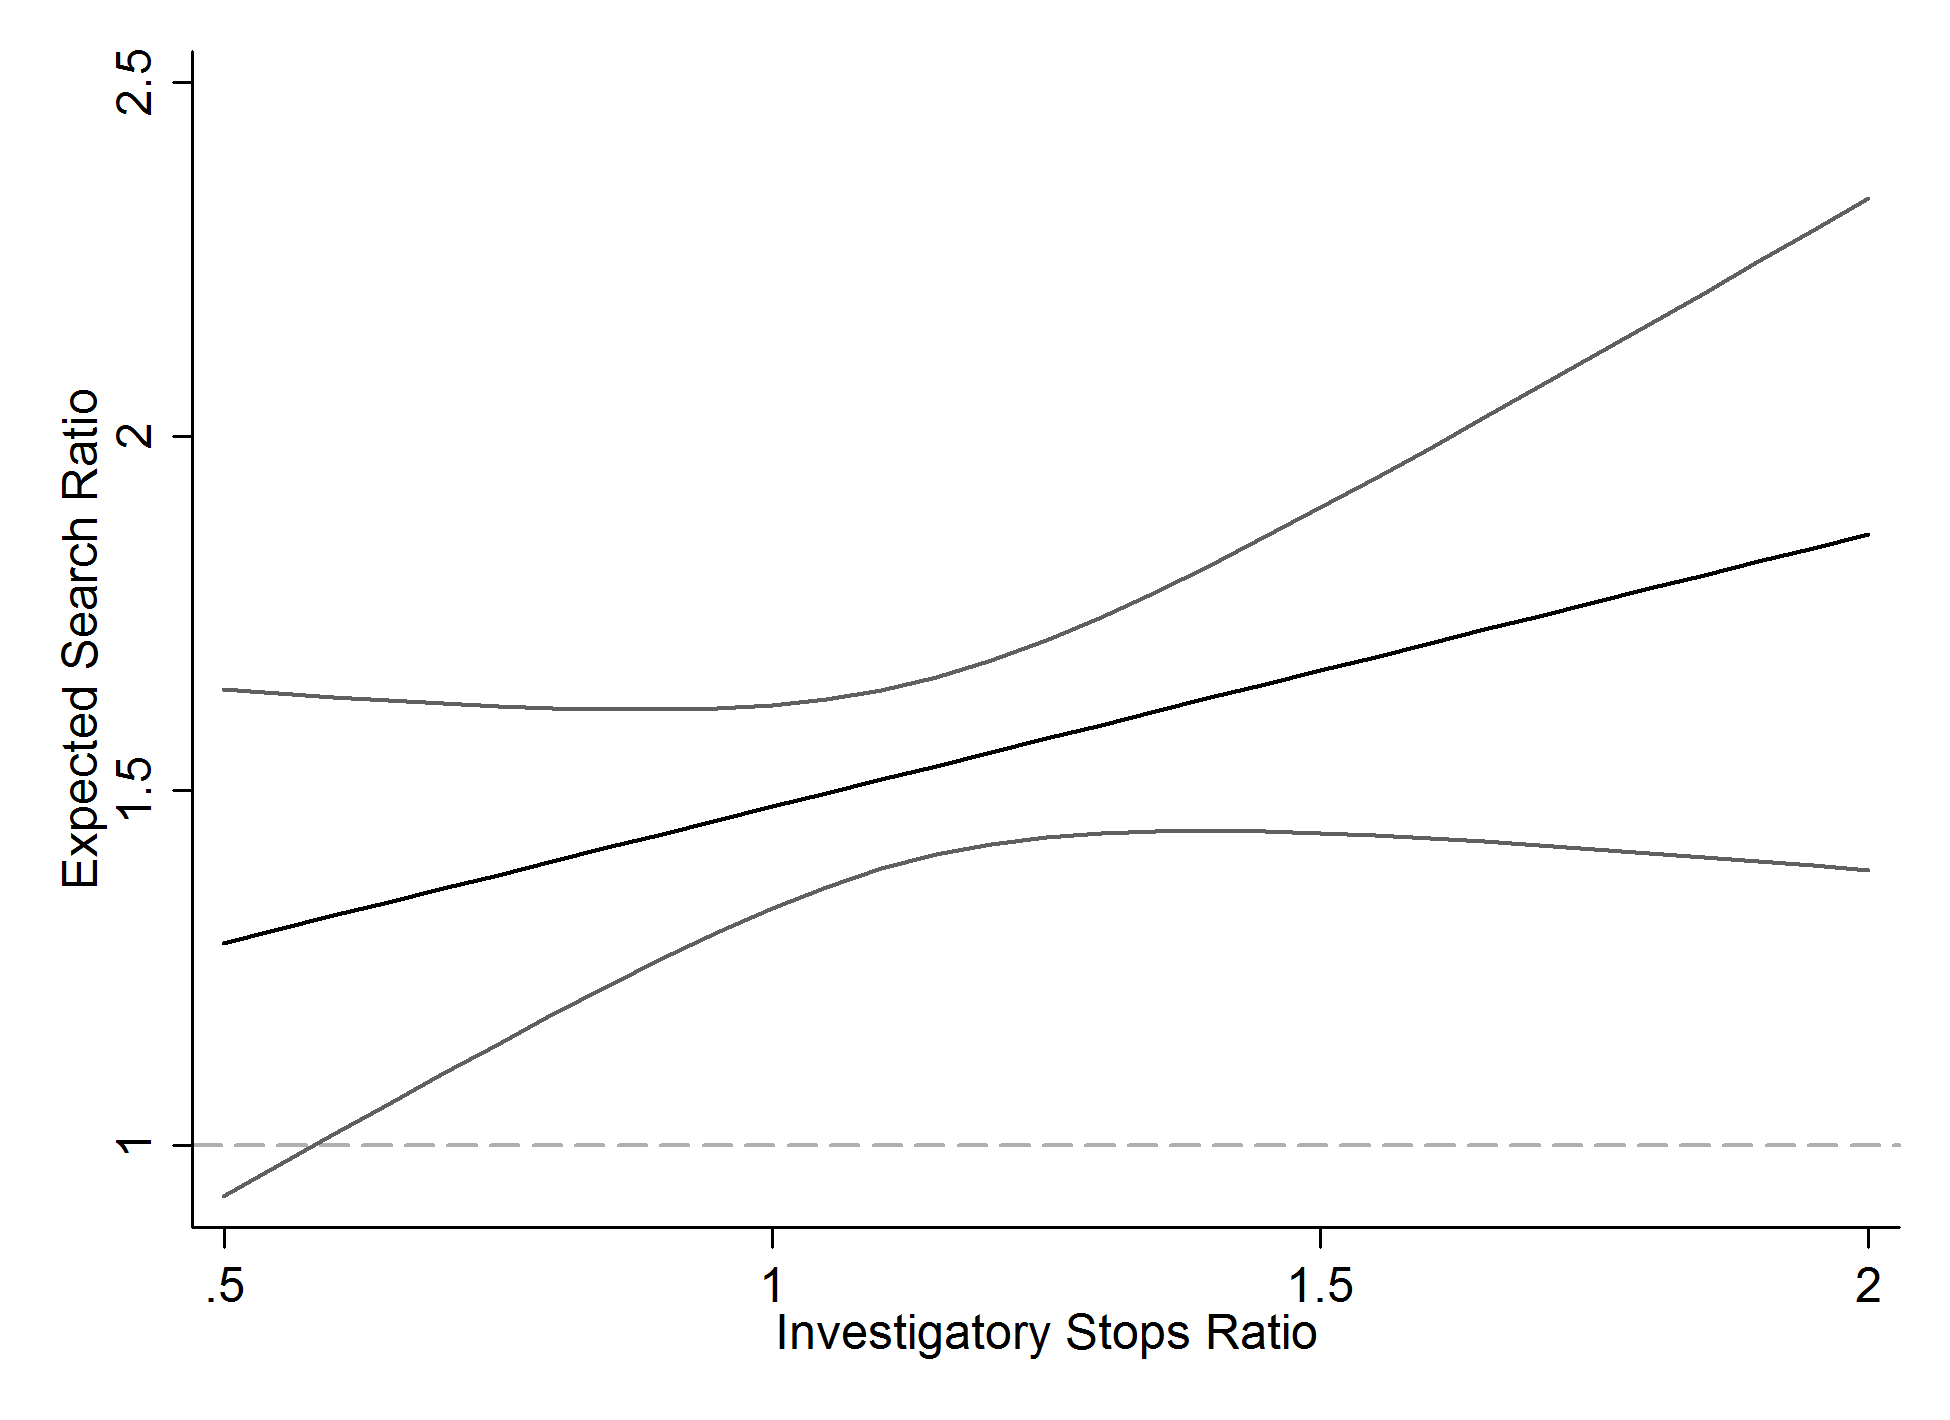
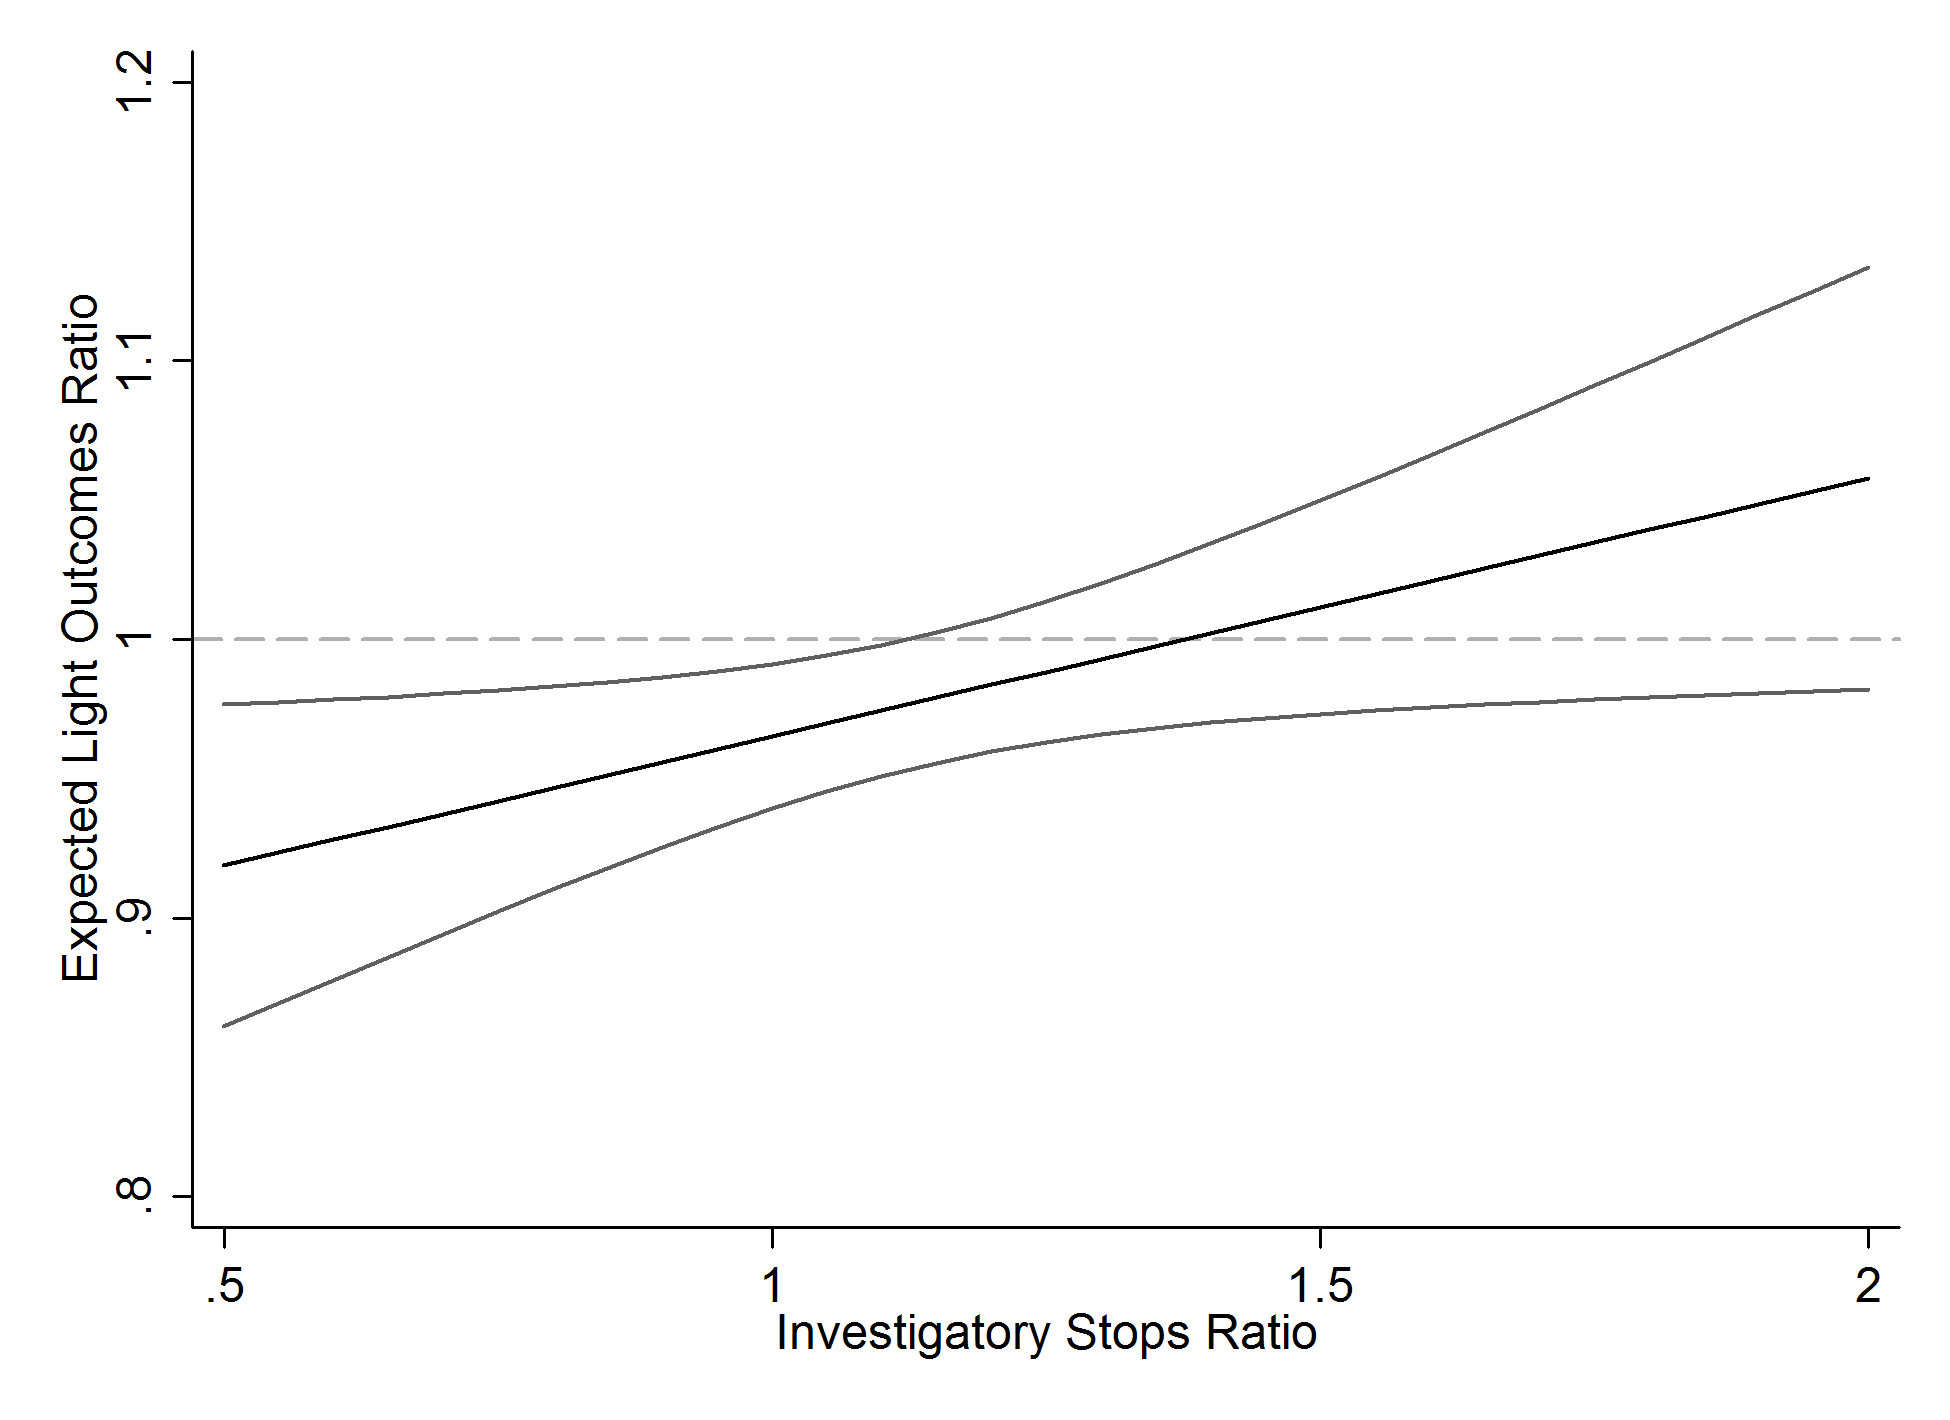
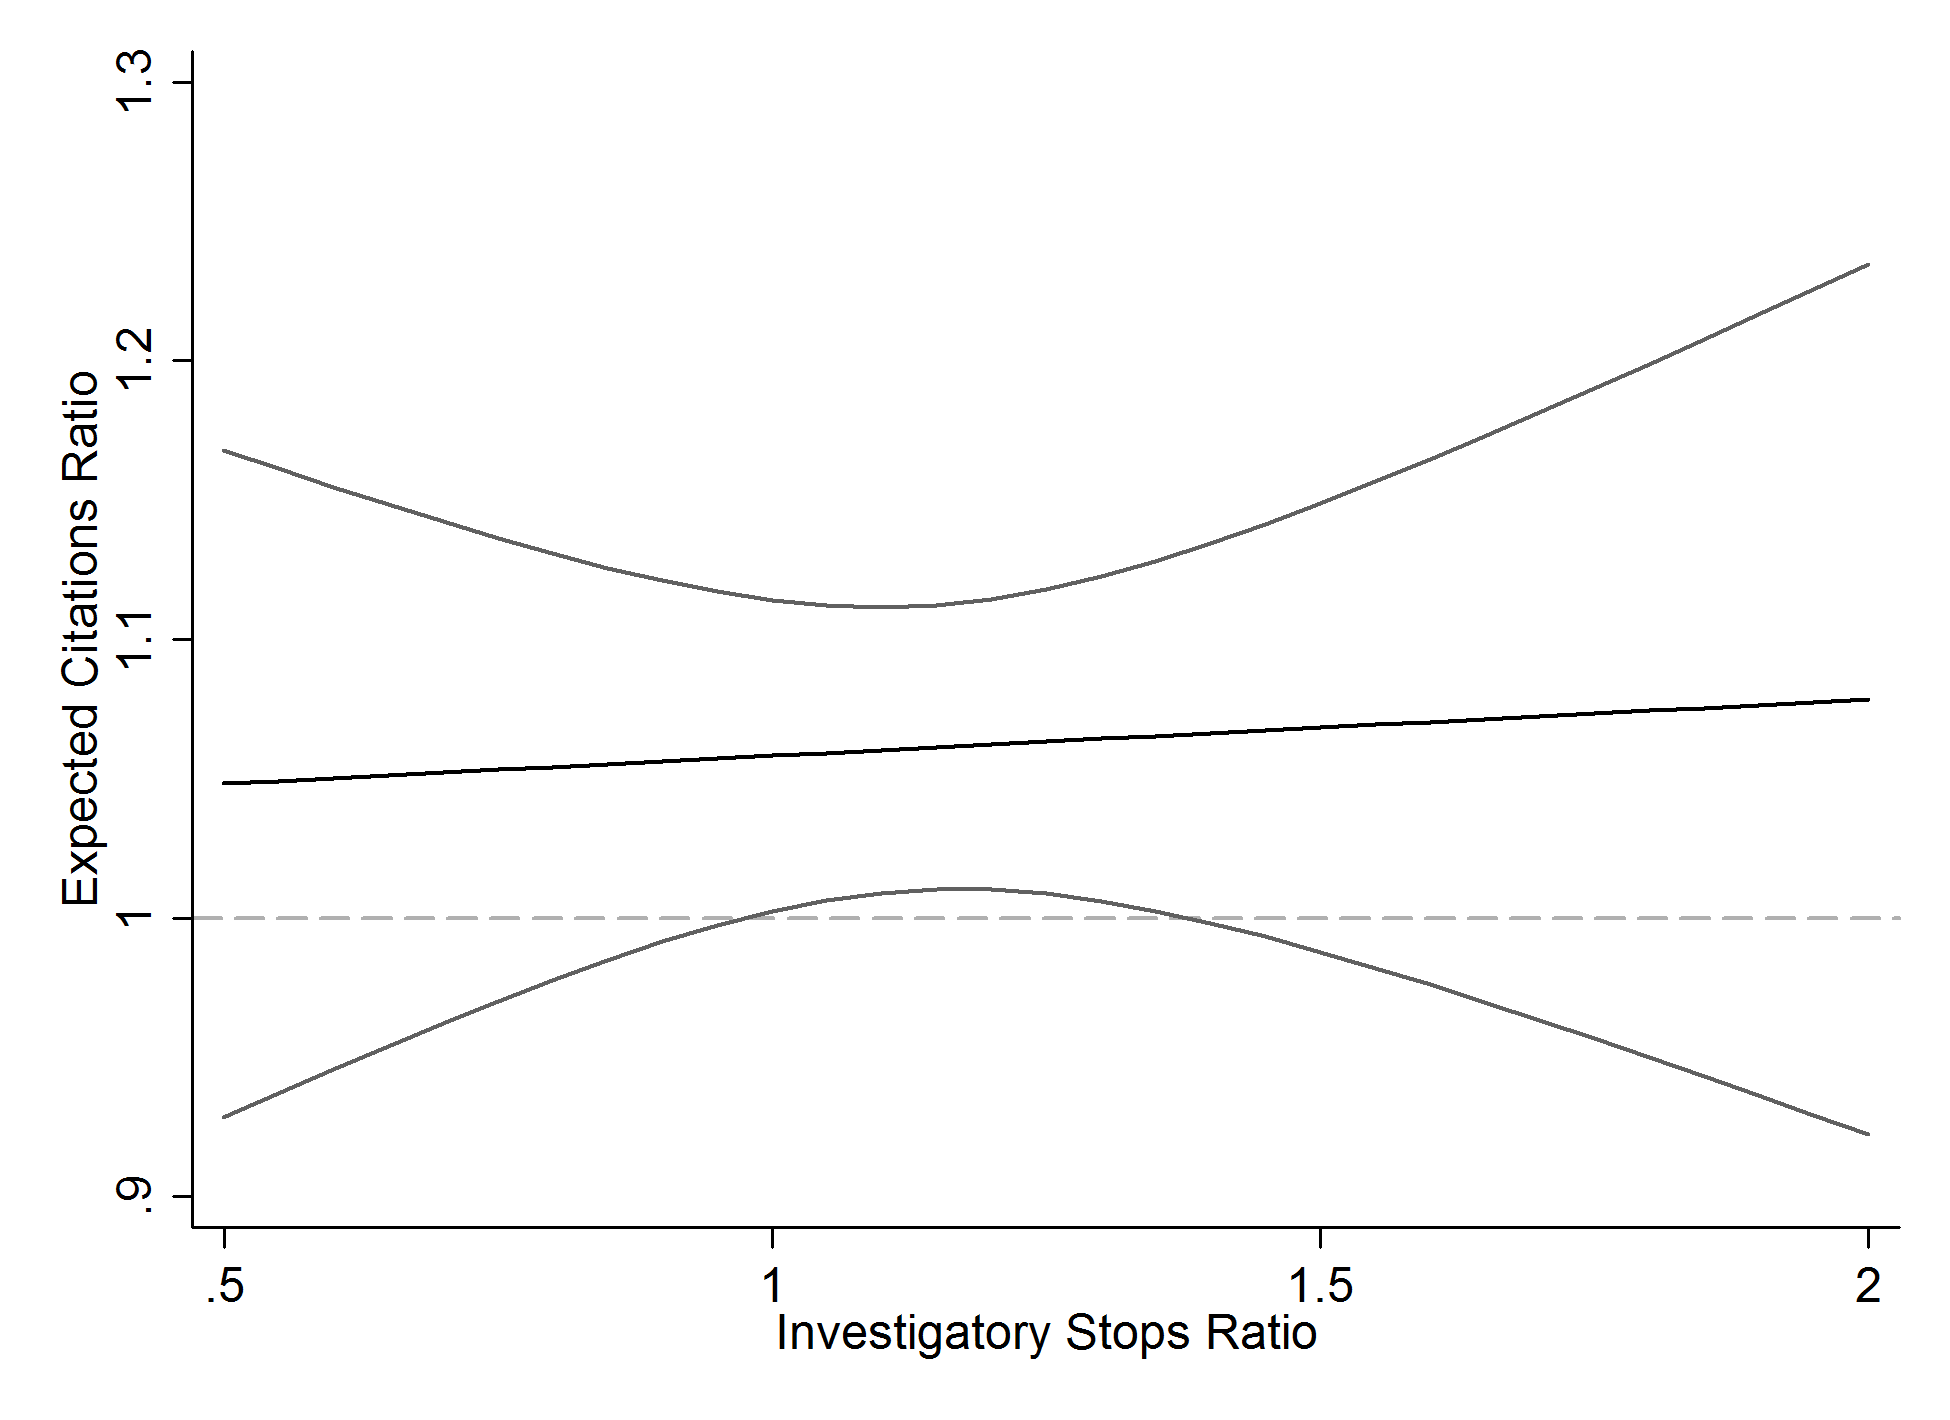
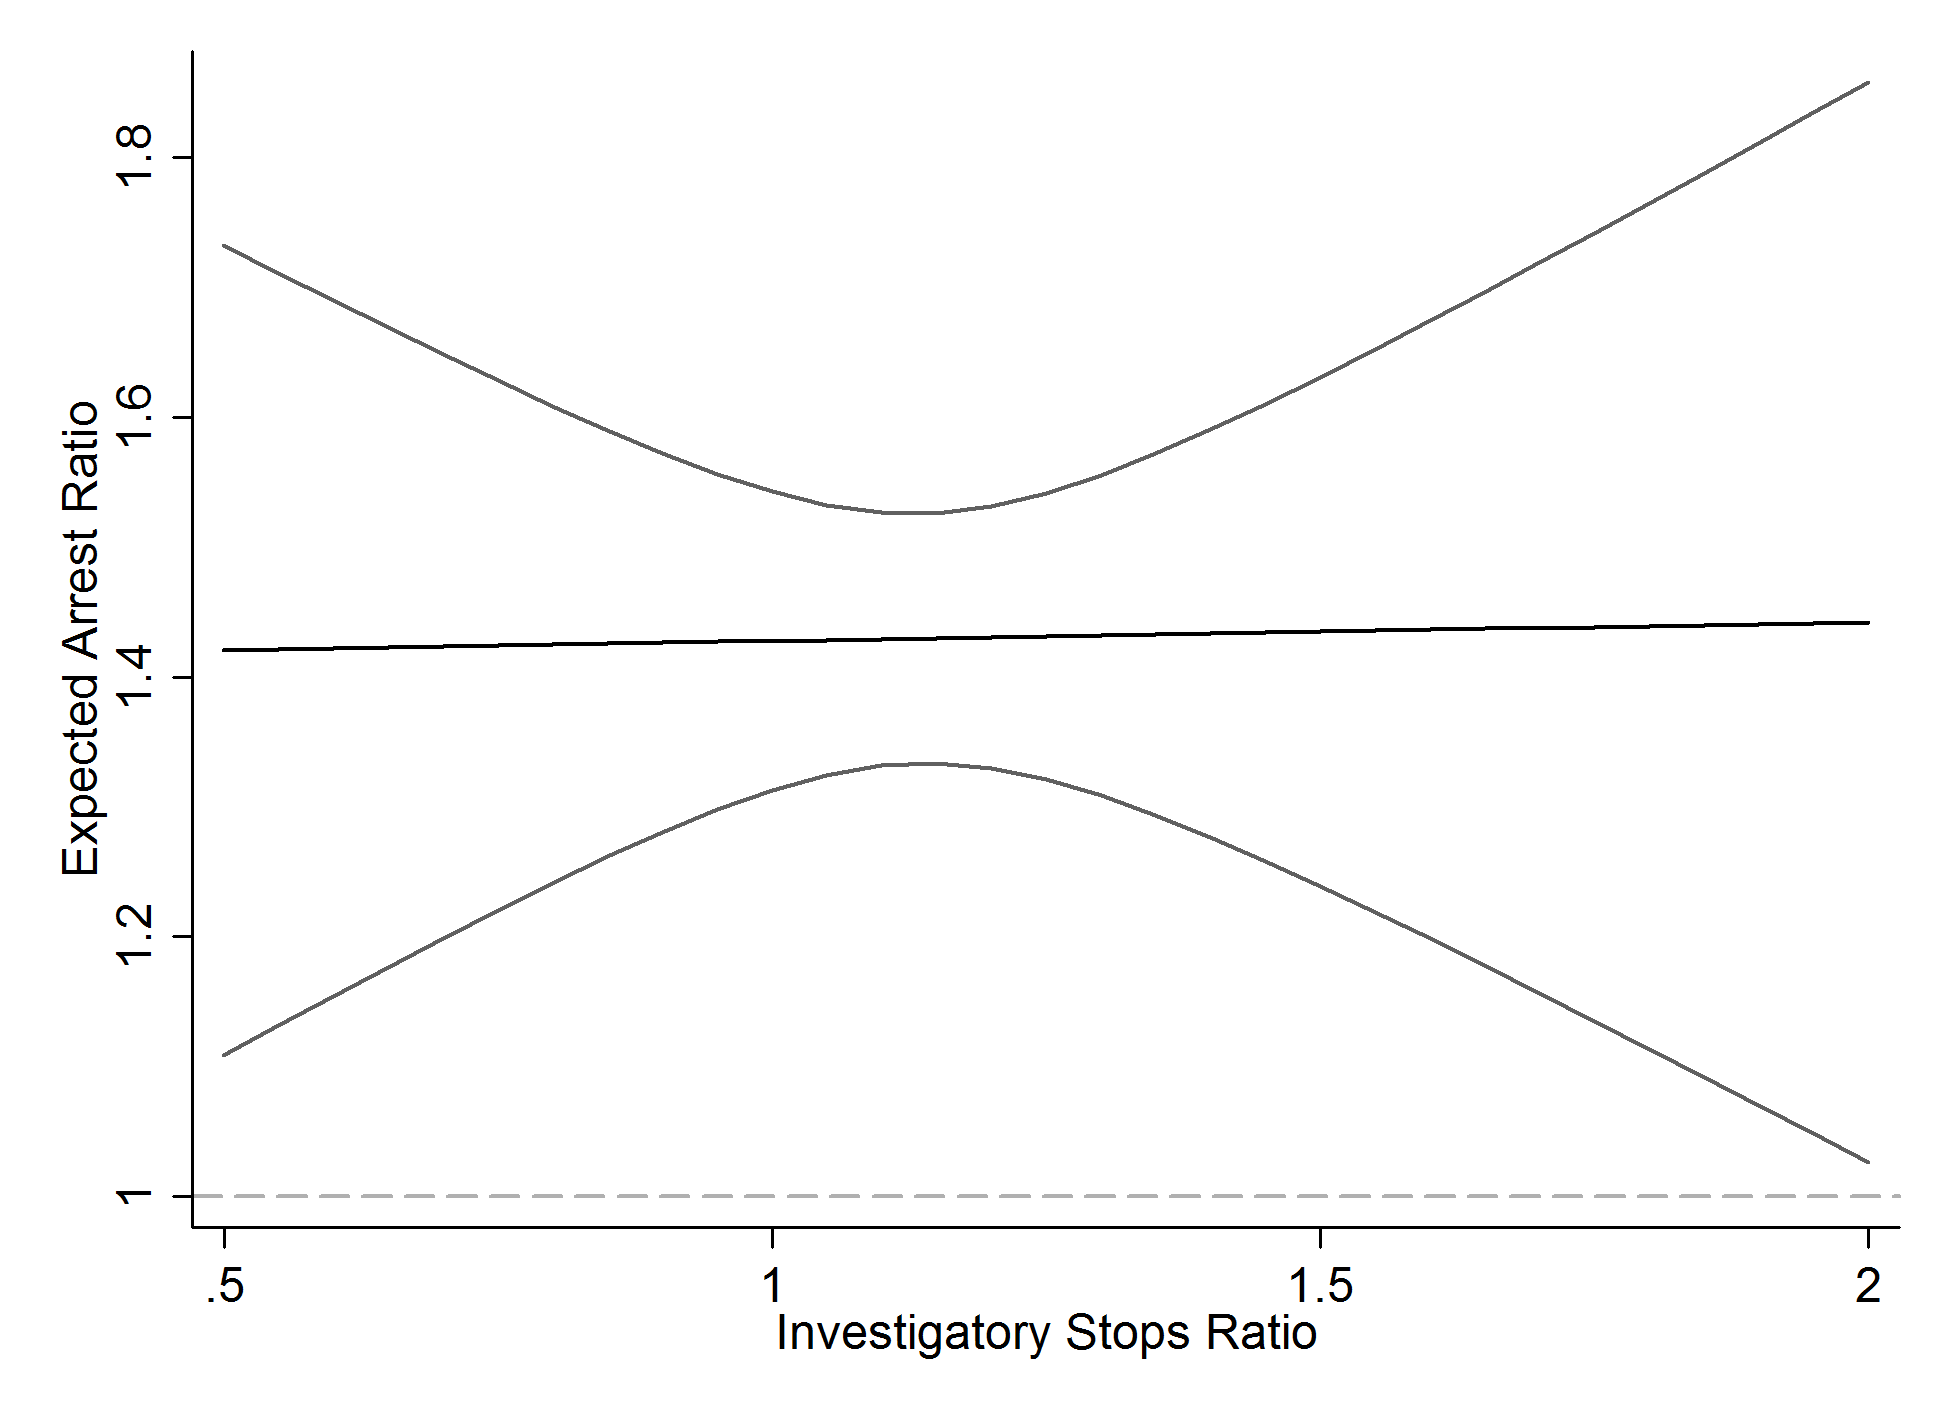
Figure 5.1a -- 5.1b -- 5.1c -- 5.1d -- 5.1e -- 5.1f -- 5.1g -- 5.1h -- 5.1i -- 5.2 -- 5.3a -- 5.3b -- 5.3c -- 5.3d -- 5.4a -- 5.4b -- 5.5a -- 5.5b -- 5A.1 -- 5A.2a -- 5A.2b -- 5A.2c -- 5A.2d
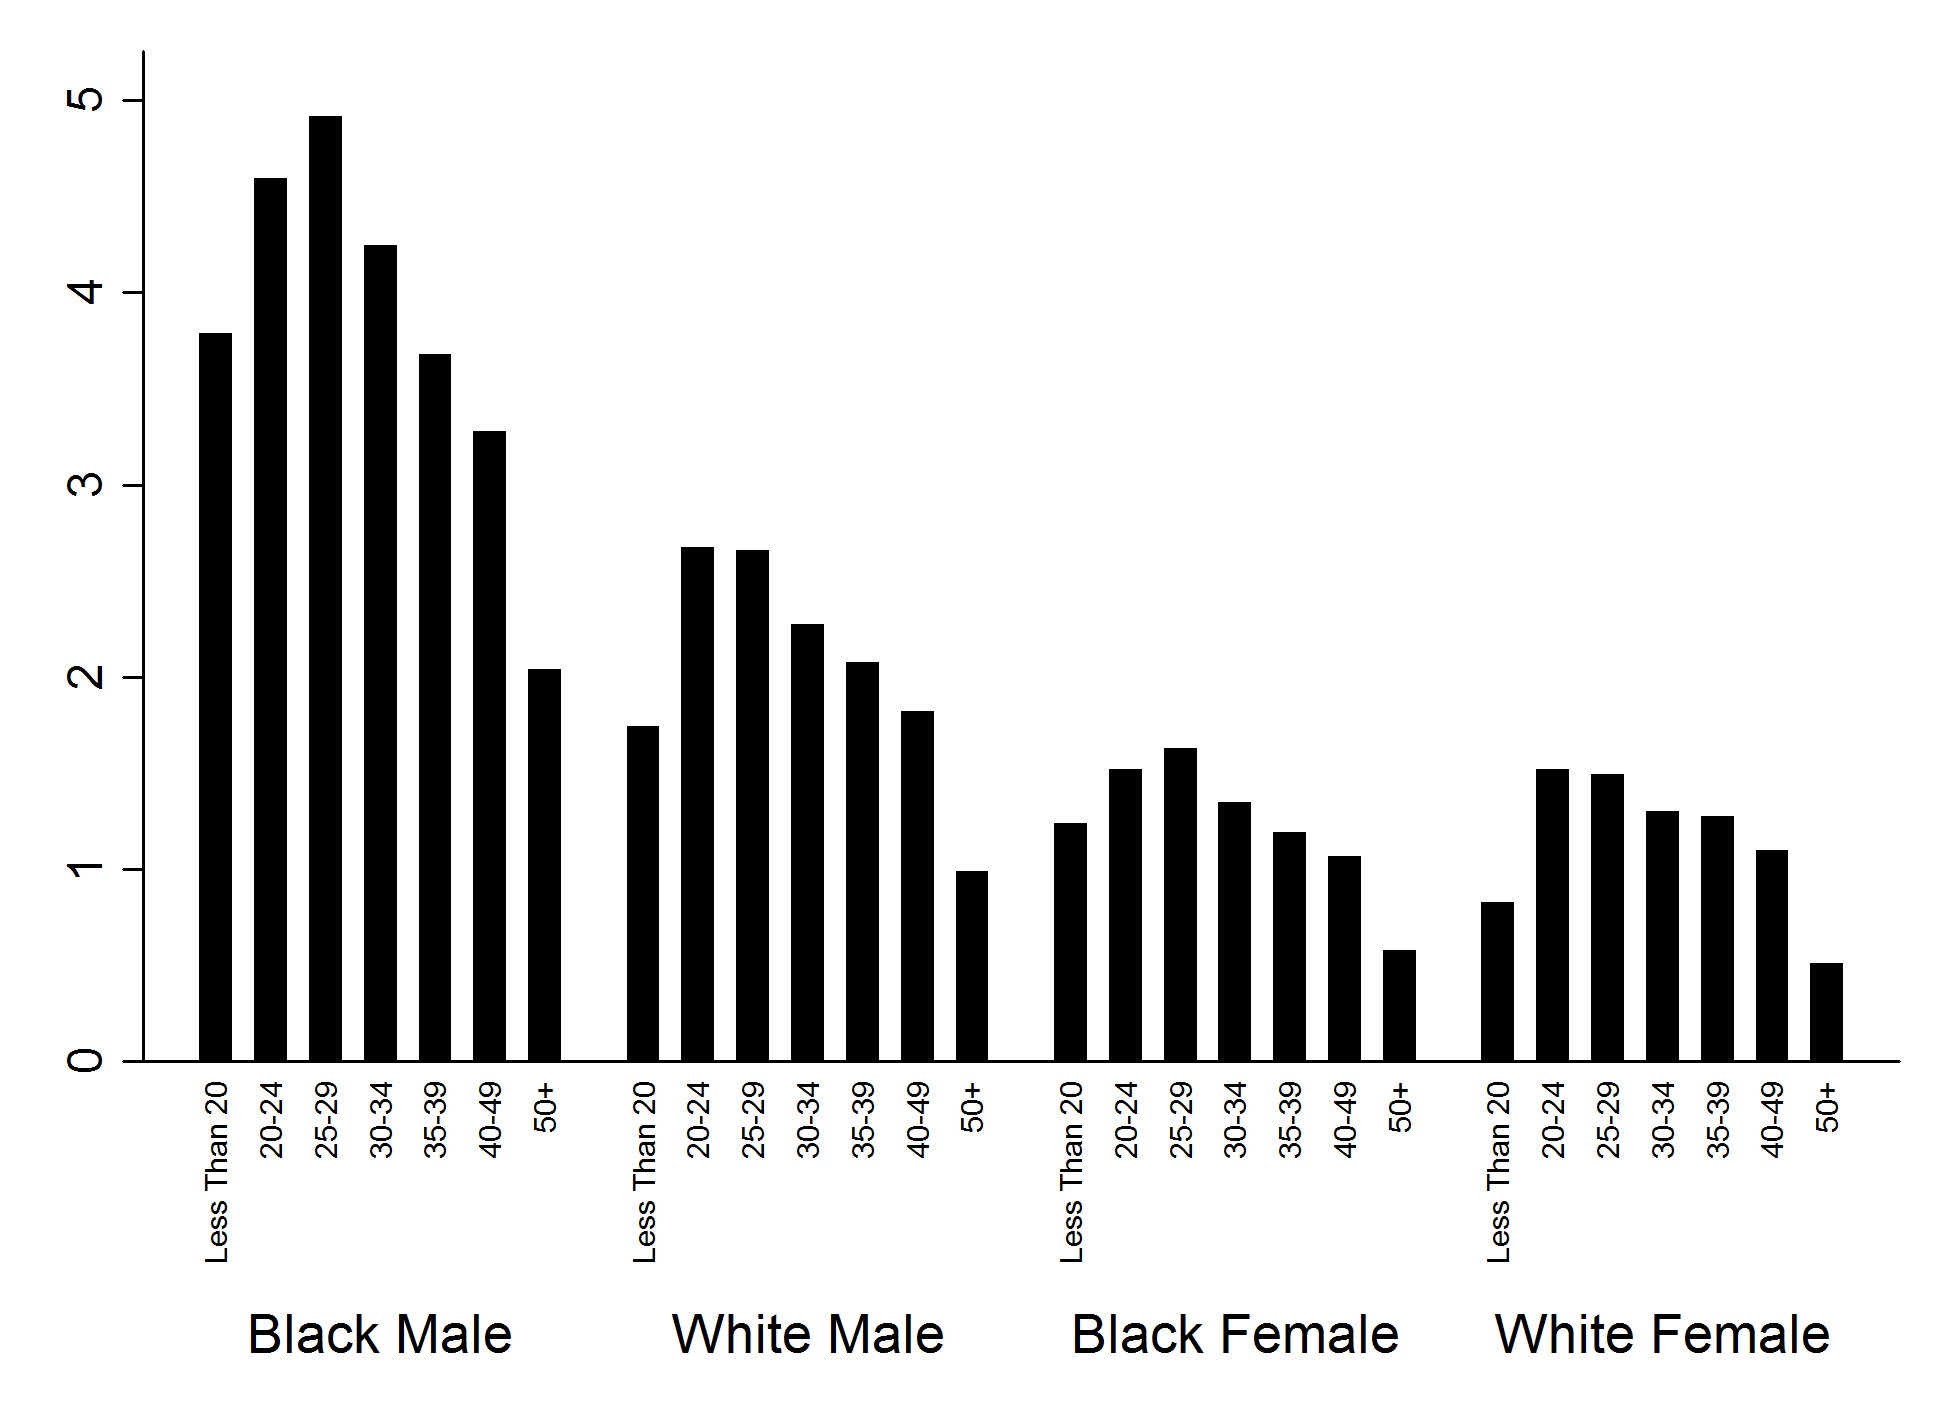
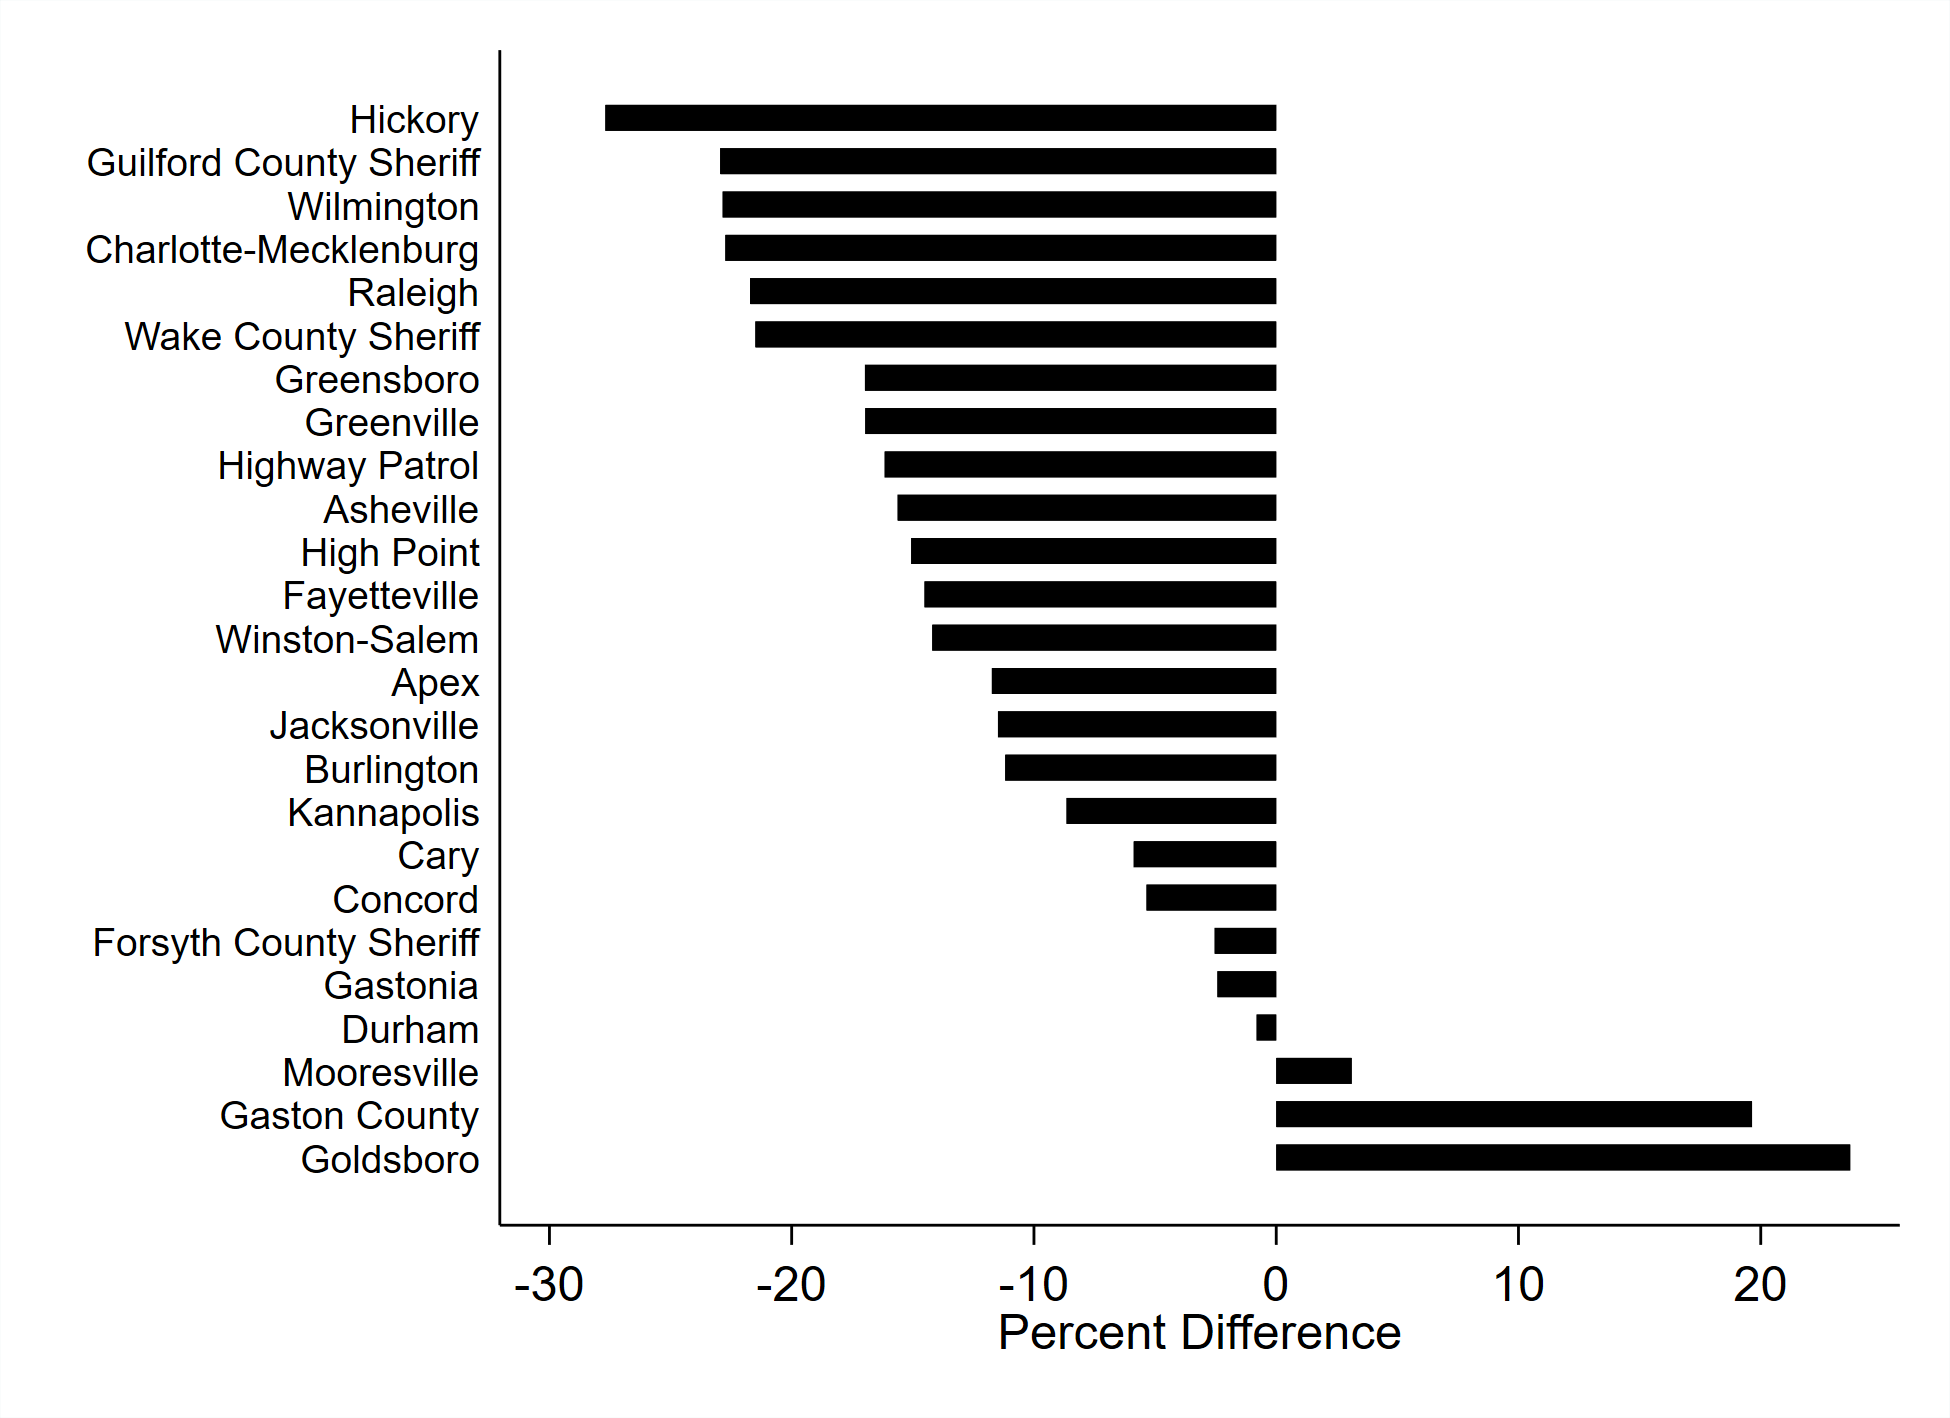
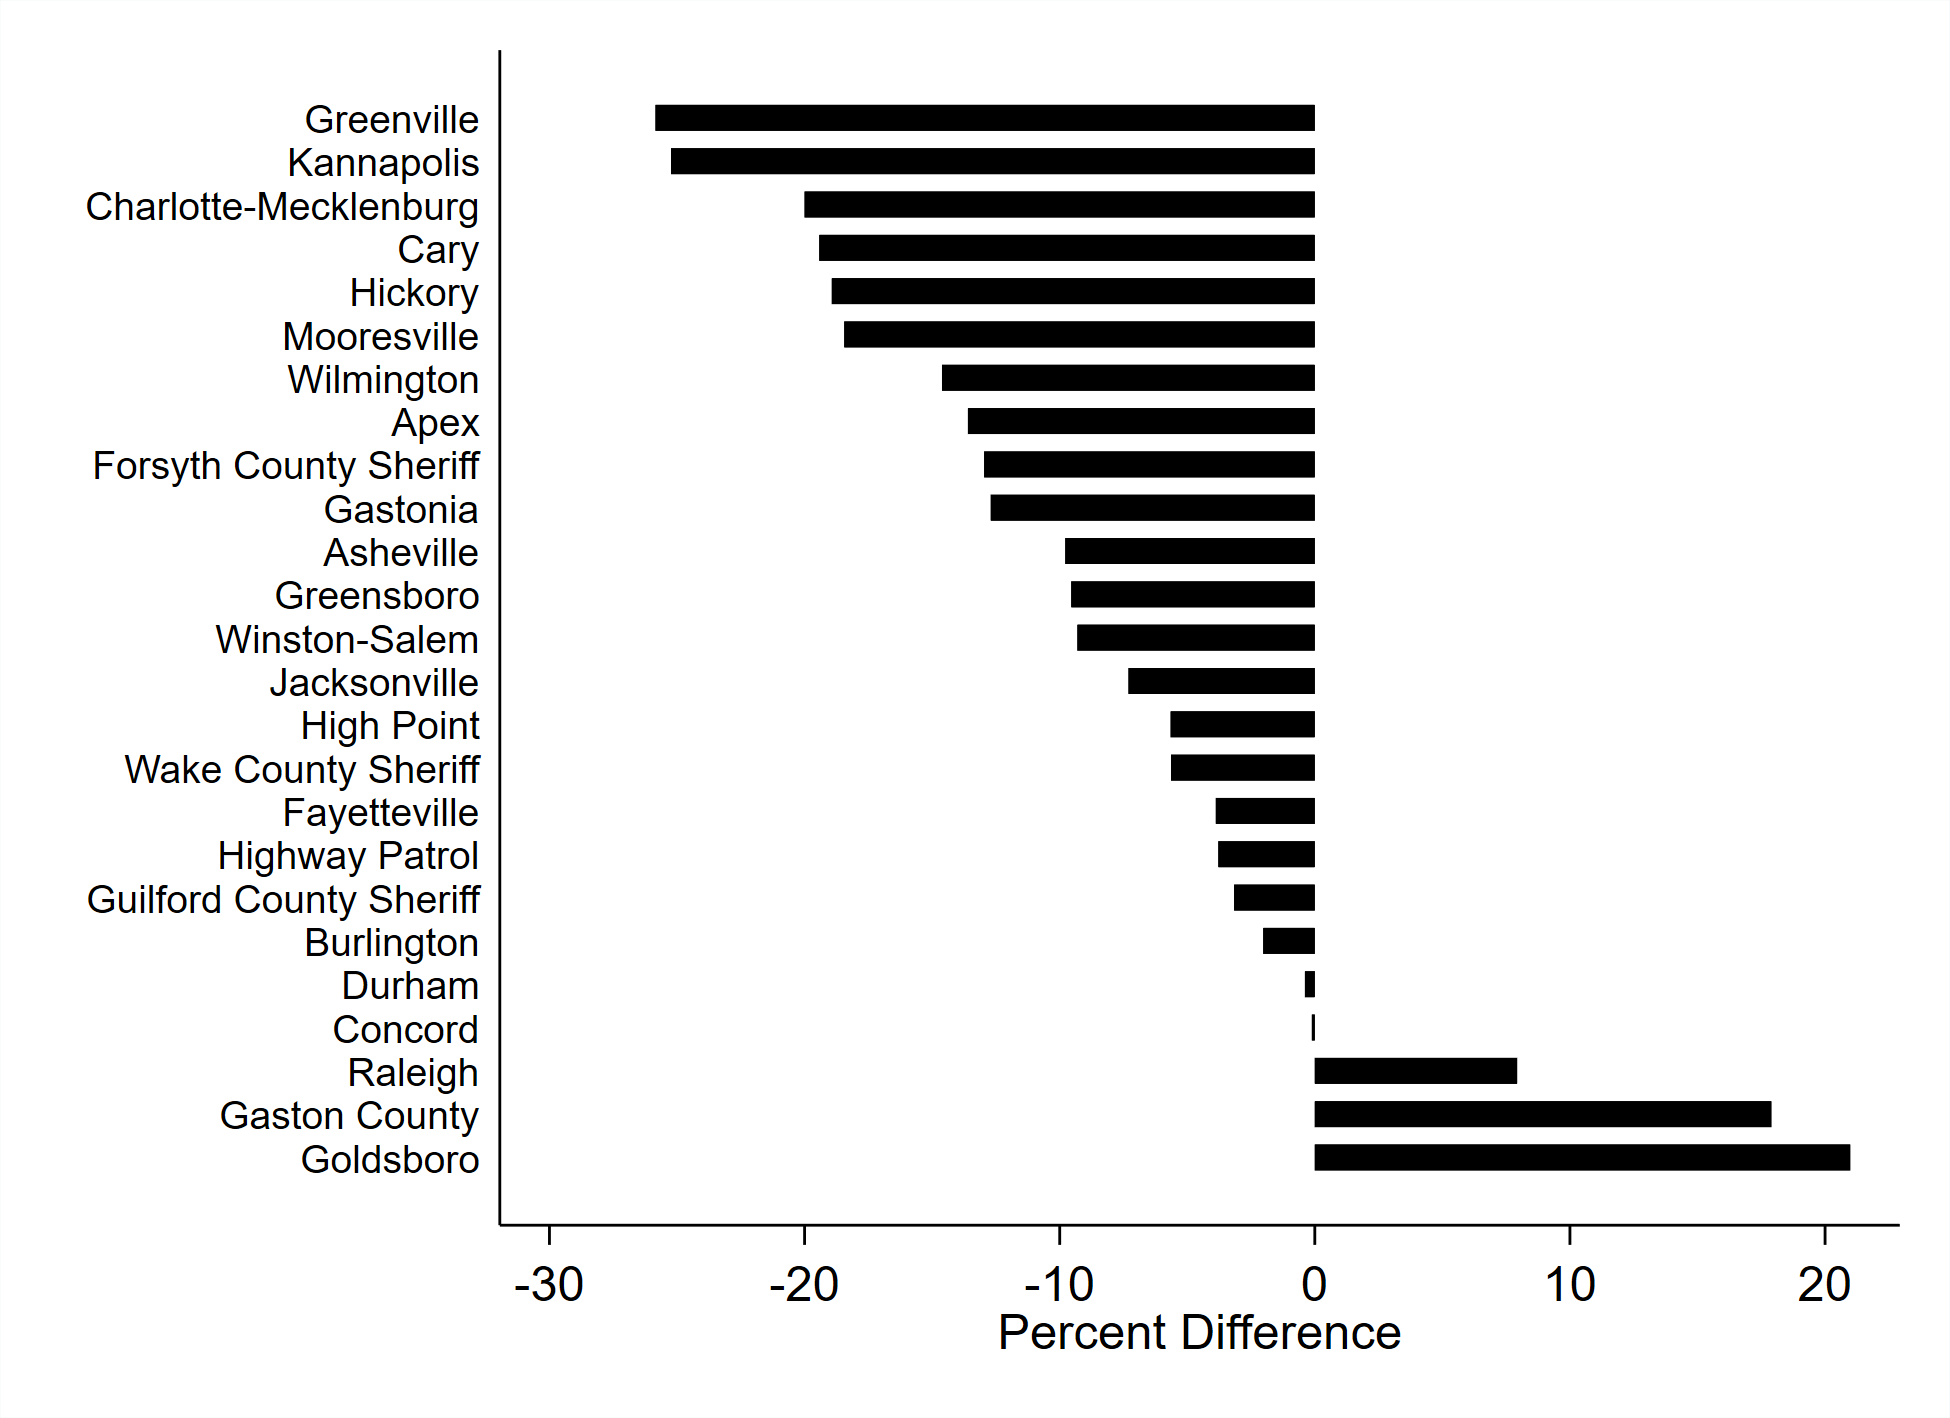
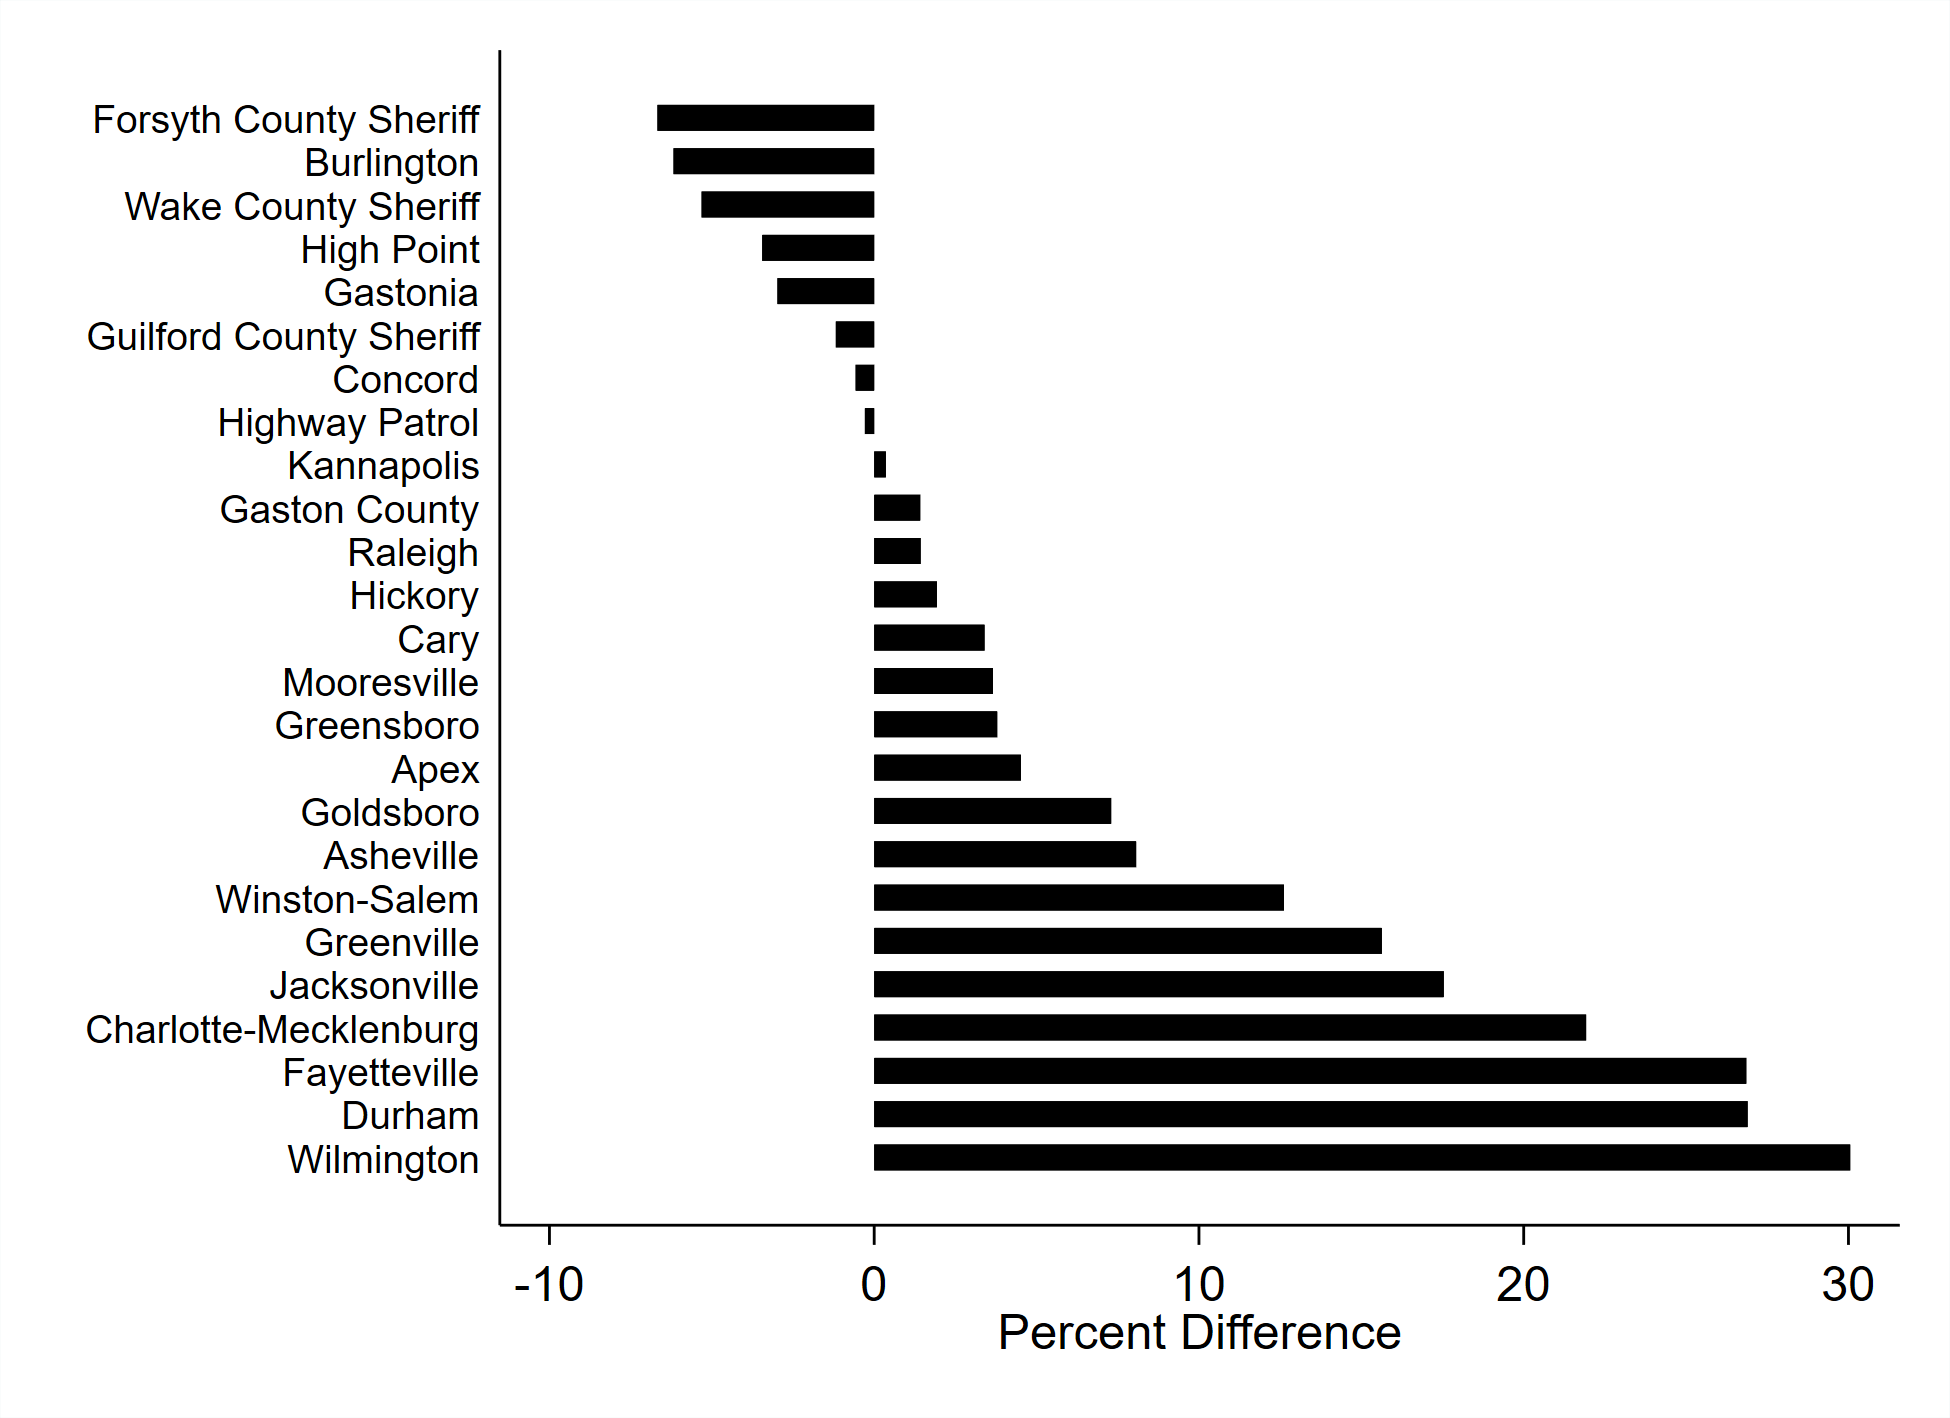
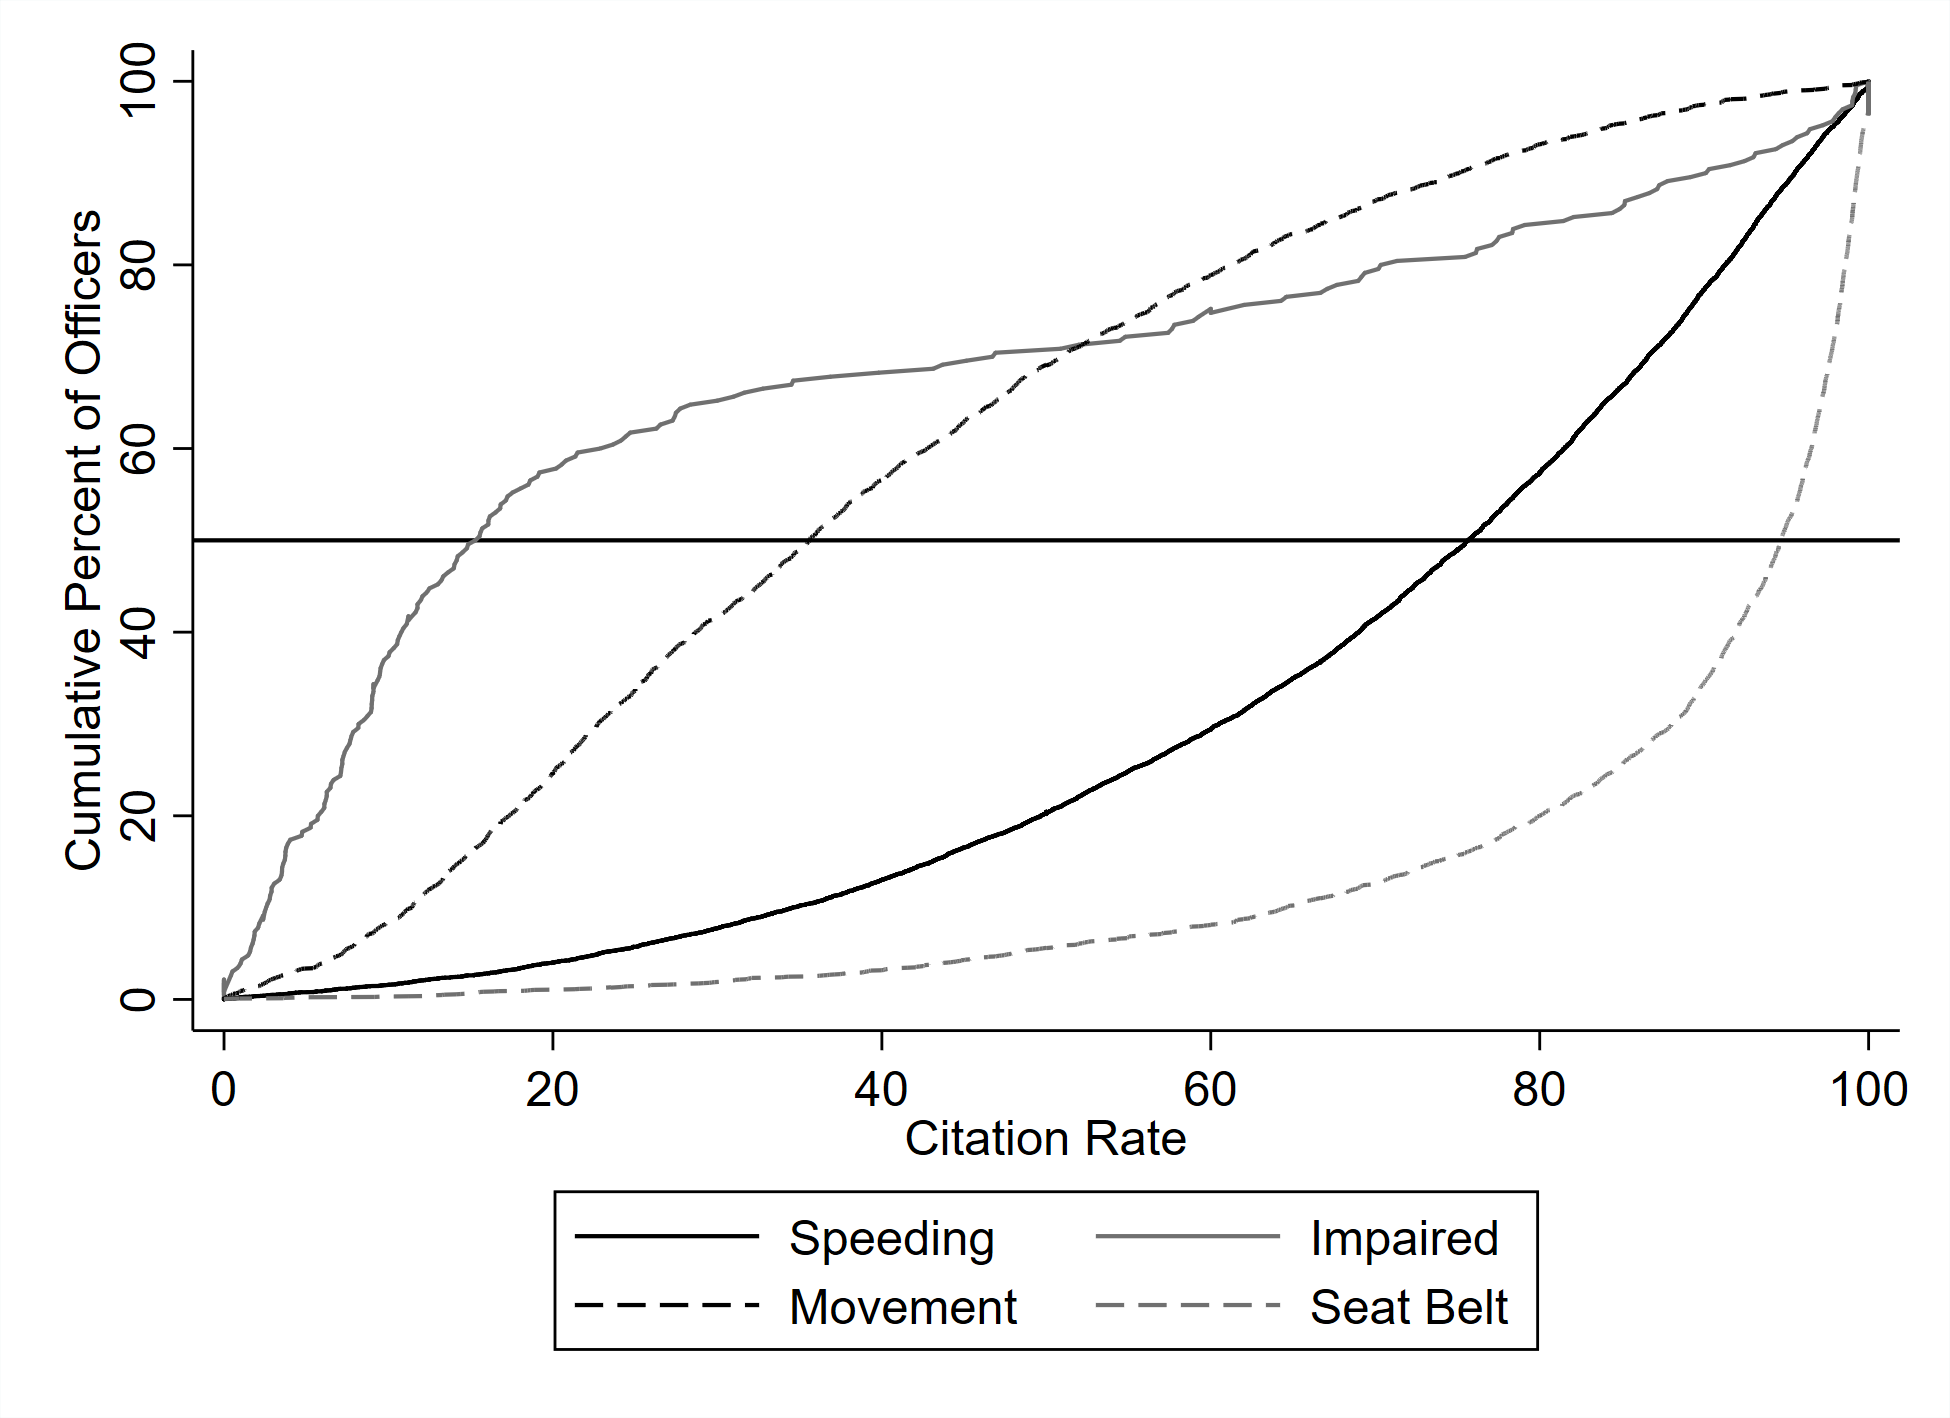
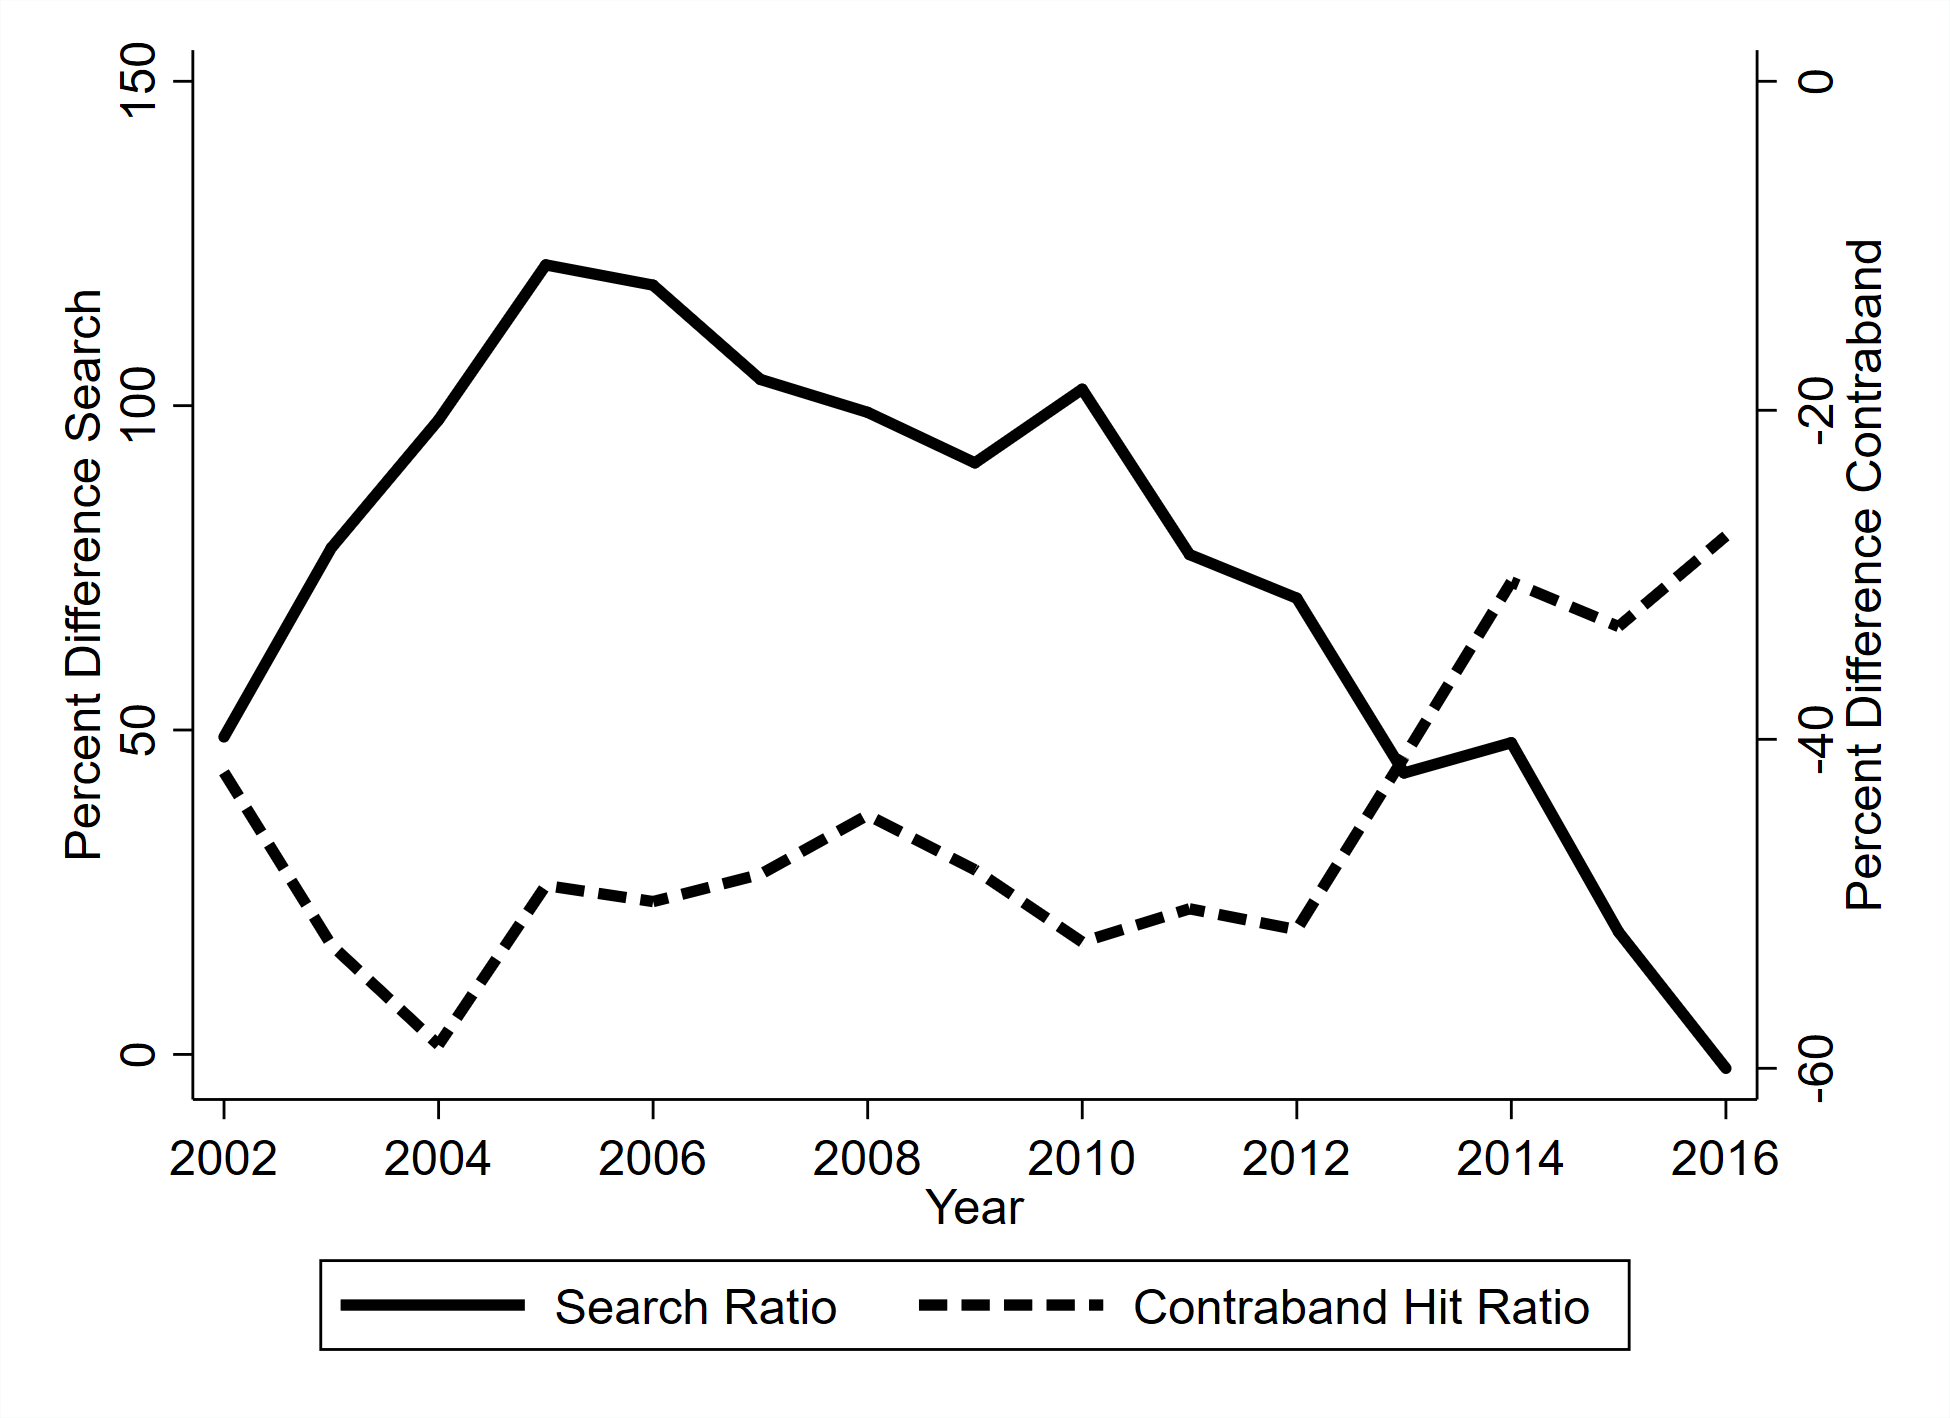
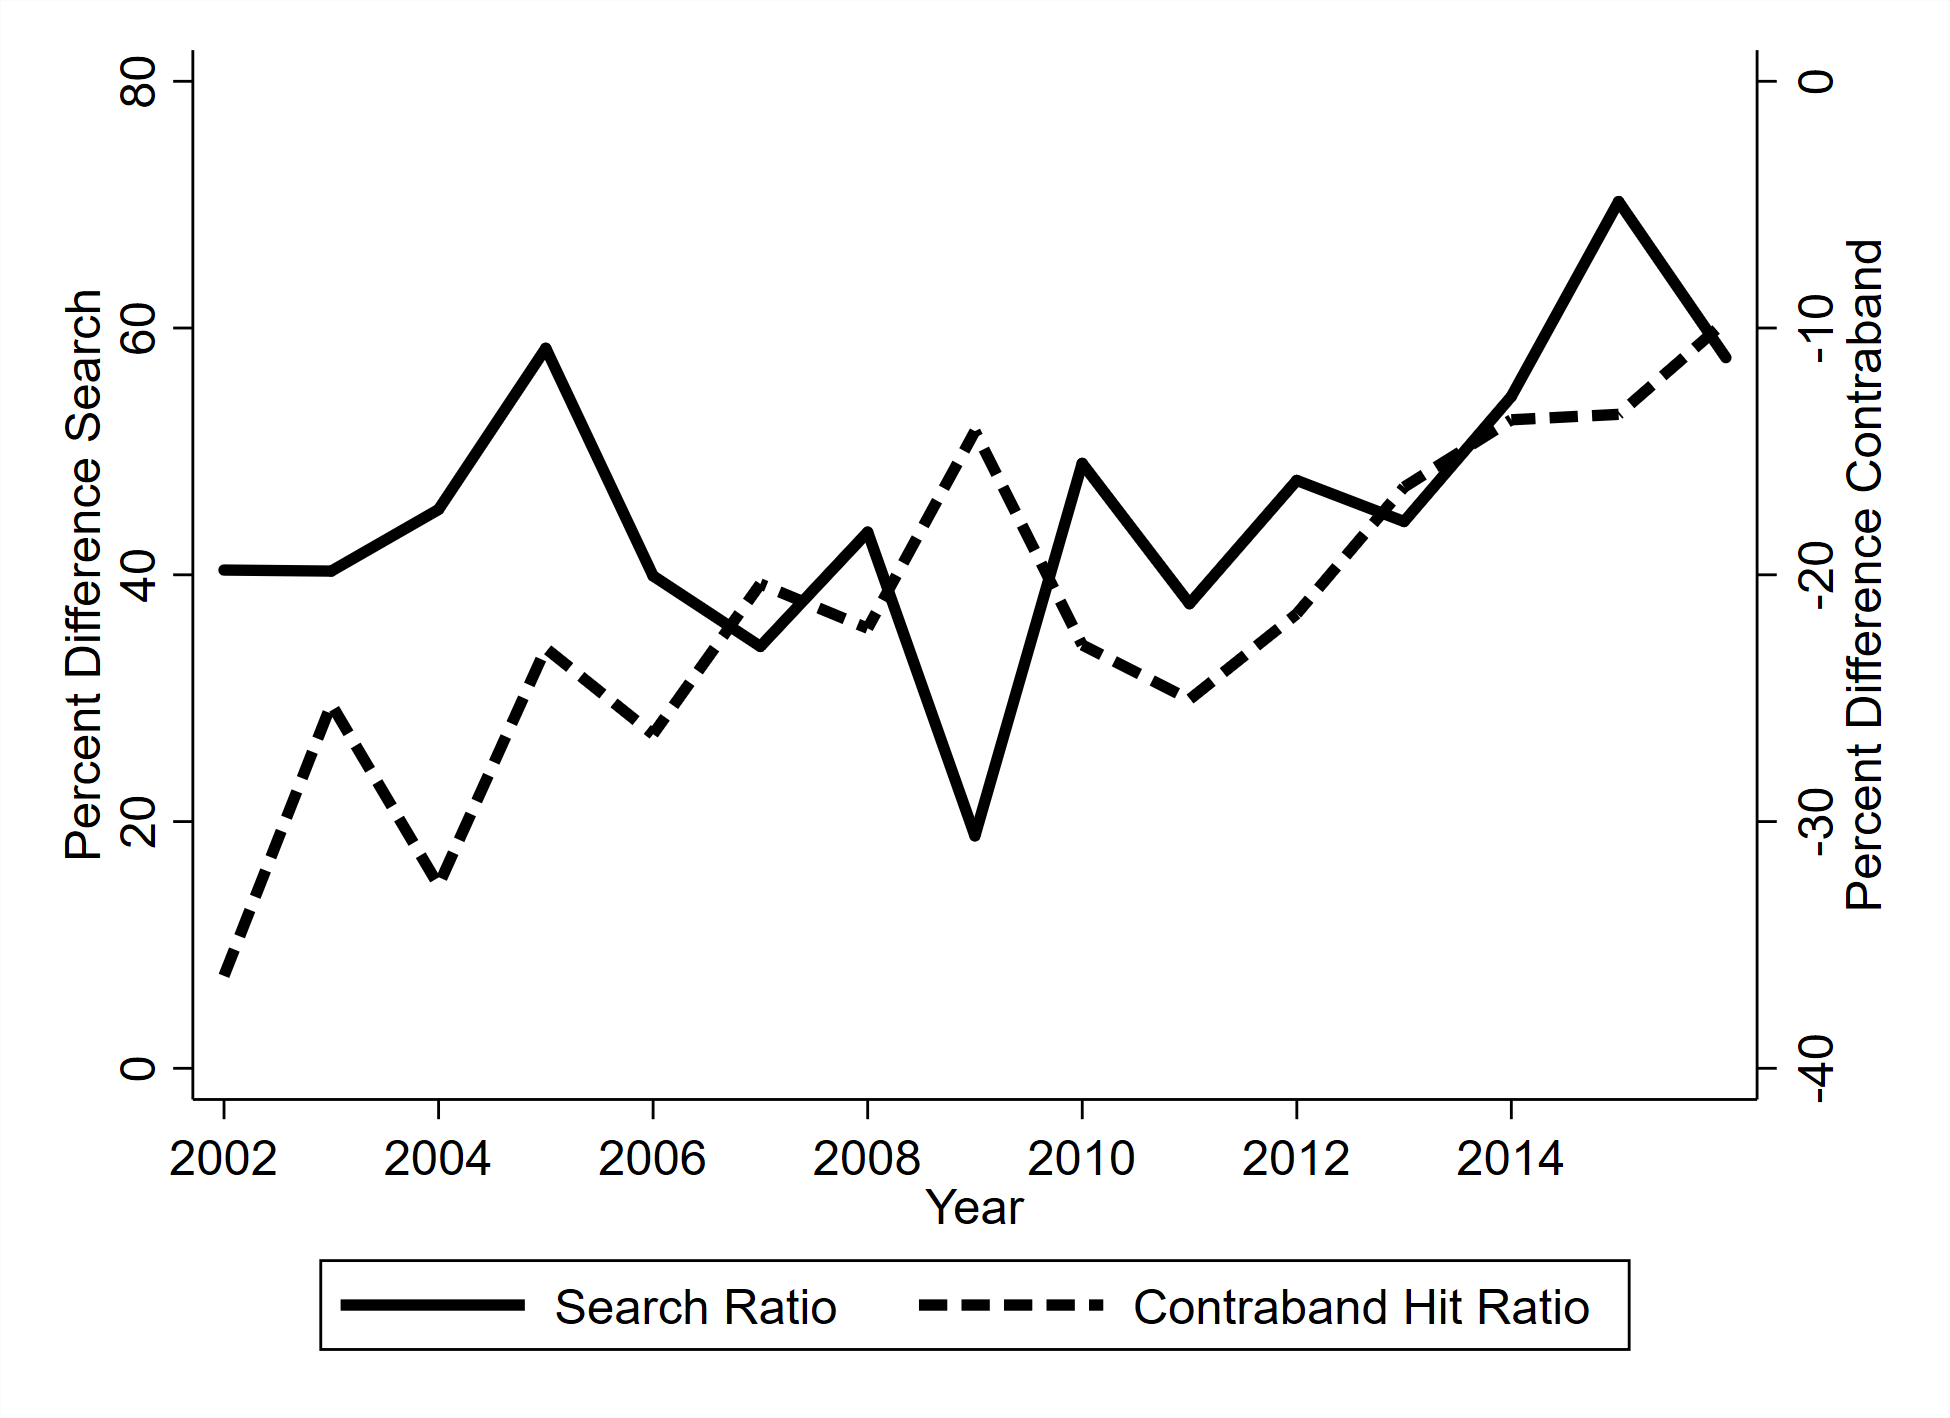
Figure 6.1a -- 6.1b -- 6.1c -- 6.1d -- 6.2 -- 6.3a -- 6.3b -- 6.4a -- 6.4b -- 6.5 -- 6.6a -- 6.6b -- 6.7a -- 6.7b -- 6.7c -- 6.7d -- 6.8a -- 6.8b -- 6.9
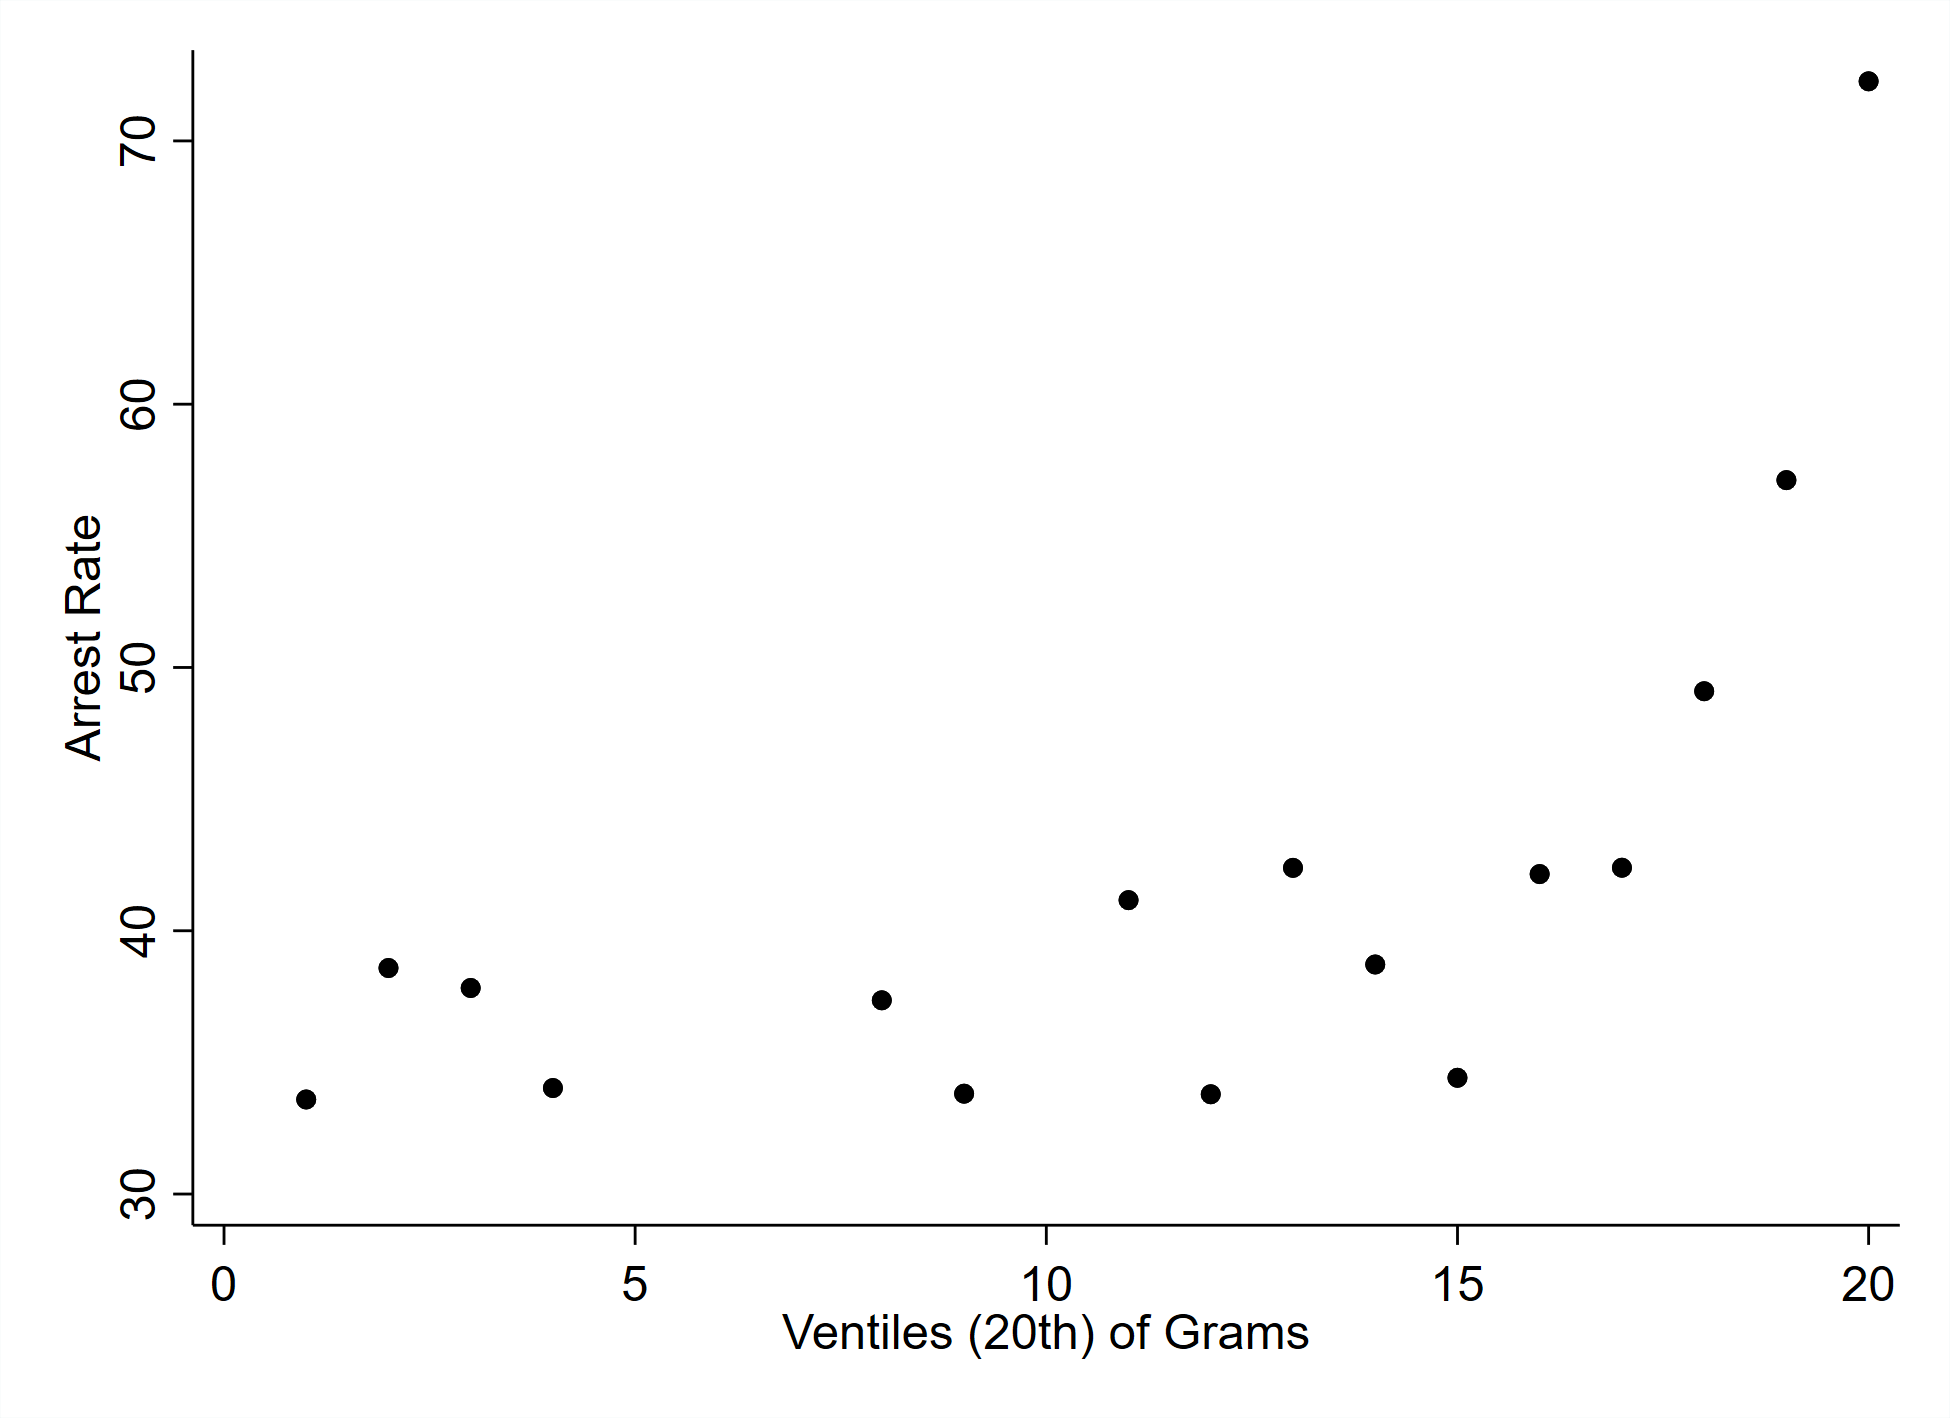
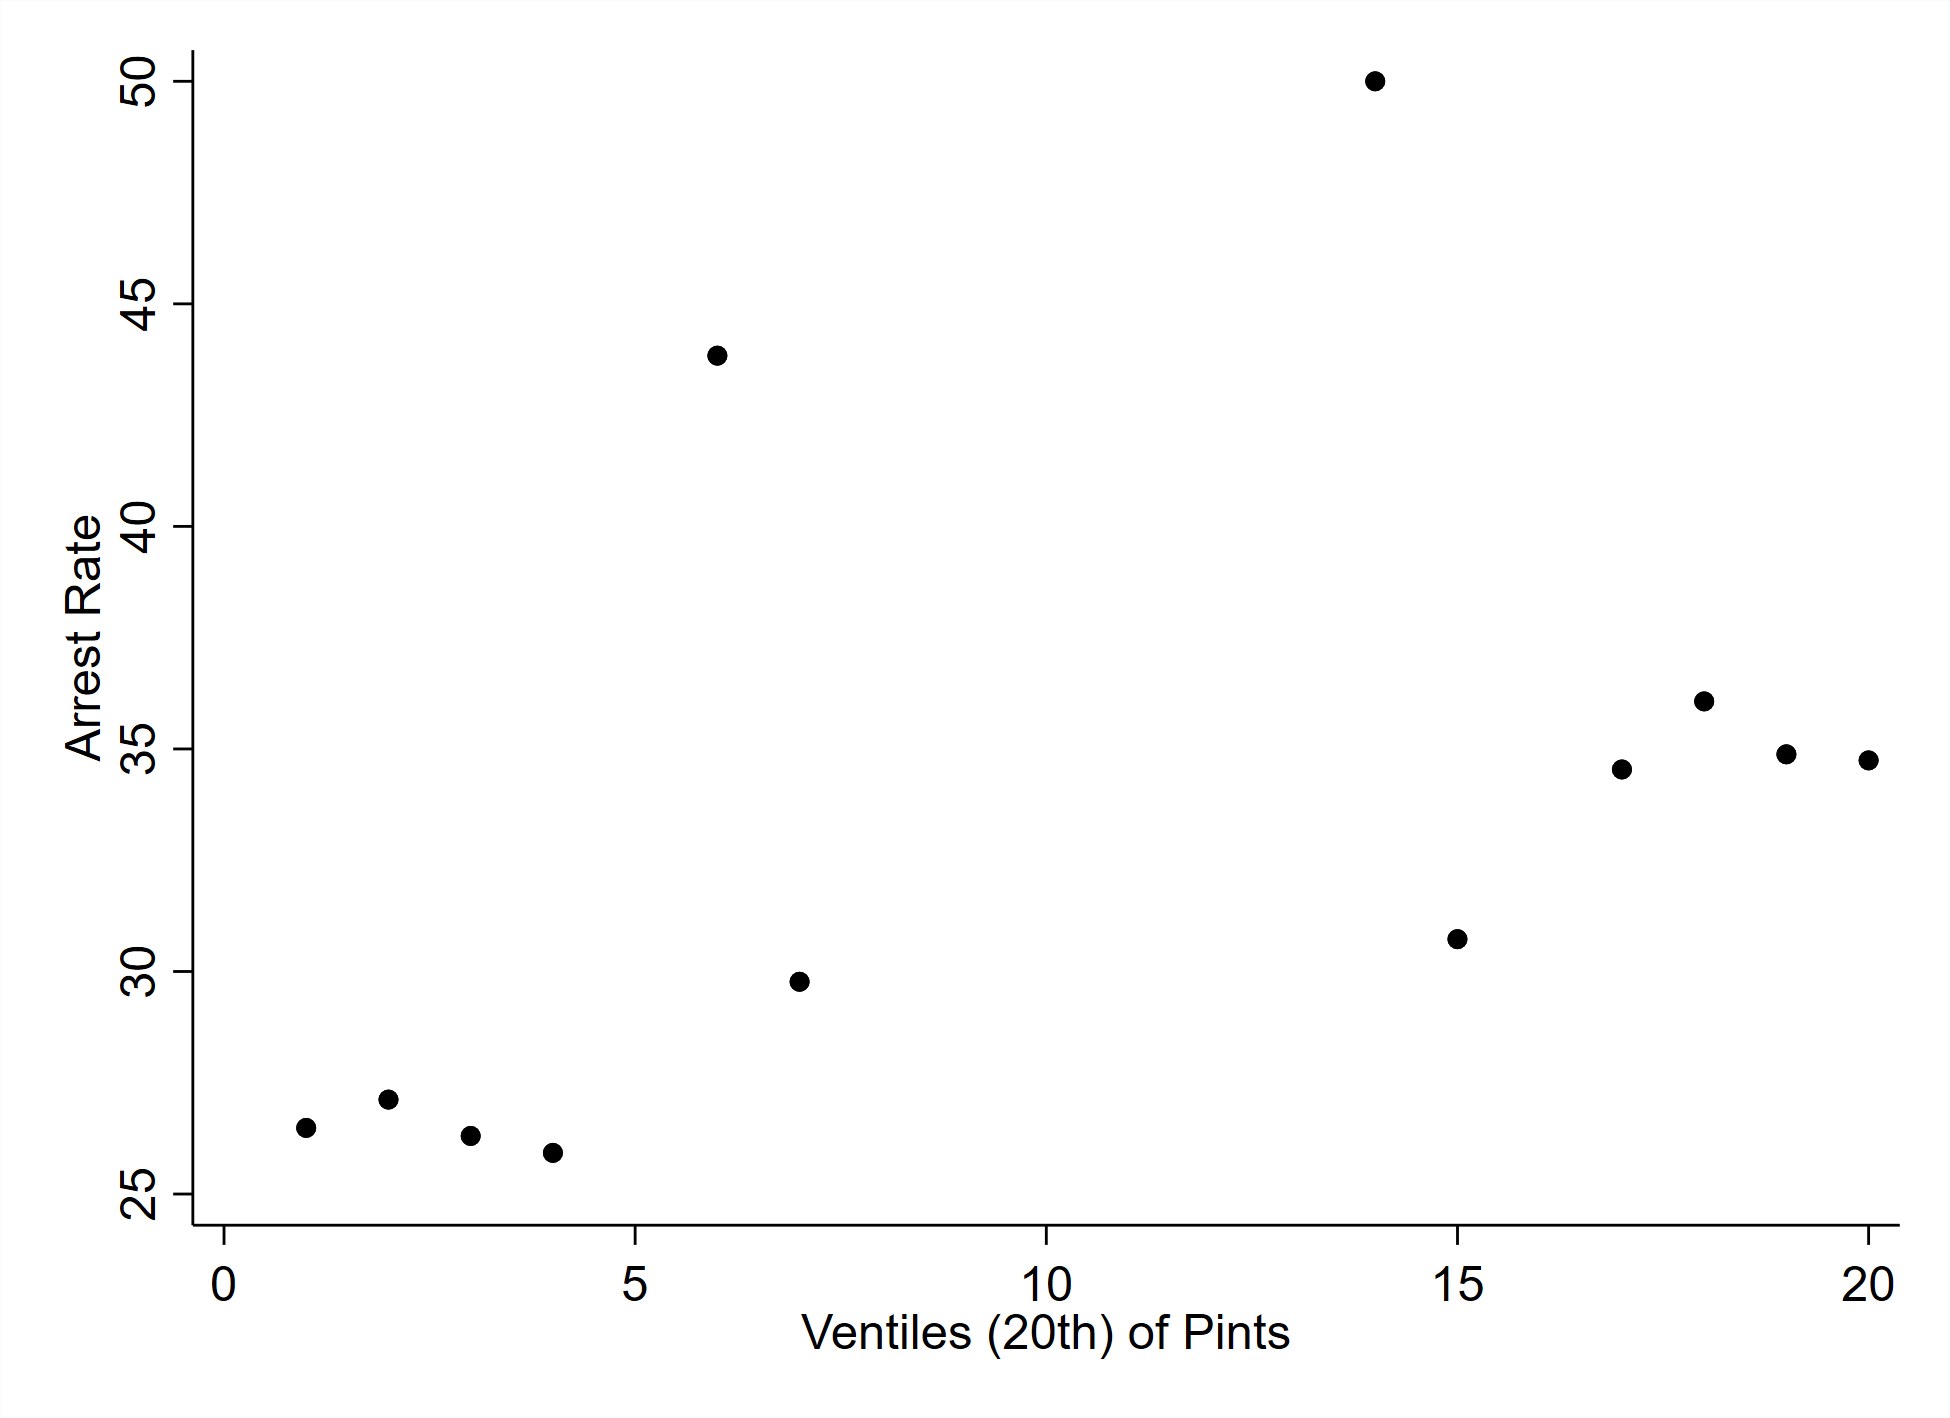
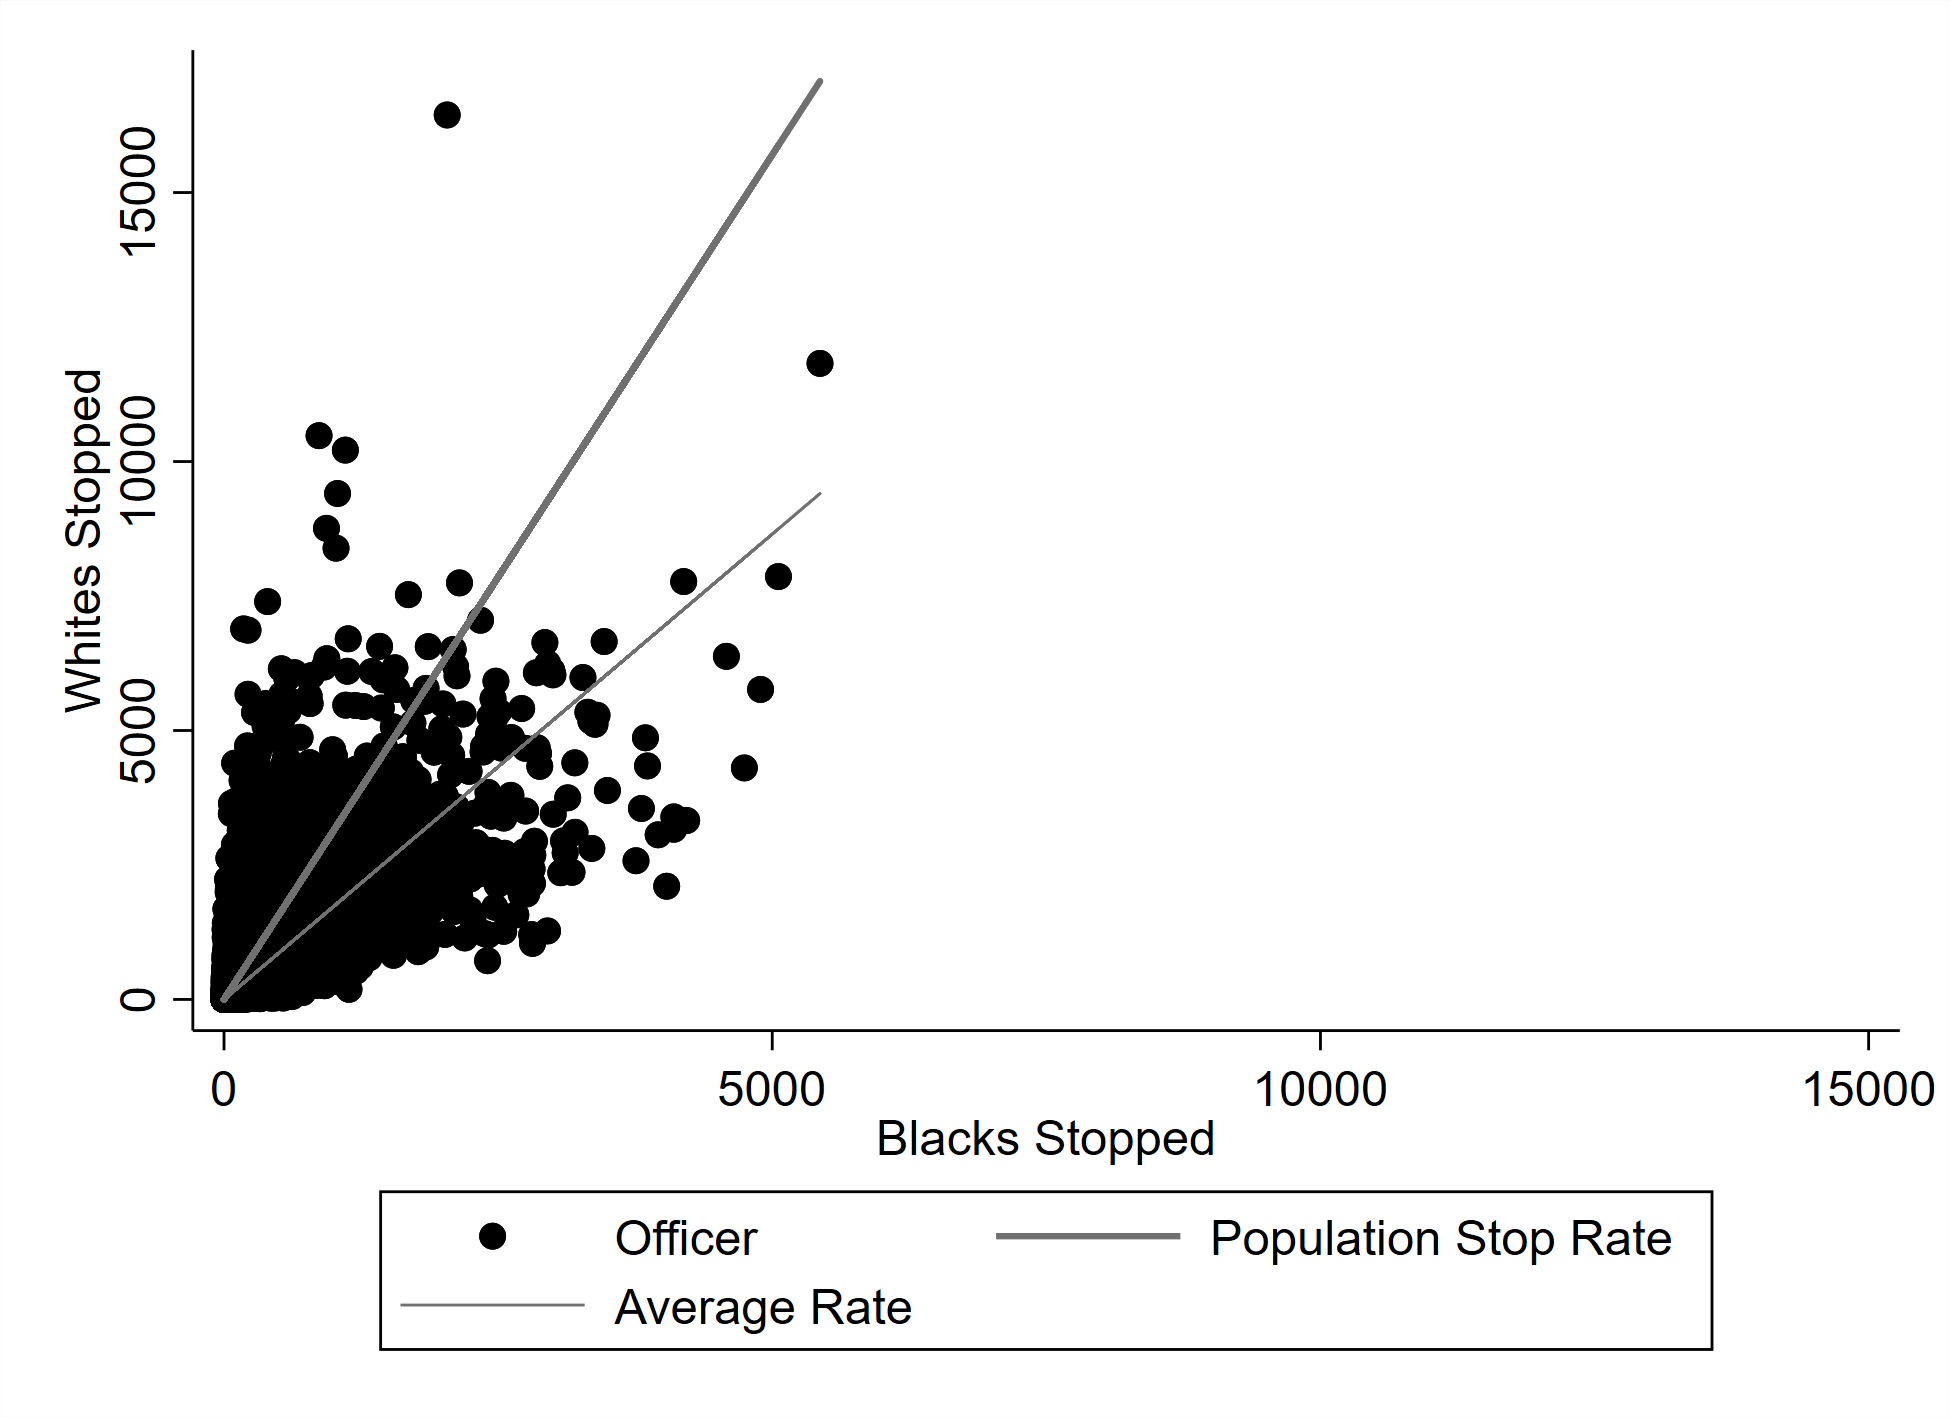
Figure 7.1a -- 7.1b -- 7.1c -- 7.1d -- 7.1e -- 7.1f -- 7.2a -- 7.2b -- 7.3a -- 7.3b
Figure 8.1 -- 8.2a -- 8.2b -- 8.2c -- 8.2d -- 8.3a -- 8.3b -- 8.3c -- 8.3d -- 8.4 -- 8.5a -- 8.5b -- 8.5c -- 8.5d -- 8.6a -- 8.6b -- 8.6c -- 8.6d
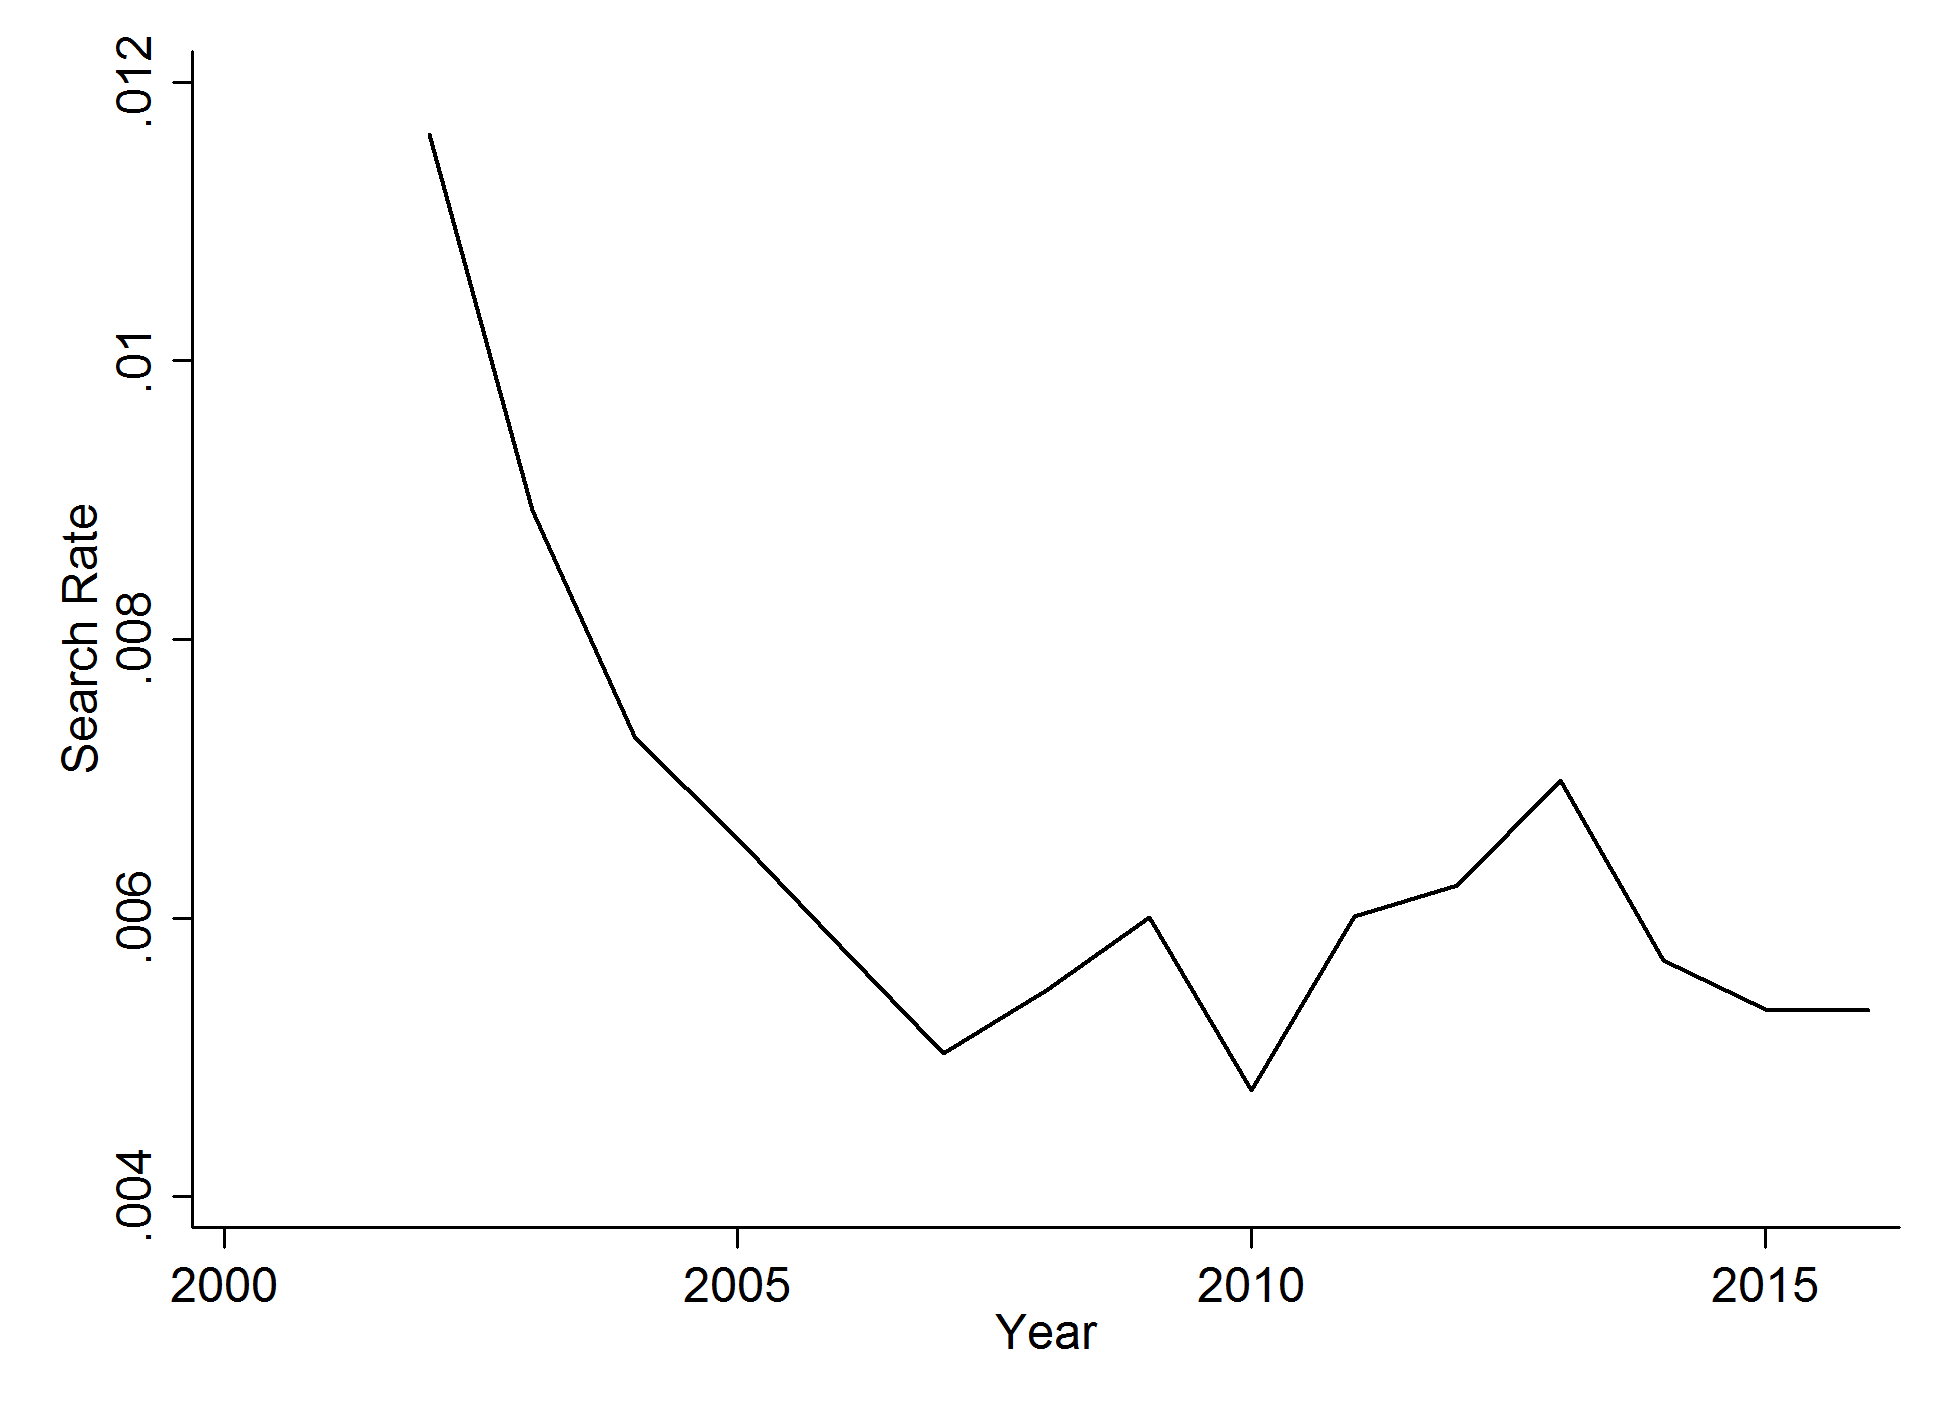
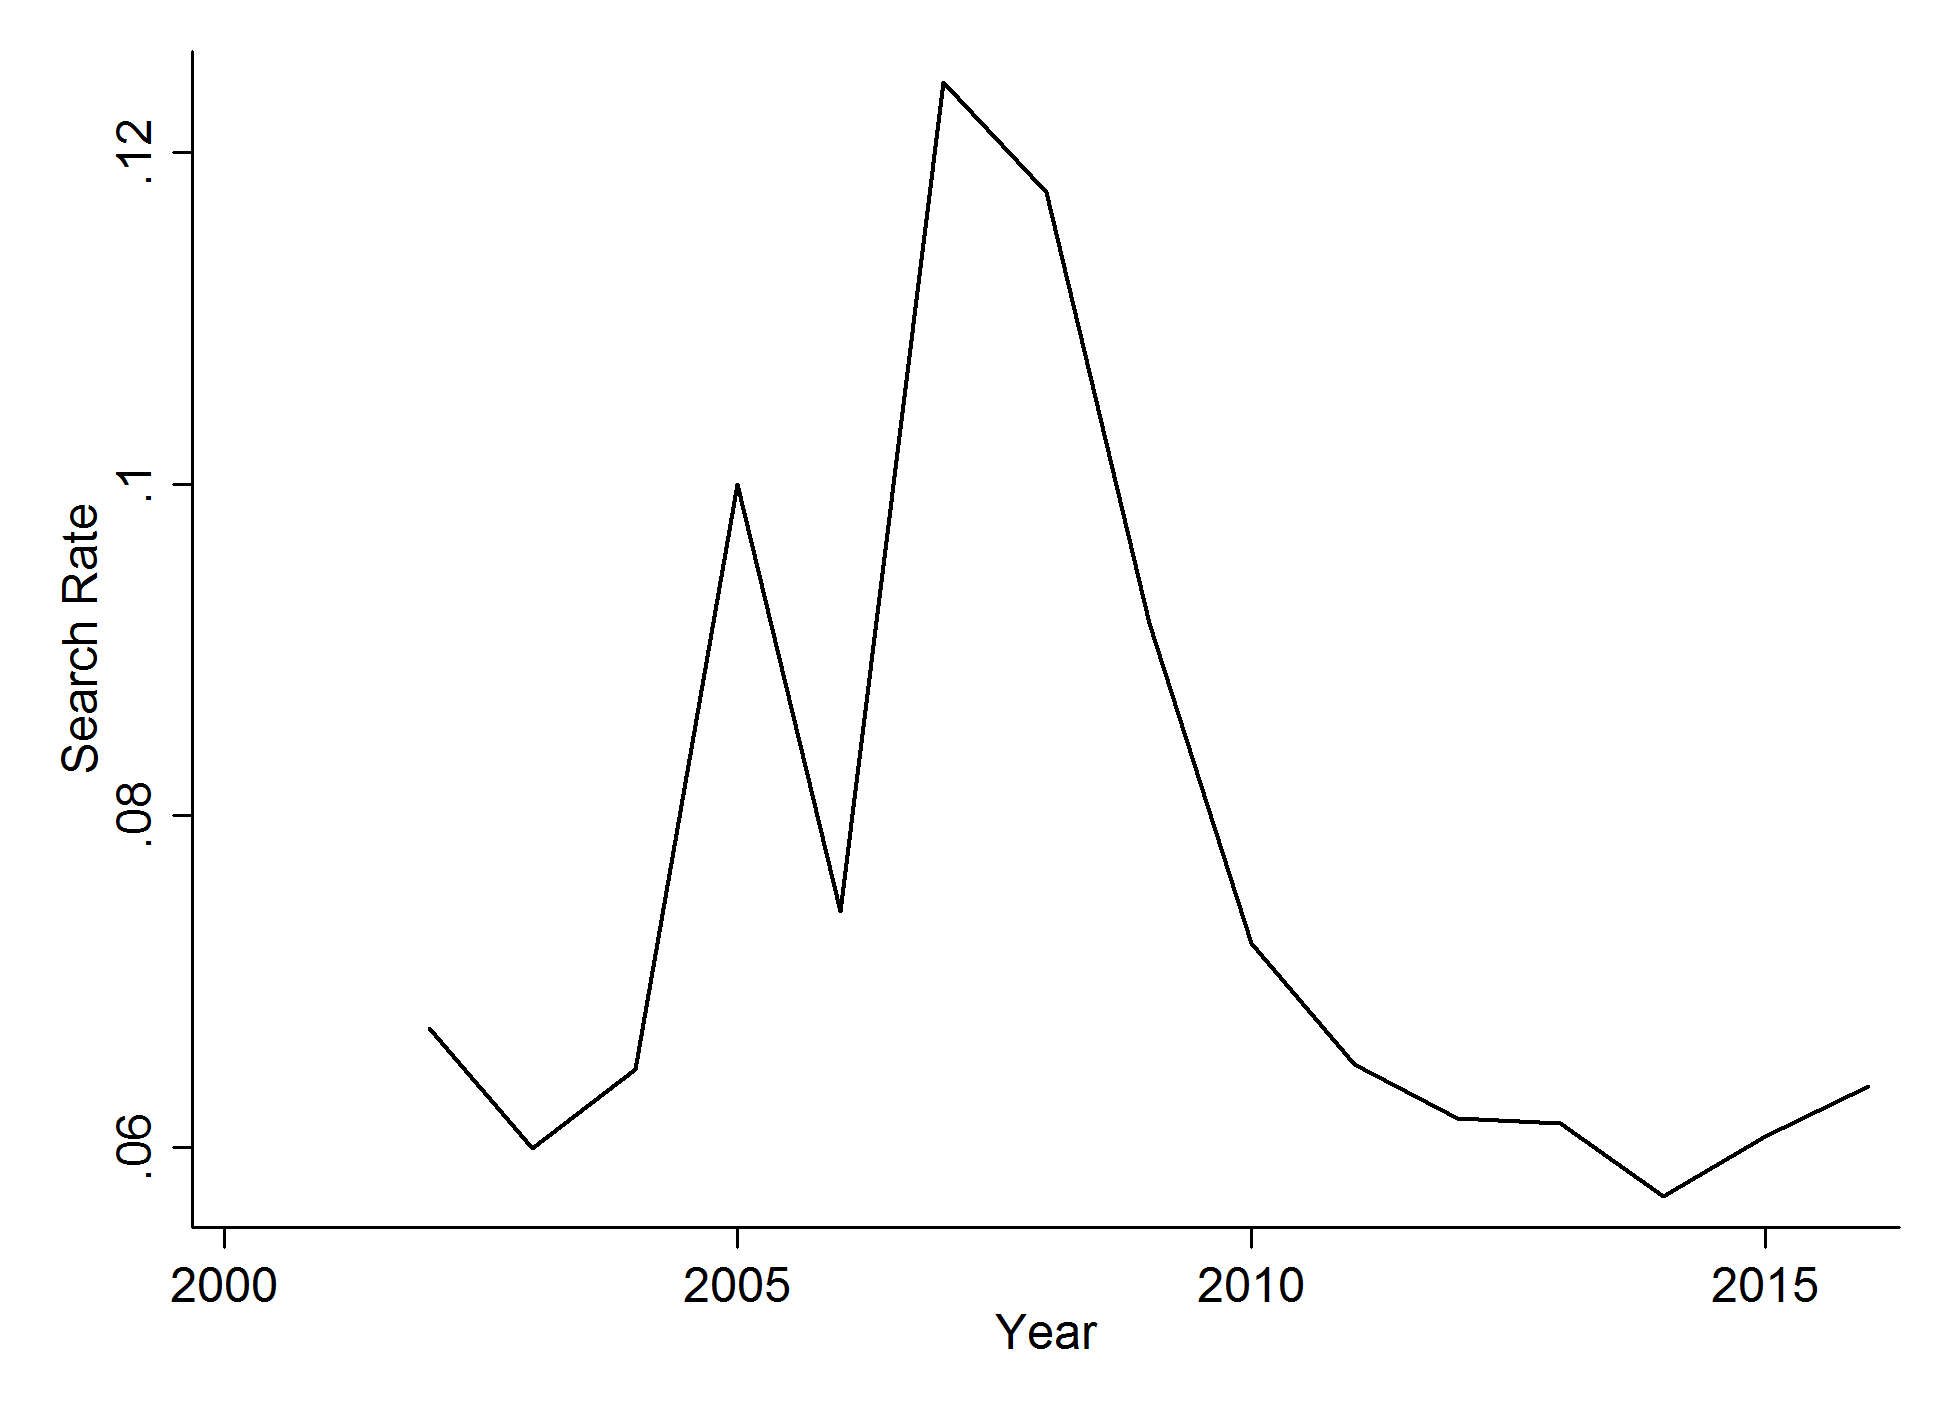
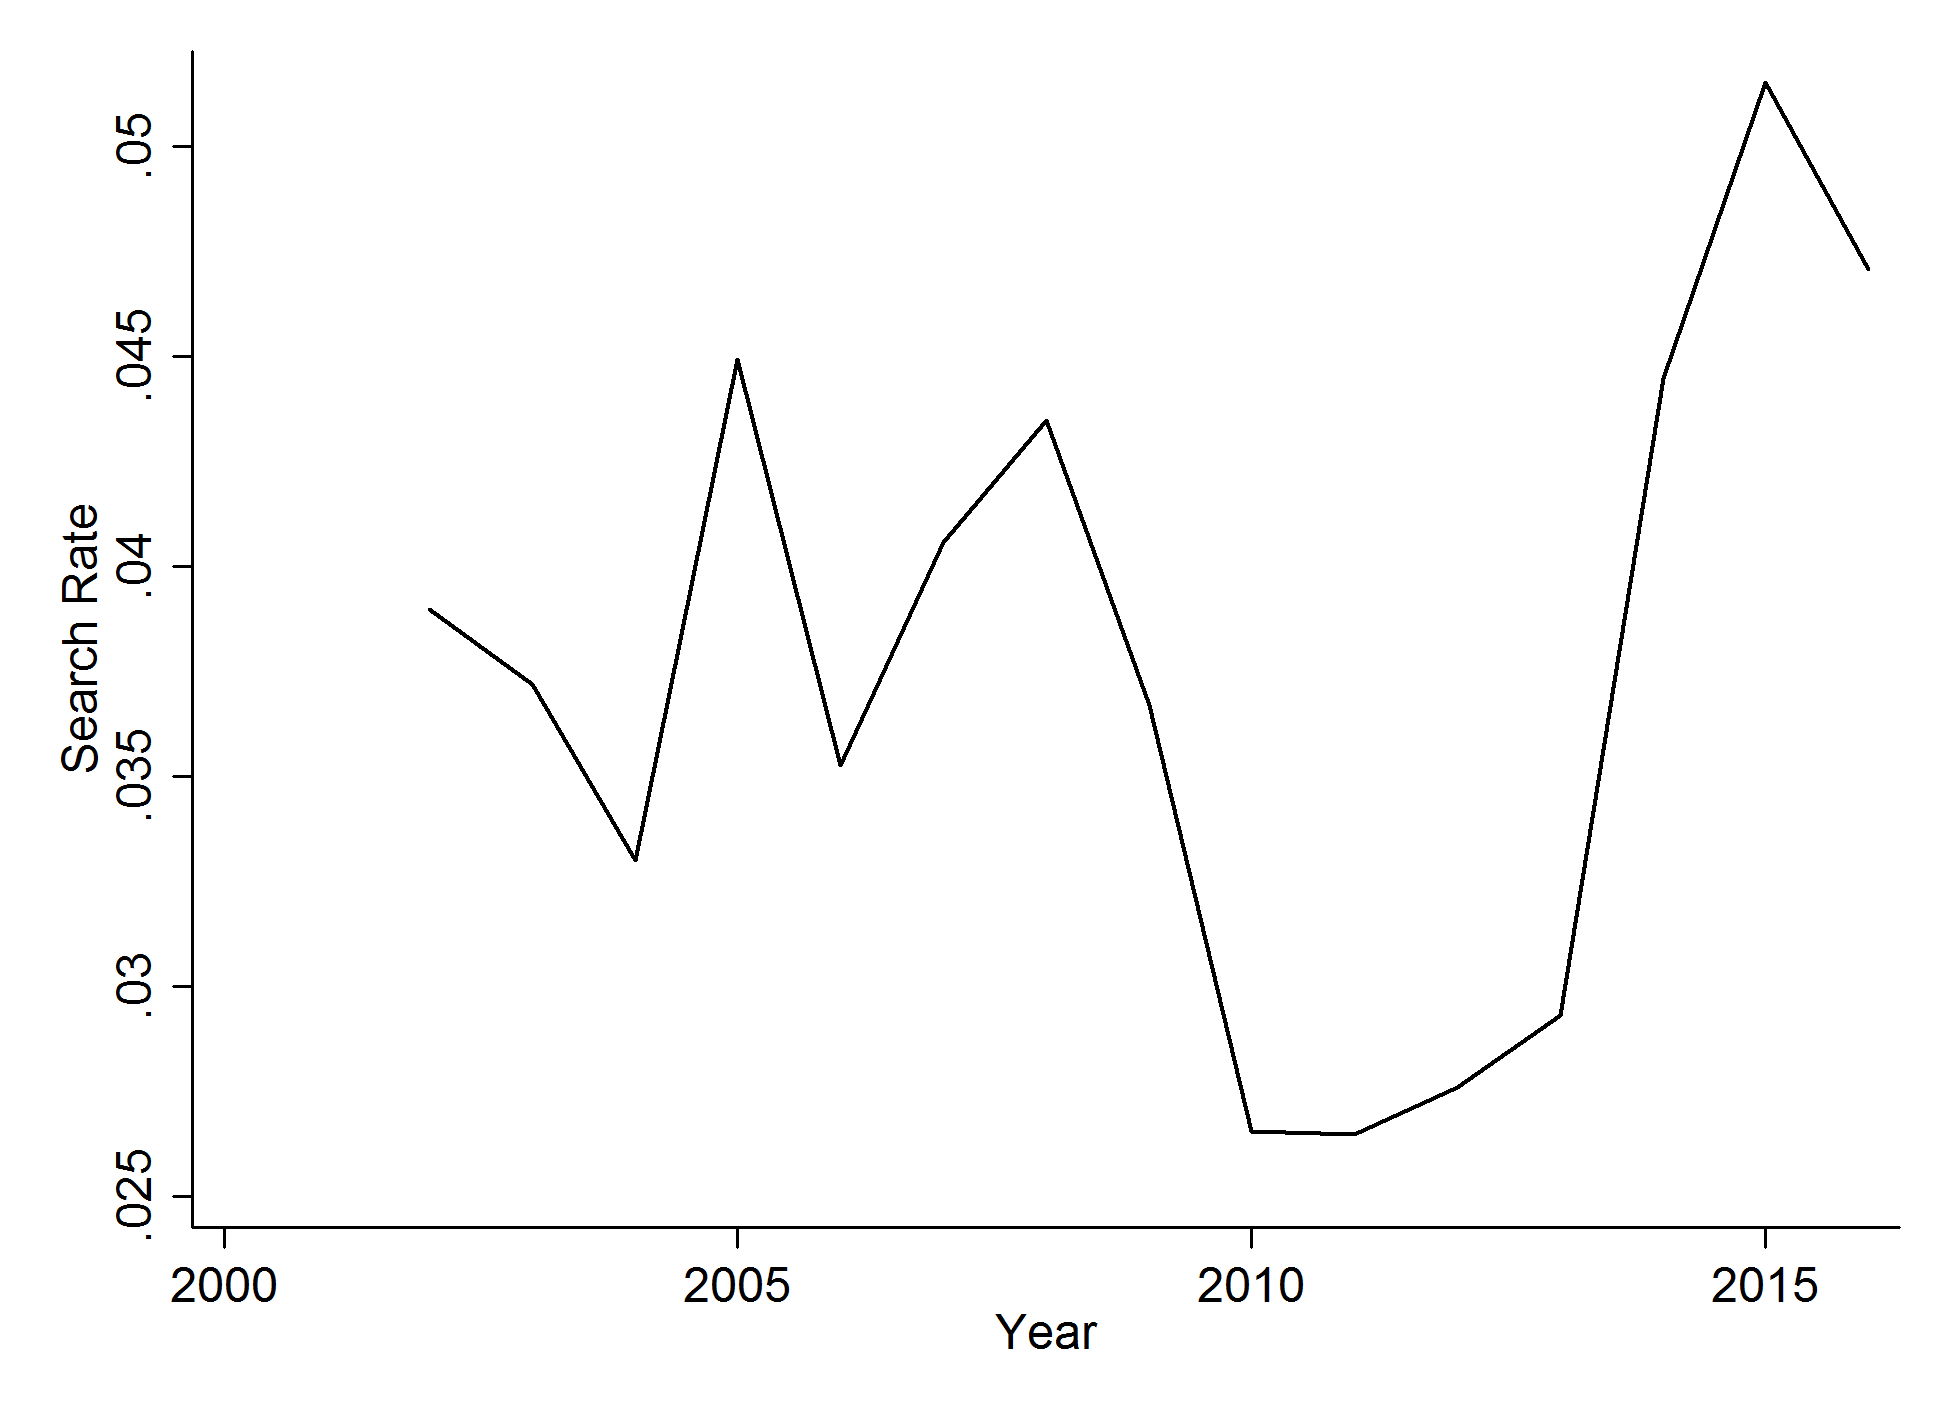
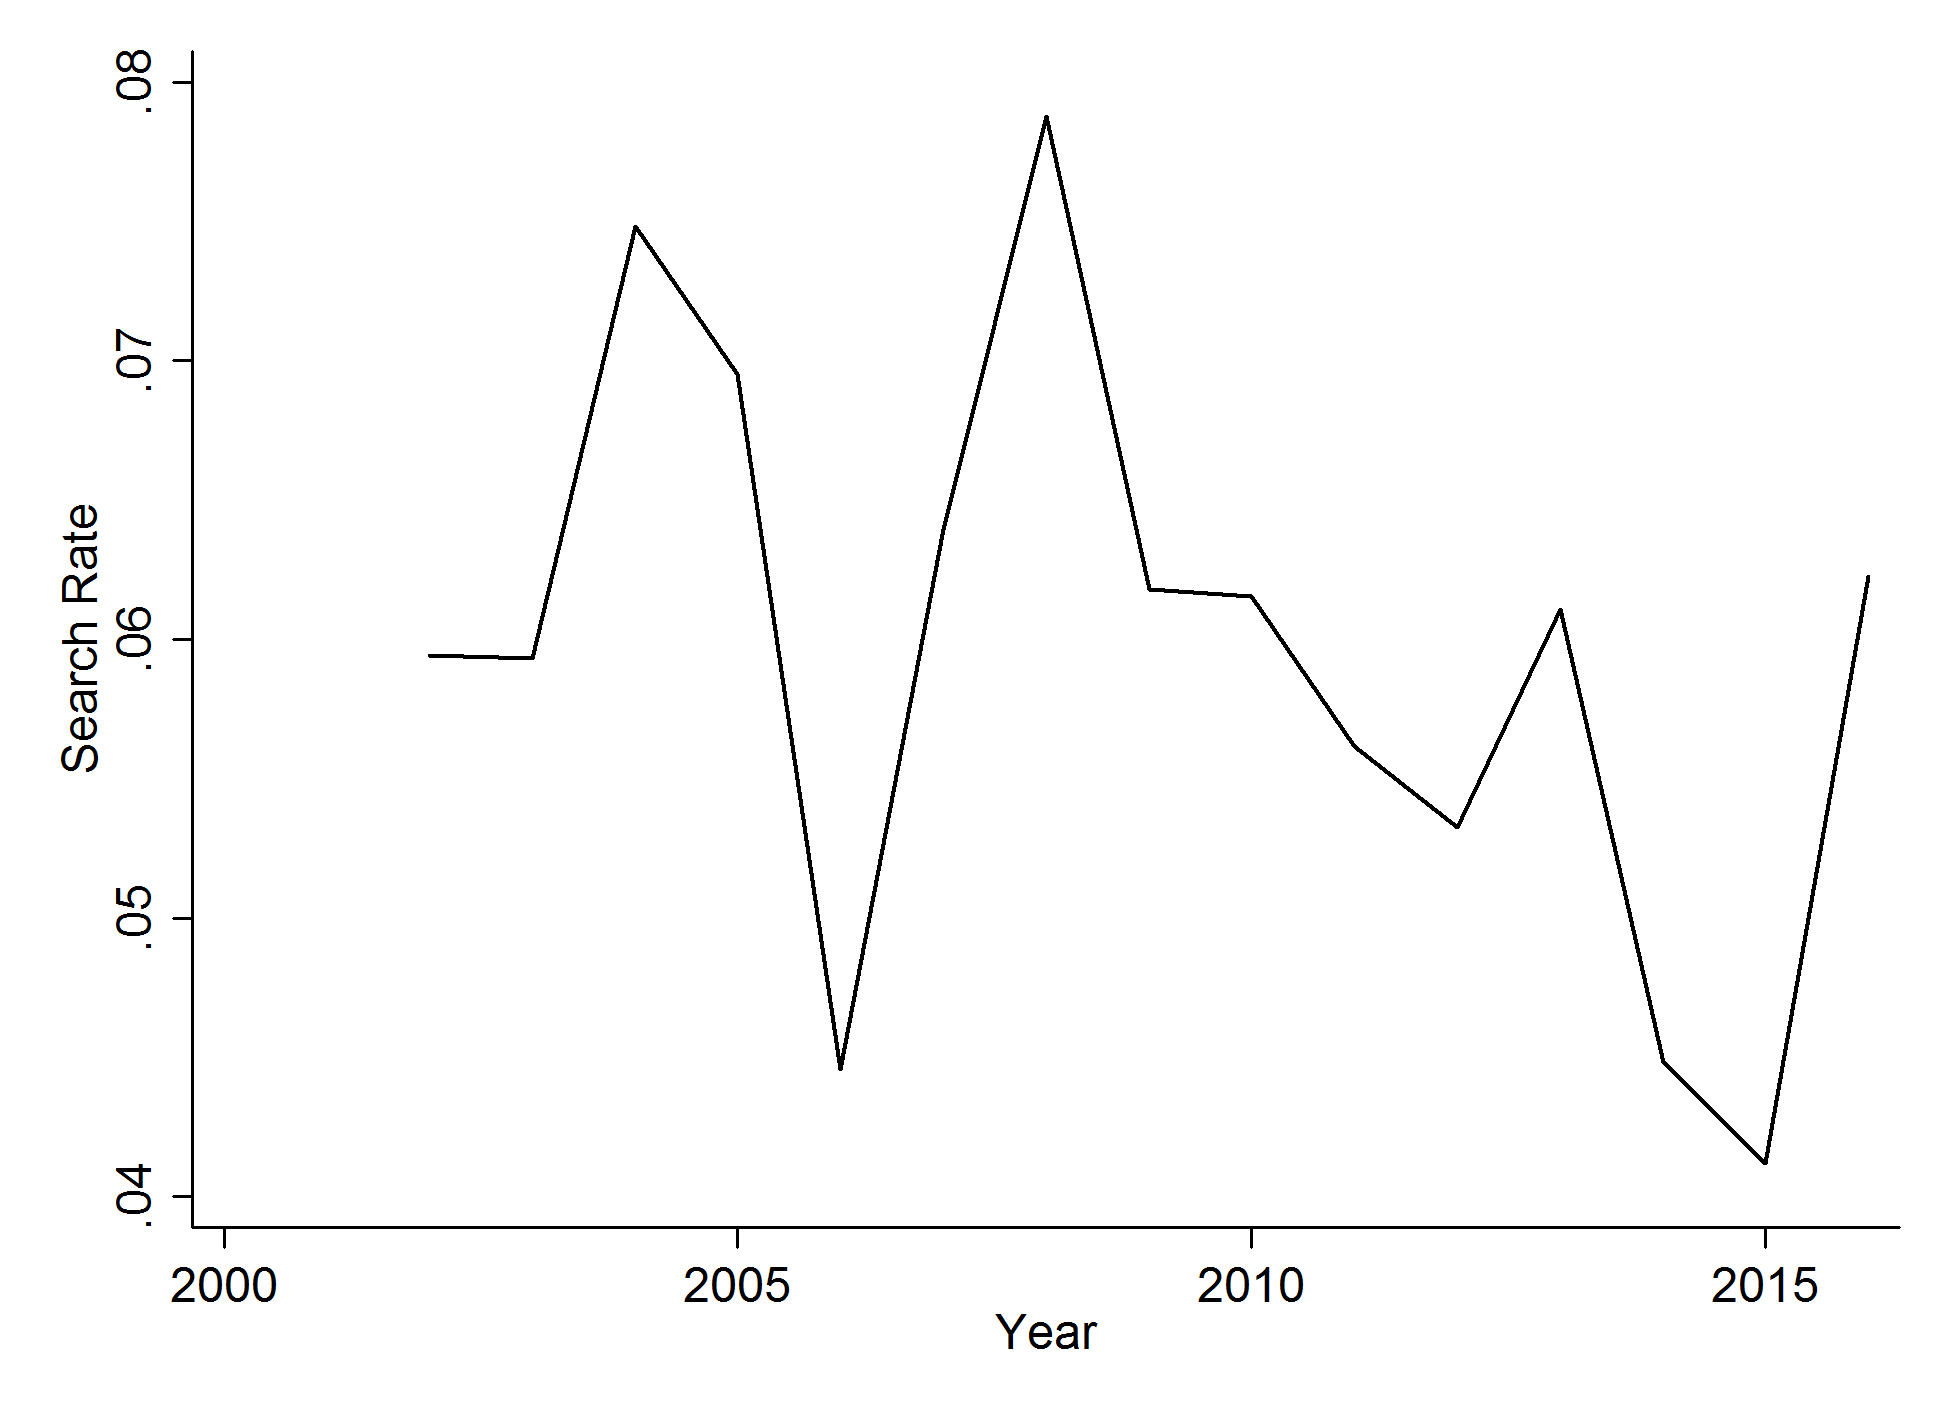
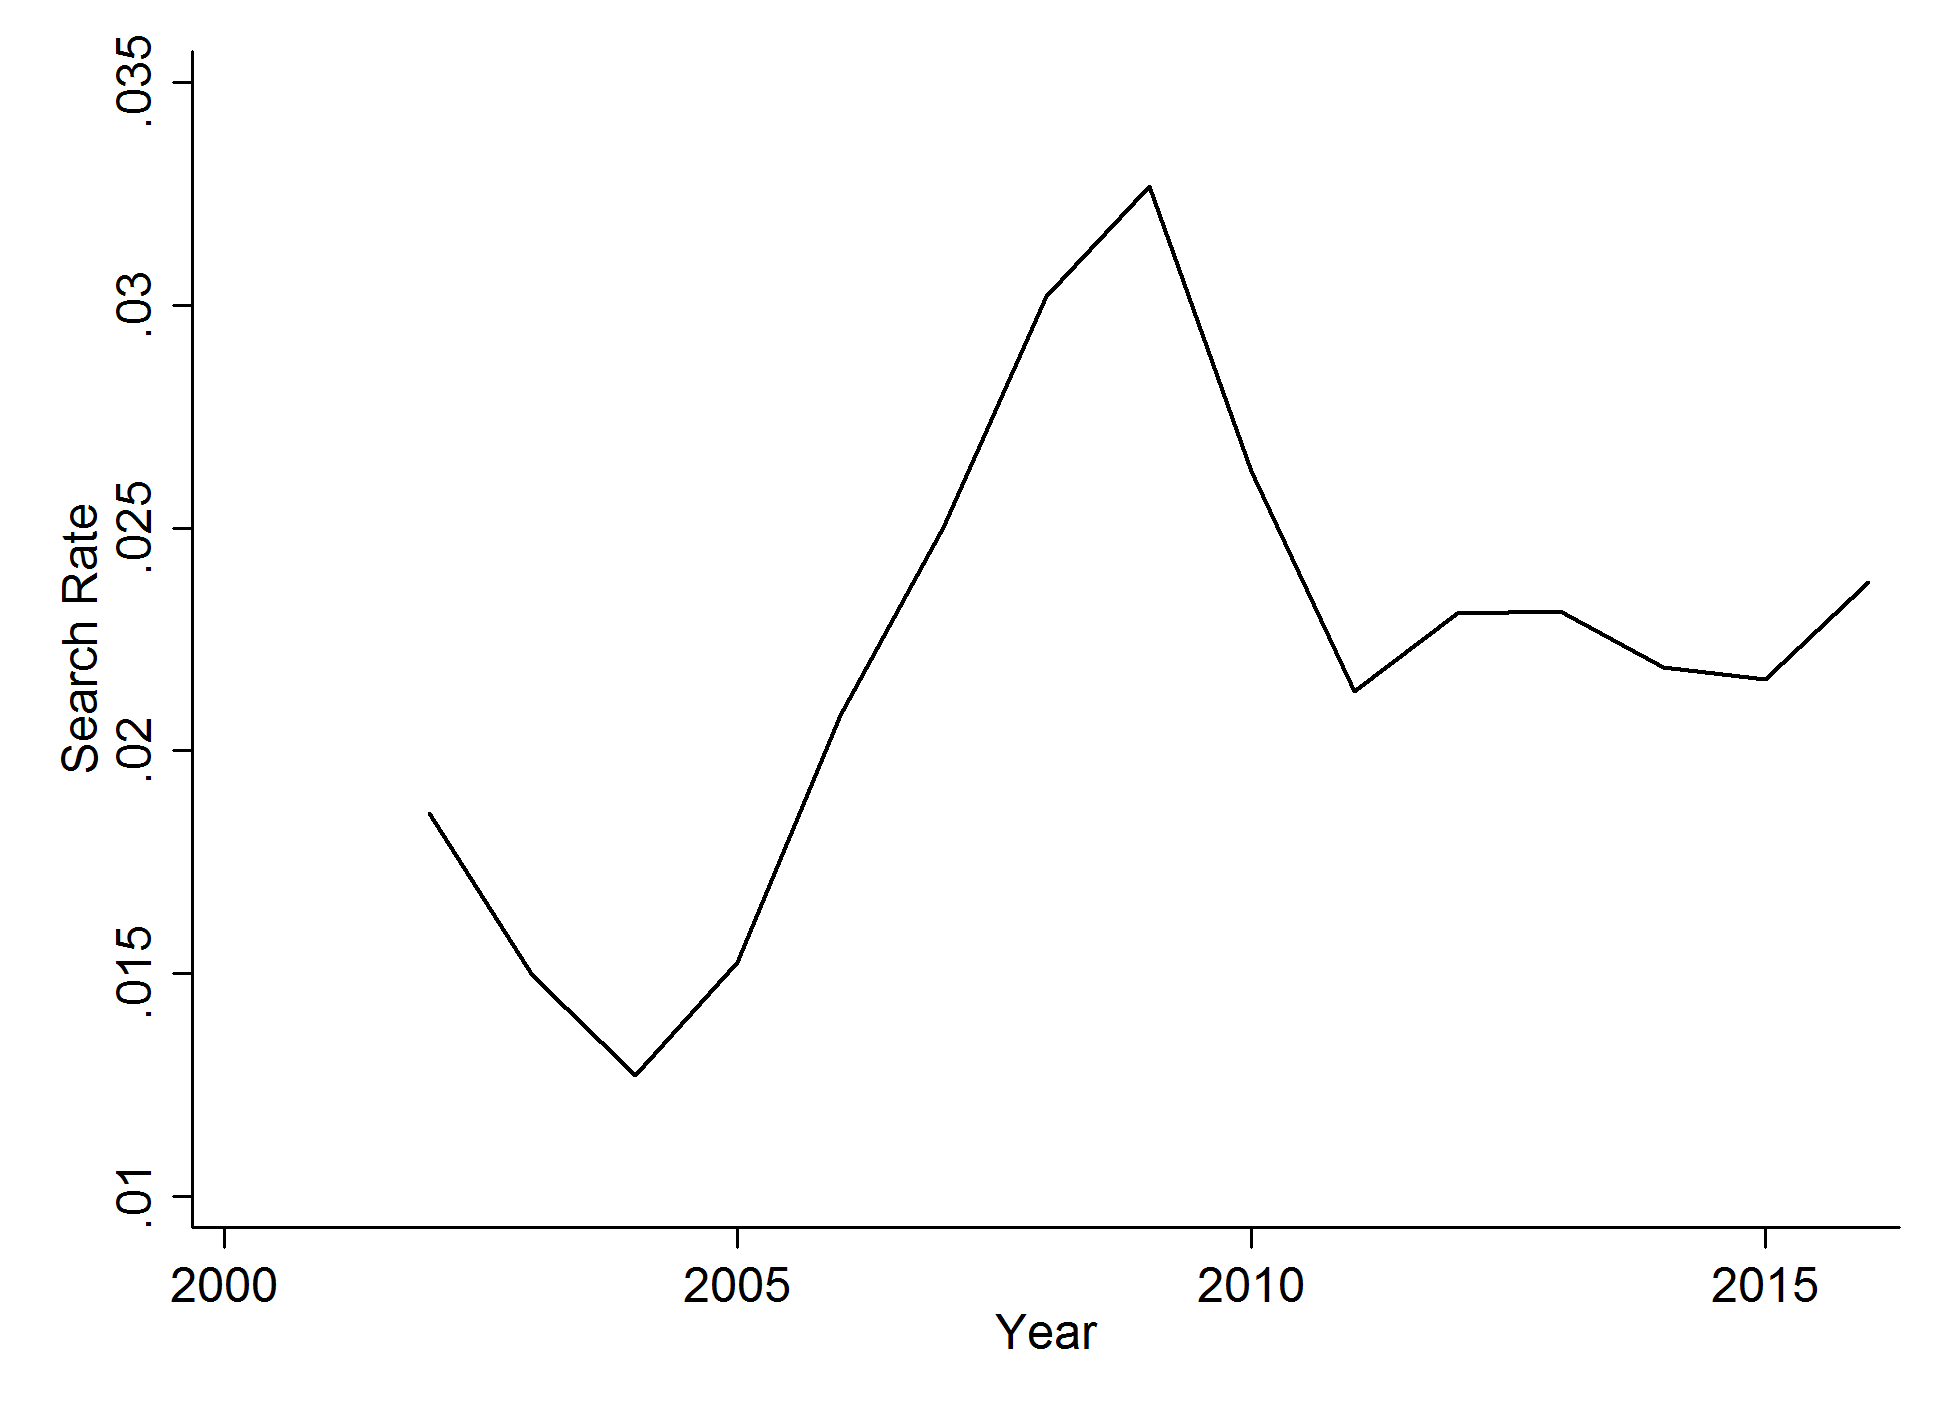
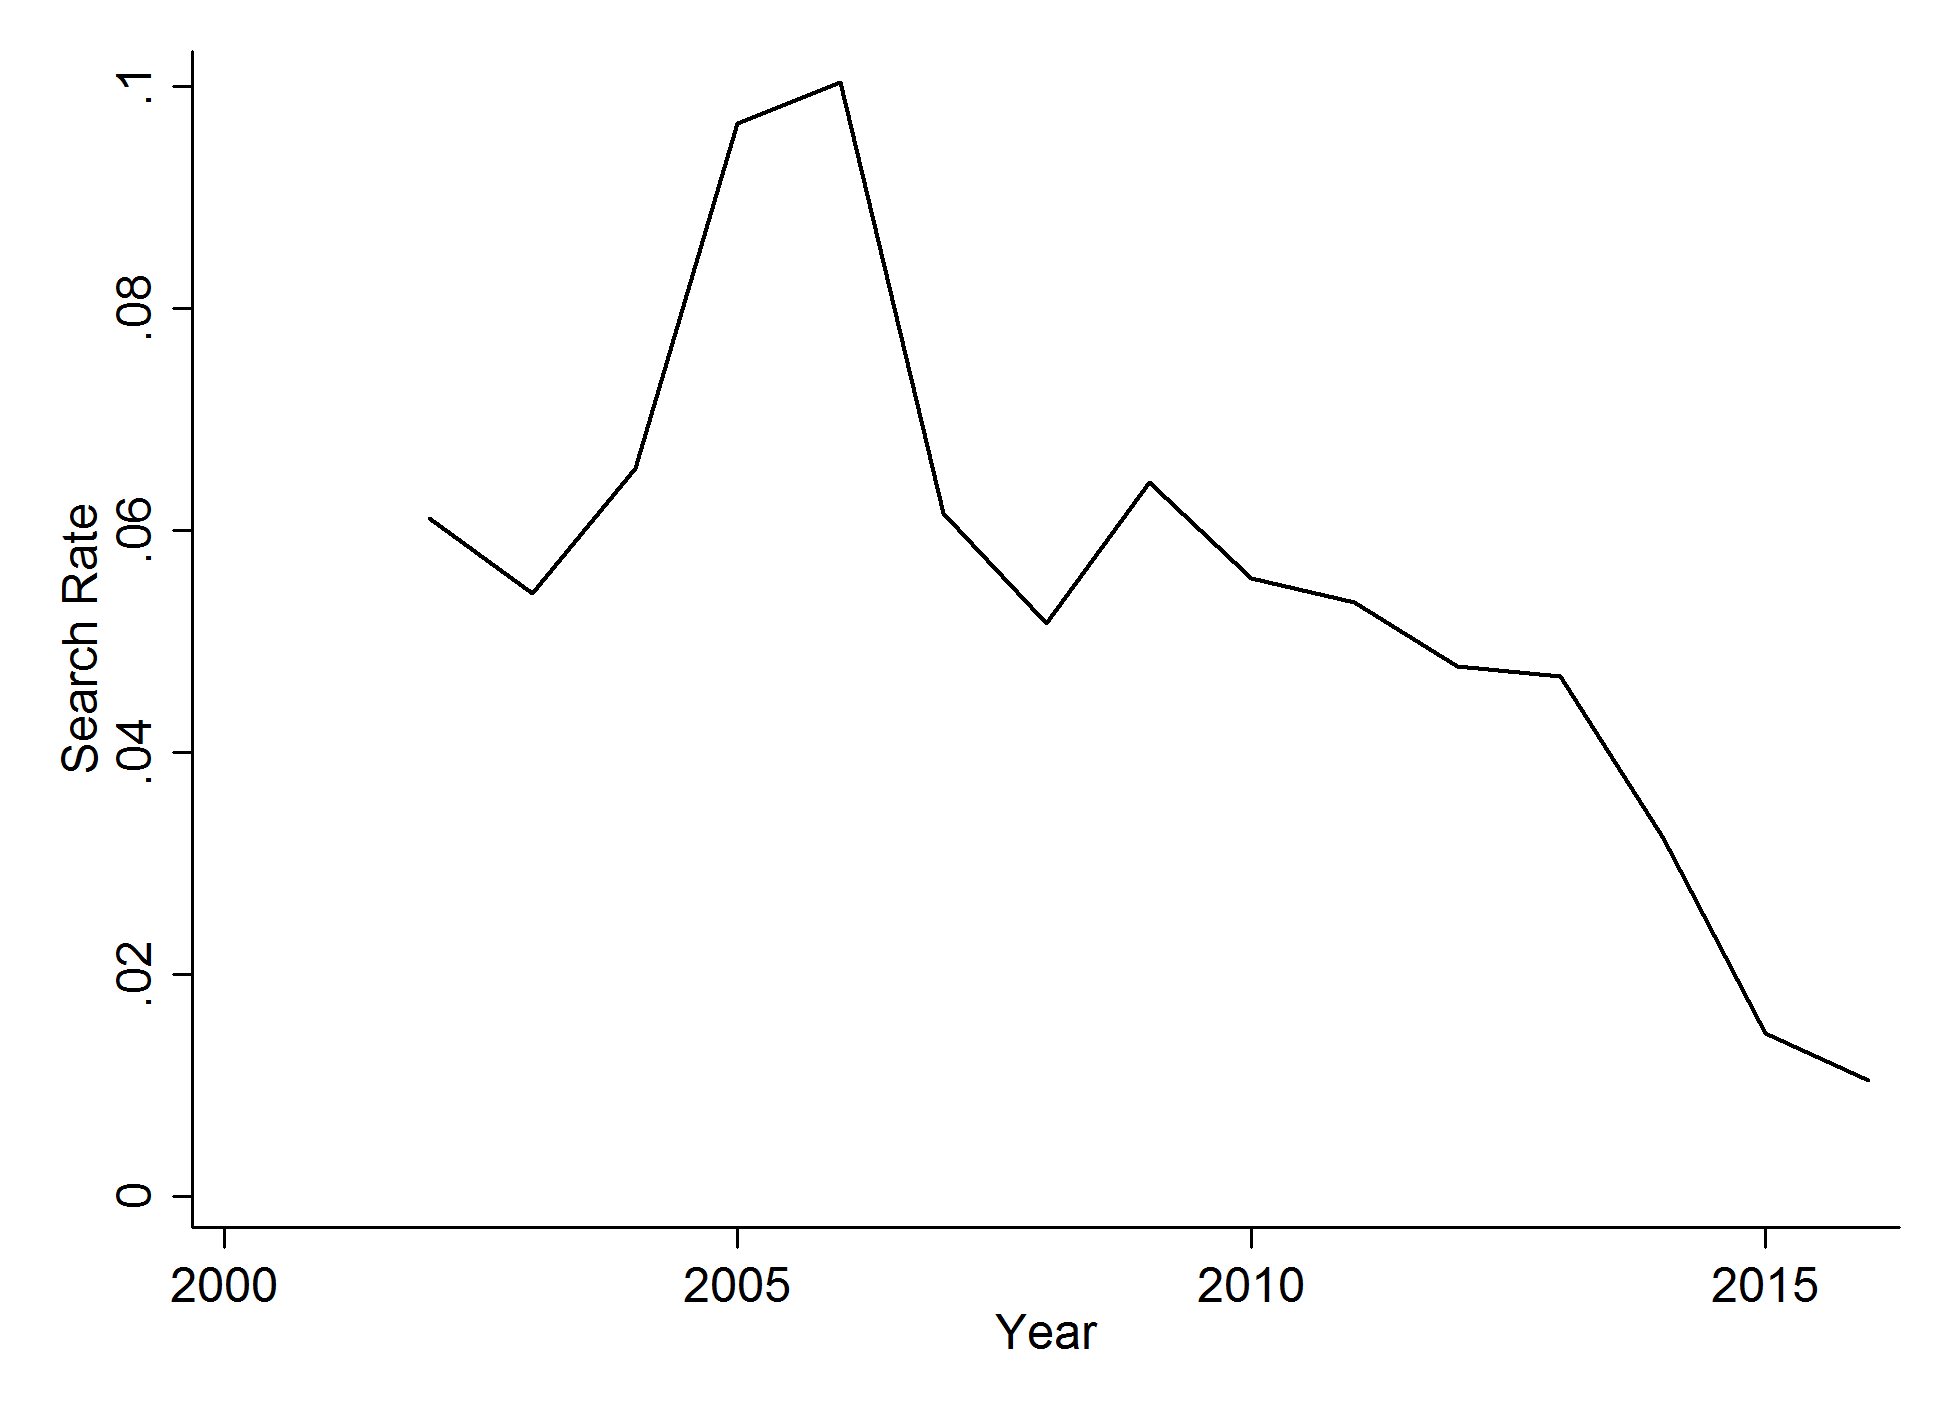
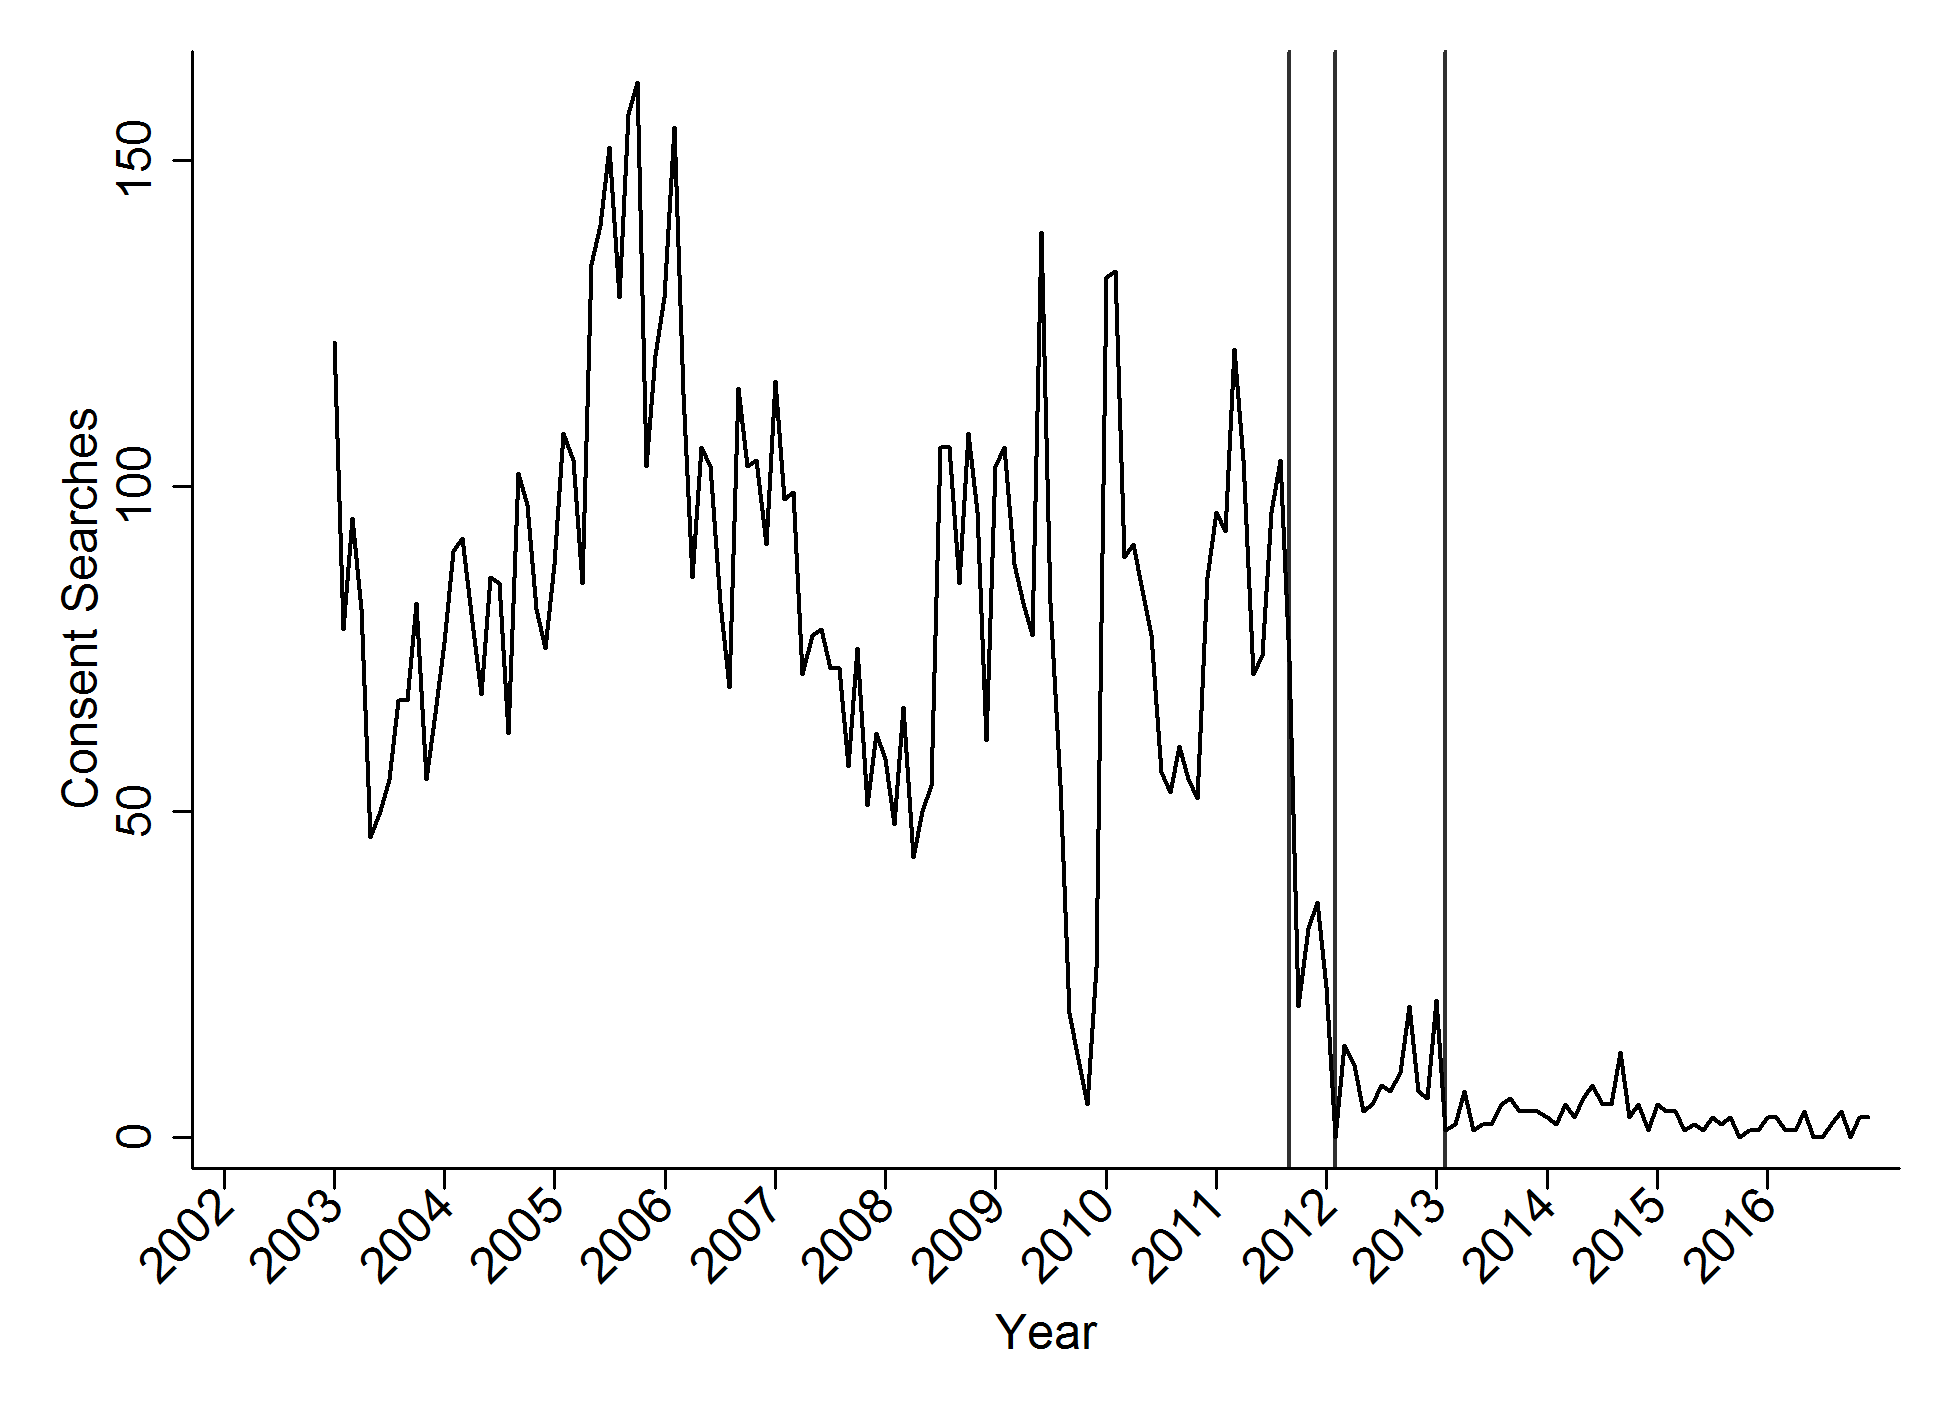
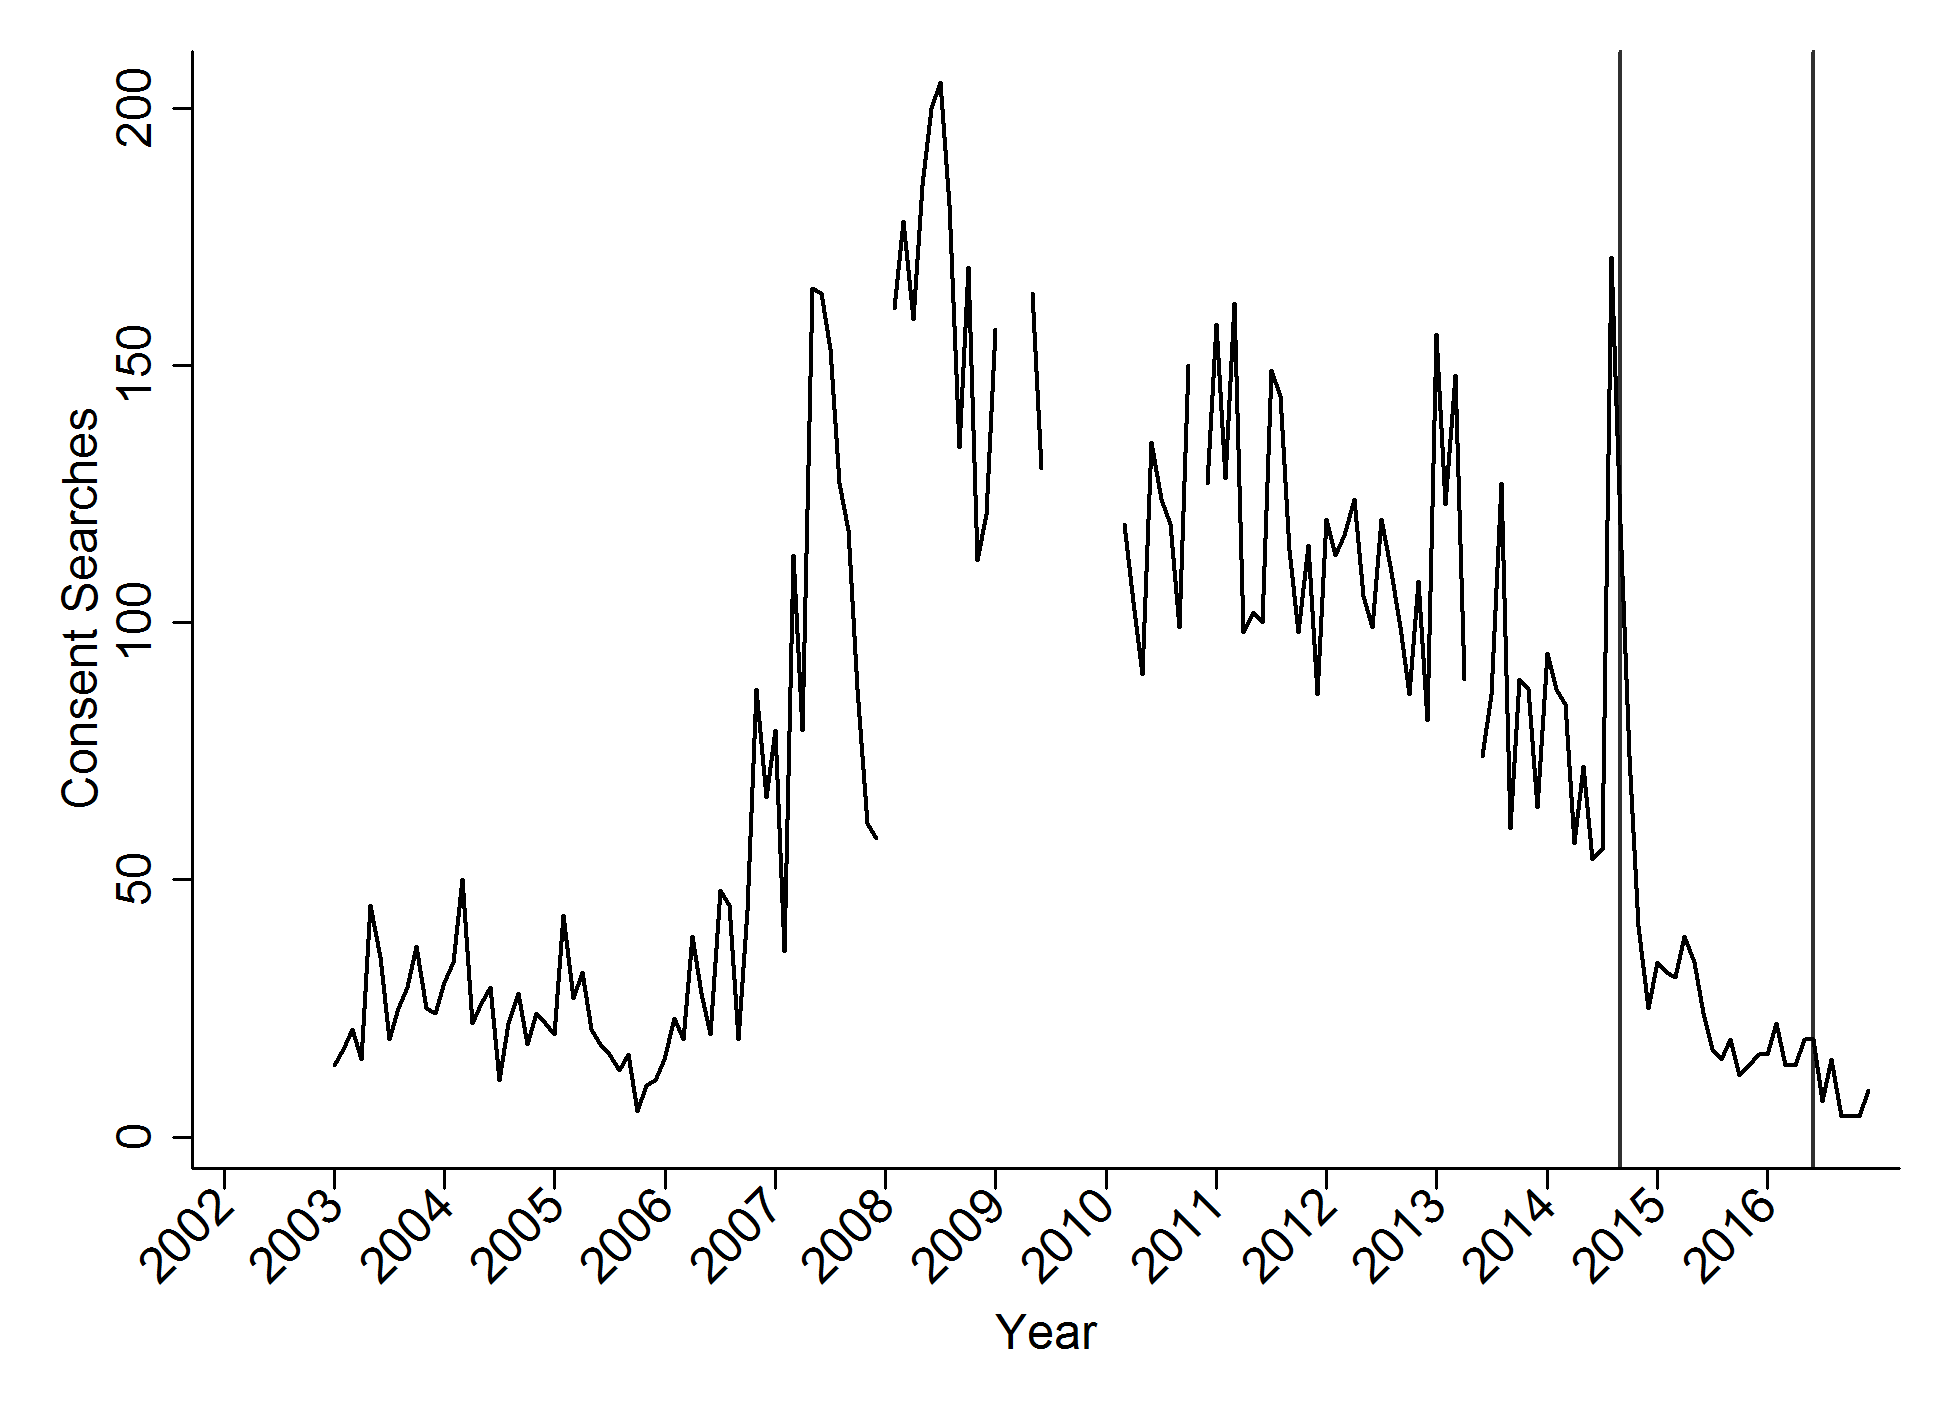
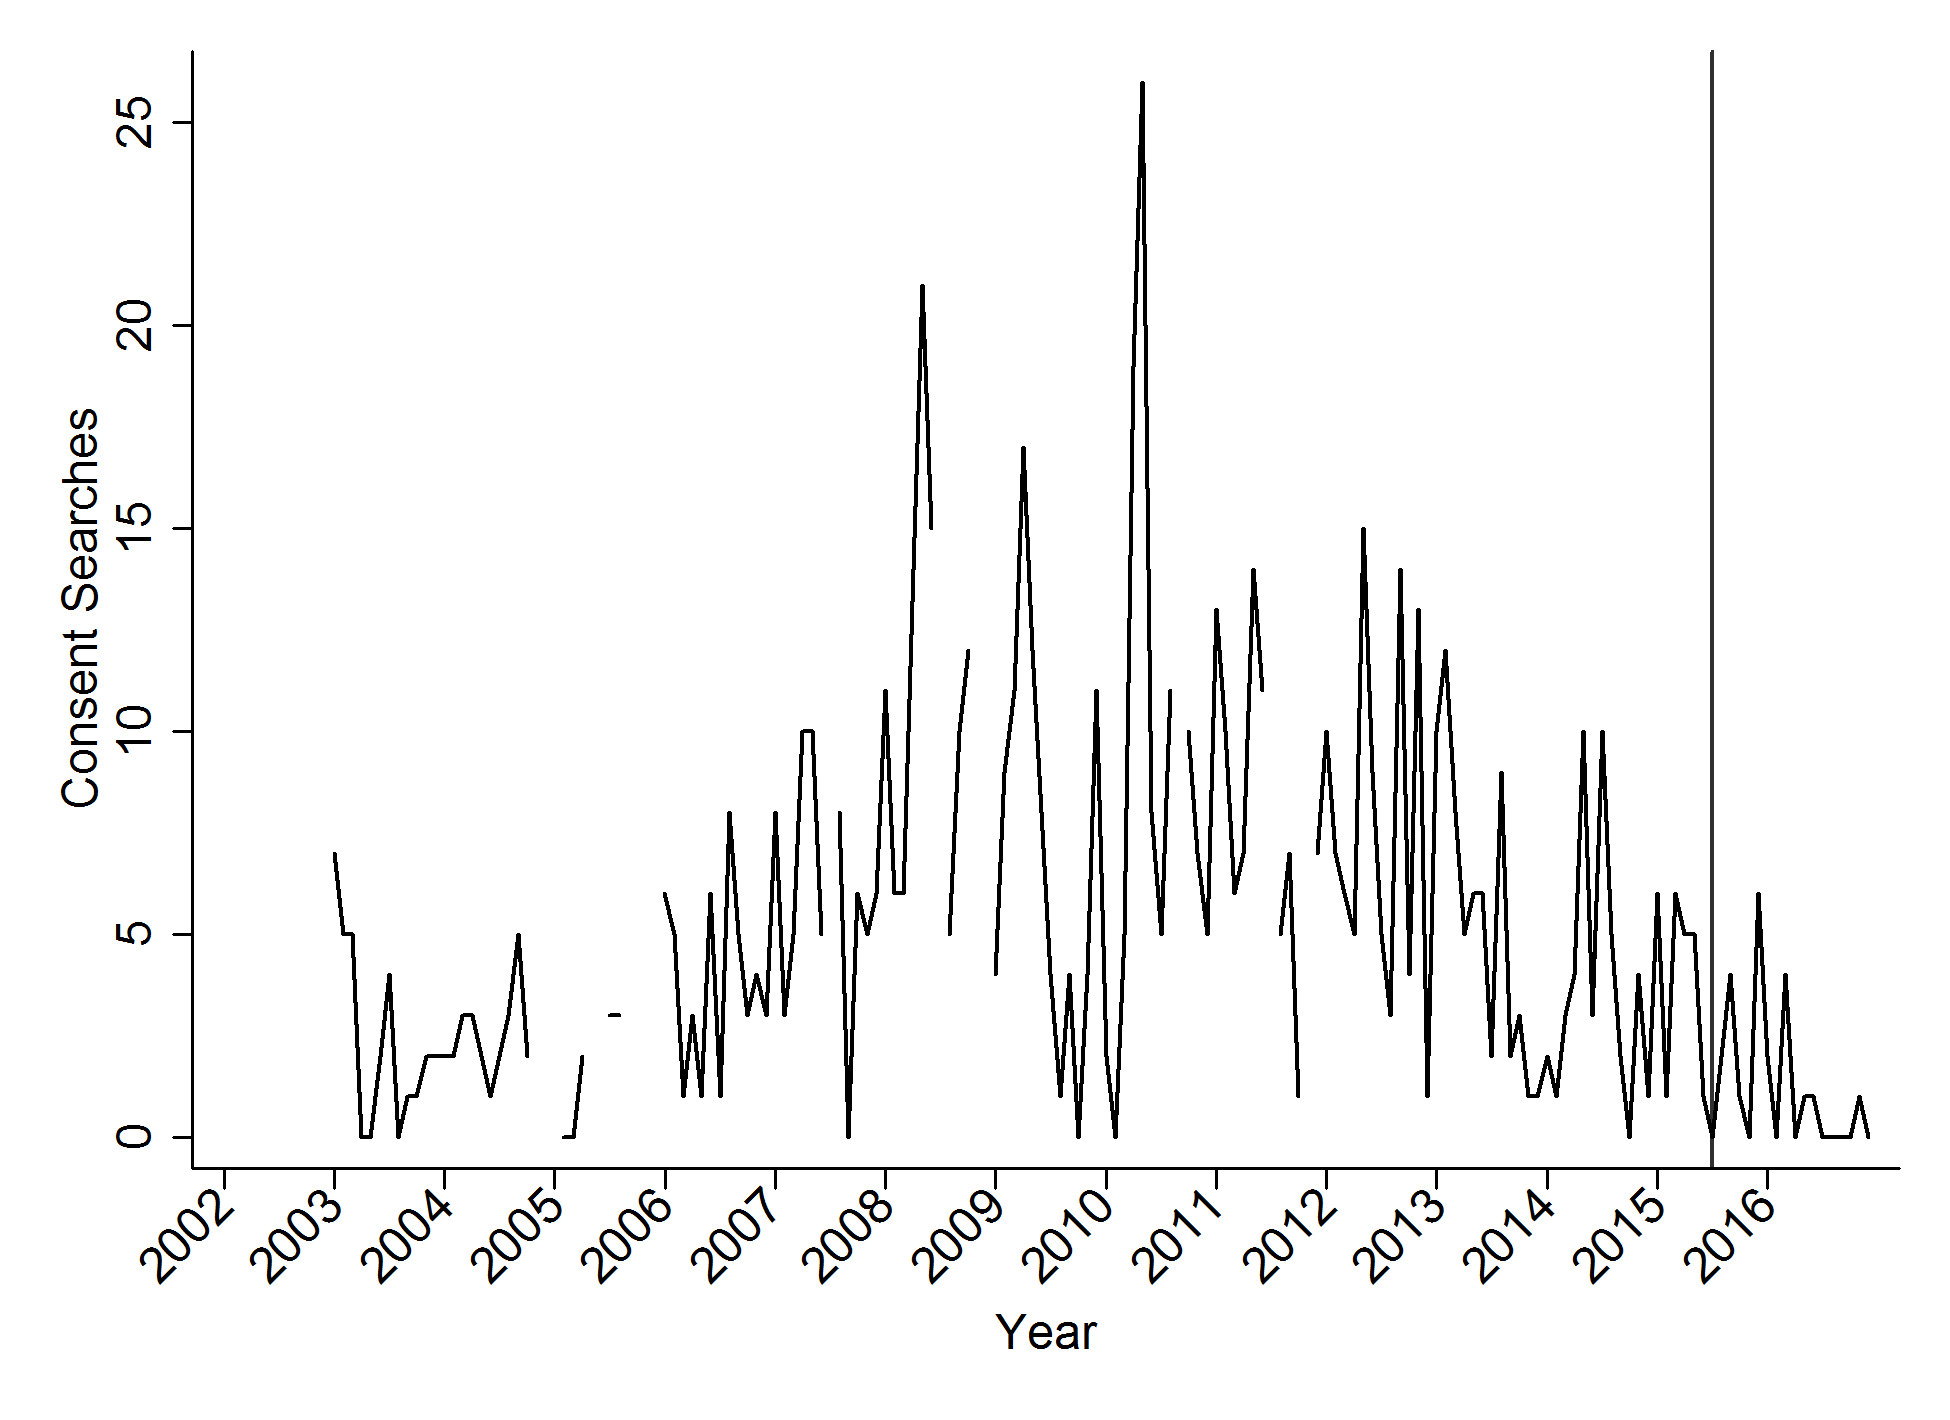
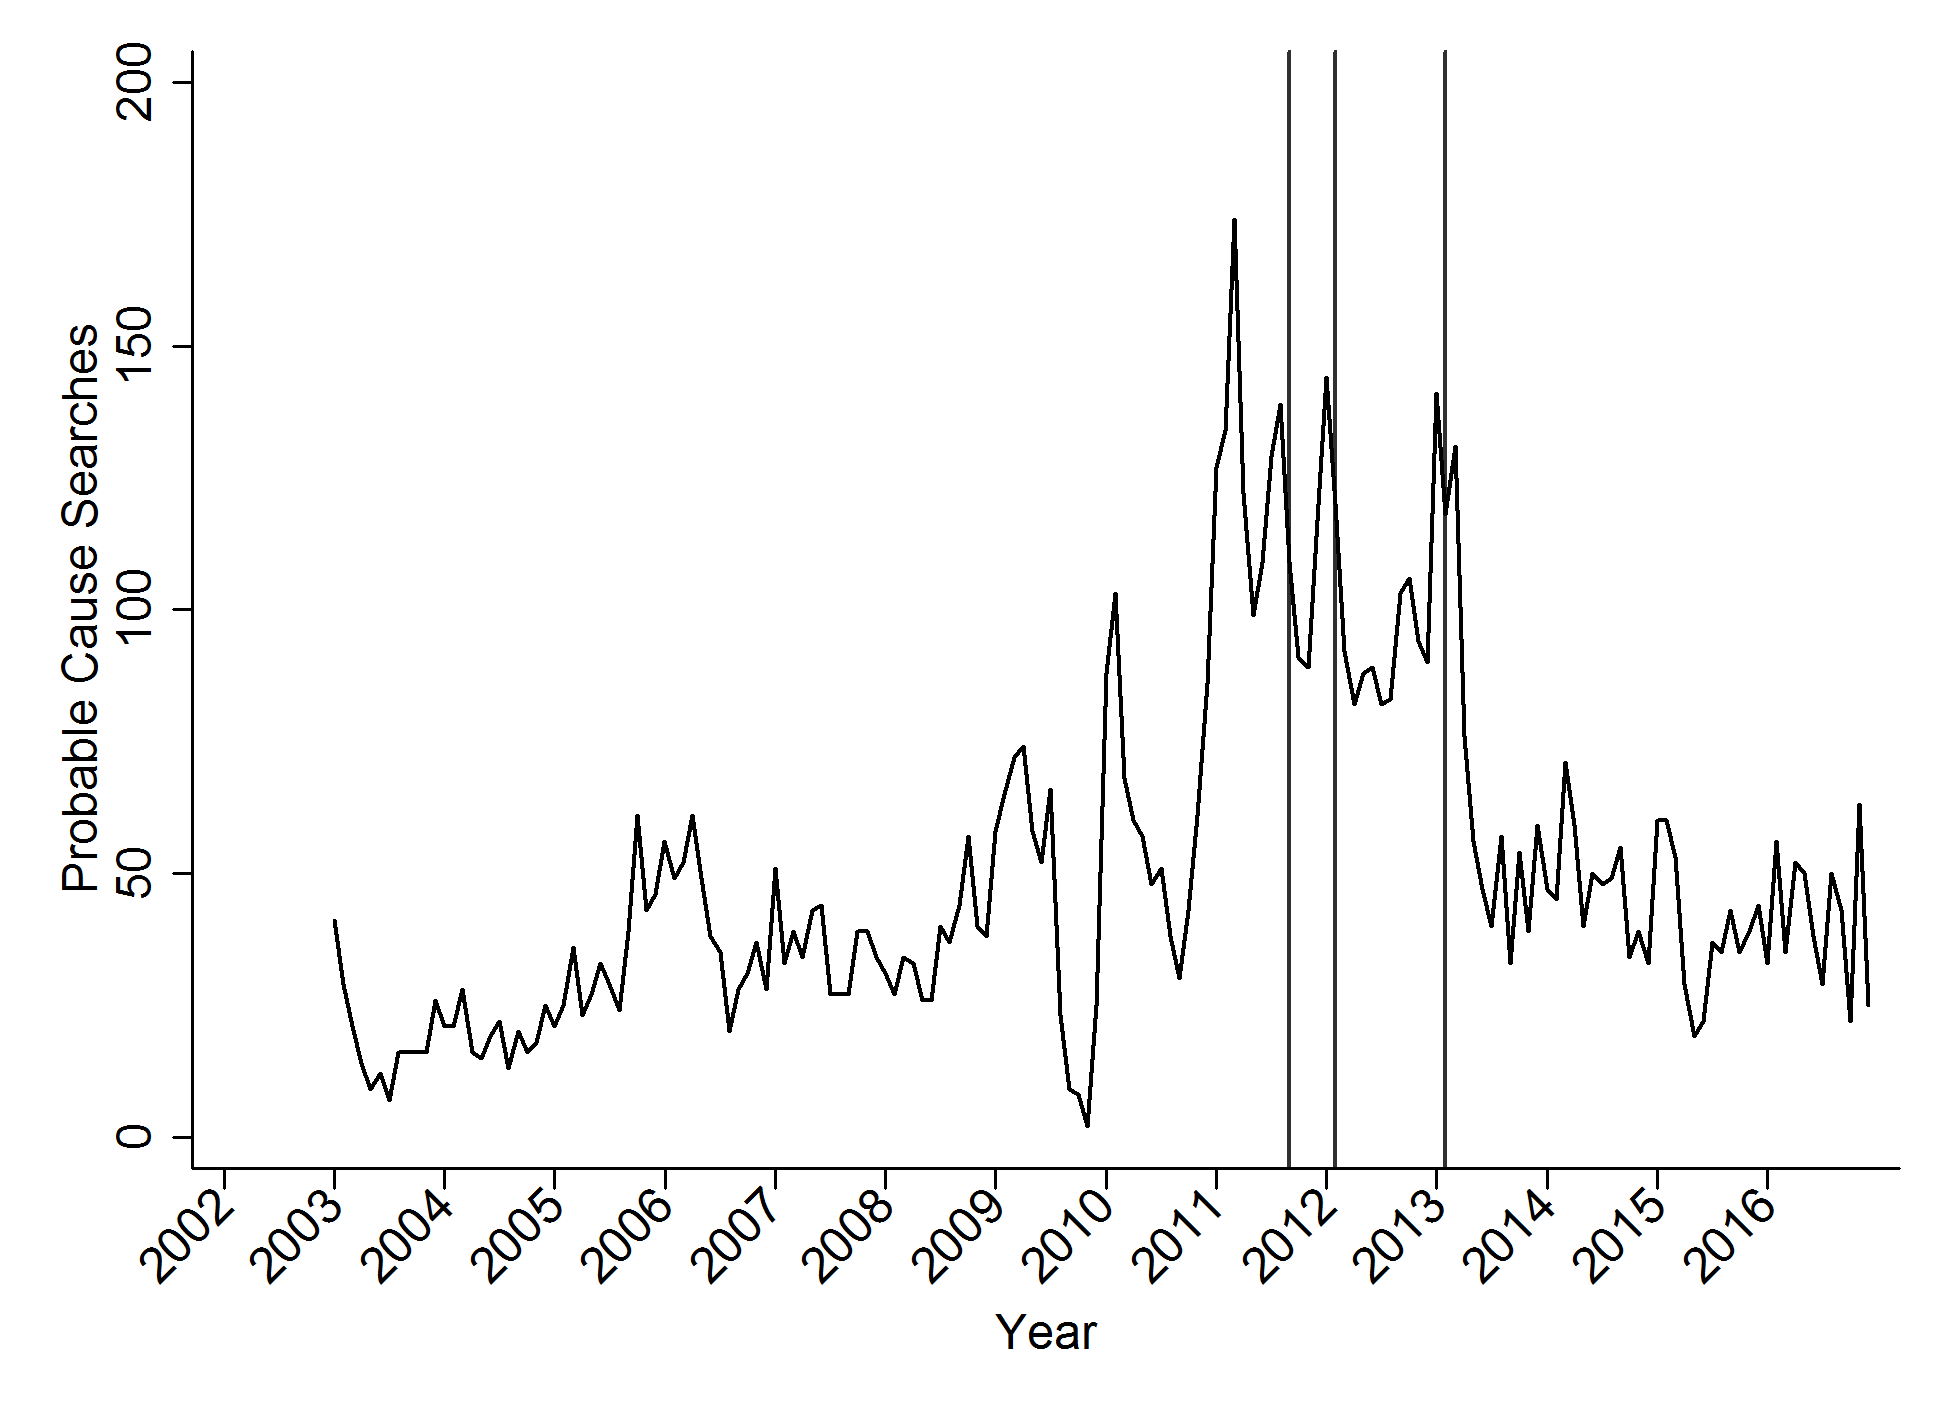
Figure 9.1a -- 9.1b -- 9.1c -- 9.2a -- 9.2b -- 9.2c -- 9.3a -- 9.3b
For readers interested in updates, please see our updates through 2020 above, or our instructions at the top of thi spage for an automated connection to the State SBI database, pulling the current version of the data from that FTP server and converting it to a Stata database,
Simple spreadsheets drawn from our analyses:
Stops, Searches, and Contraband Hits by race, by agency, by year, 2002-2016 (drivers only, no checkpoints). Includes rates of search, search rate ratios comparing black and Hispanic drivers to white drivers. See the "codebook" sheet for an explanation of the variables included.
Checkpoint stops: similar data to those presented above, for checkpoints. Generally these are not included in our analyses but we provide them here for completeness. Includes passengers. Note that checkpoint stops are generally not recorded unless there is an "adverse outcome" such as a search. Data collection for checkpoint stops began only in 2010.
Please see our "Links" page for the NC SBI site and other traffic data repositories.
(This page was last updated August 2, 2021.)