Working as Intended:
What Archives and Data Tell Us about the Legacy of Racism in the Law
Frank R. Baumgartner, Kaneesha Johnson, and Marty A. Davidson, II
University of Chicago Press
forthcoming, 2027
Maps
This page provides maps not included in the book. For maps published in the book, see the "Figures" page of this website, which reproduces them, provides color versions, and gives the data and code associated with each figure in the book, including maps.
For each city listed below, we include the 1937 HOLC map made available by Robert Nelson and the Digital Scholarship Laboratory at the University of Richmond. (See their site for approximately 300 historical redlining maps from cities across the country, and for other resources.)
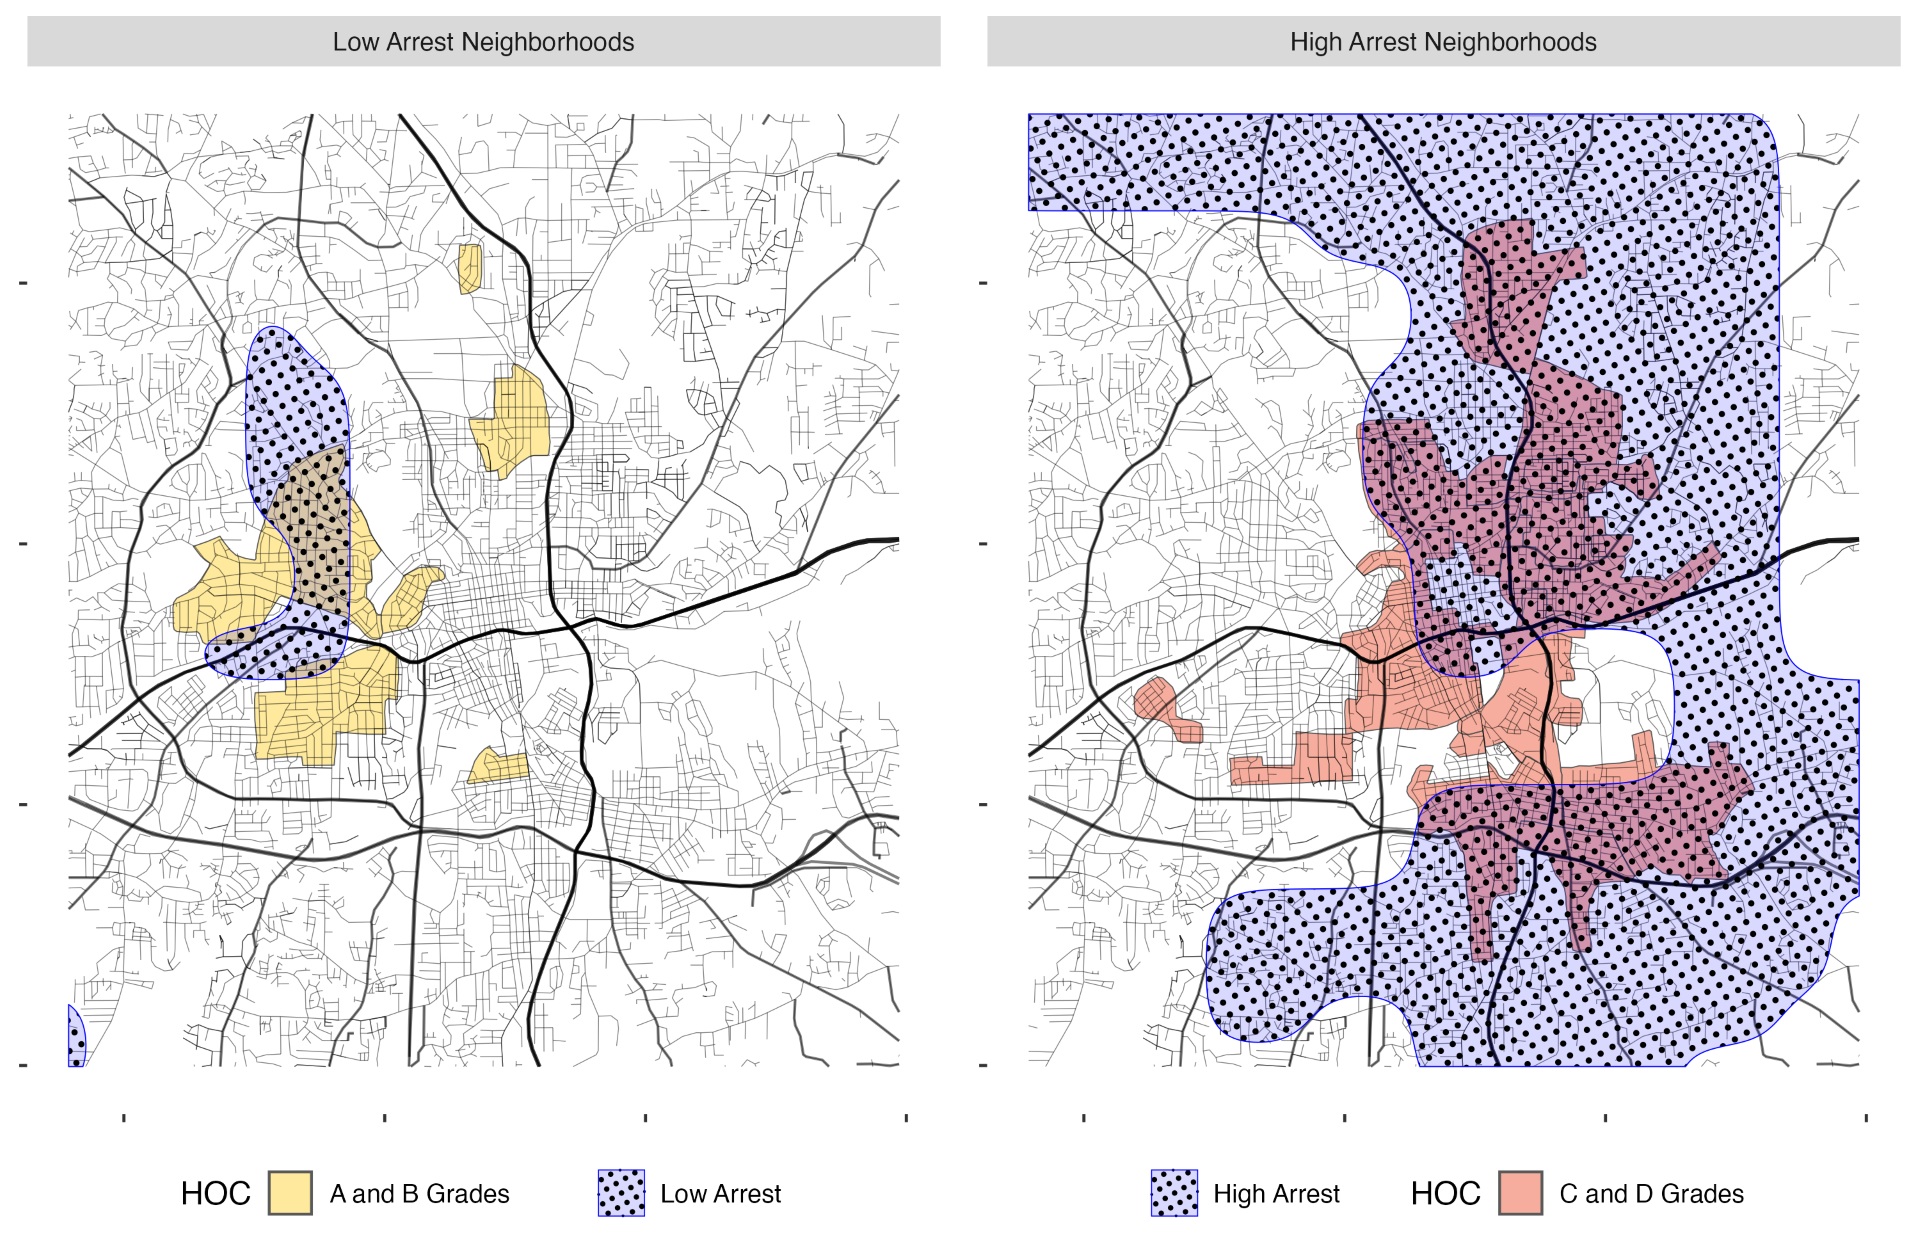
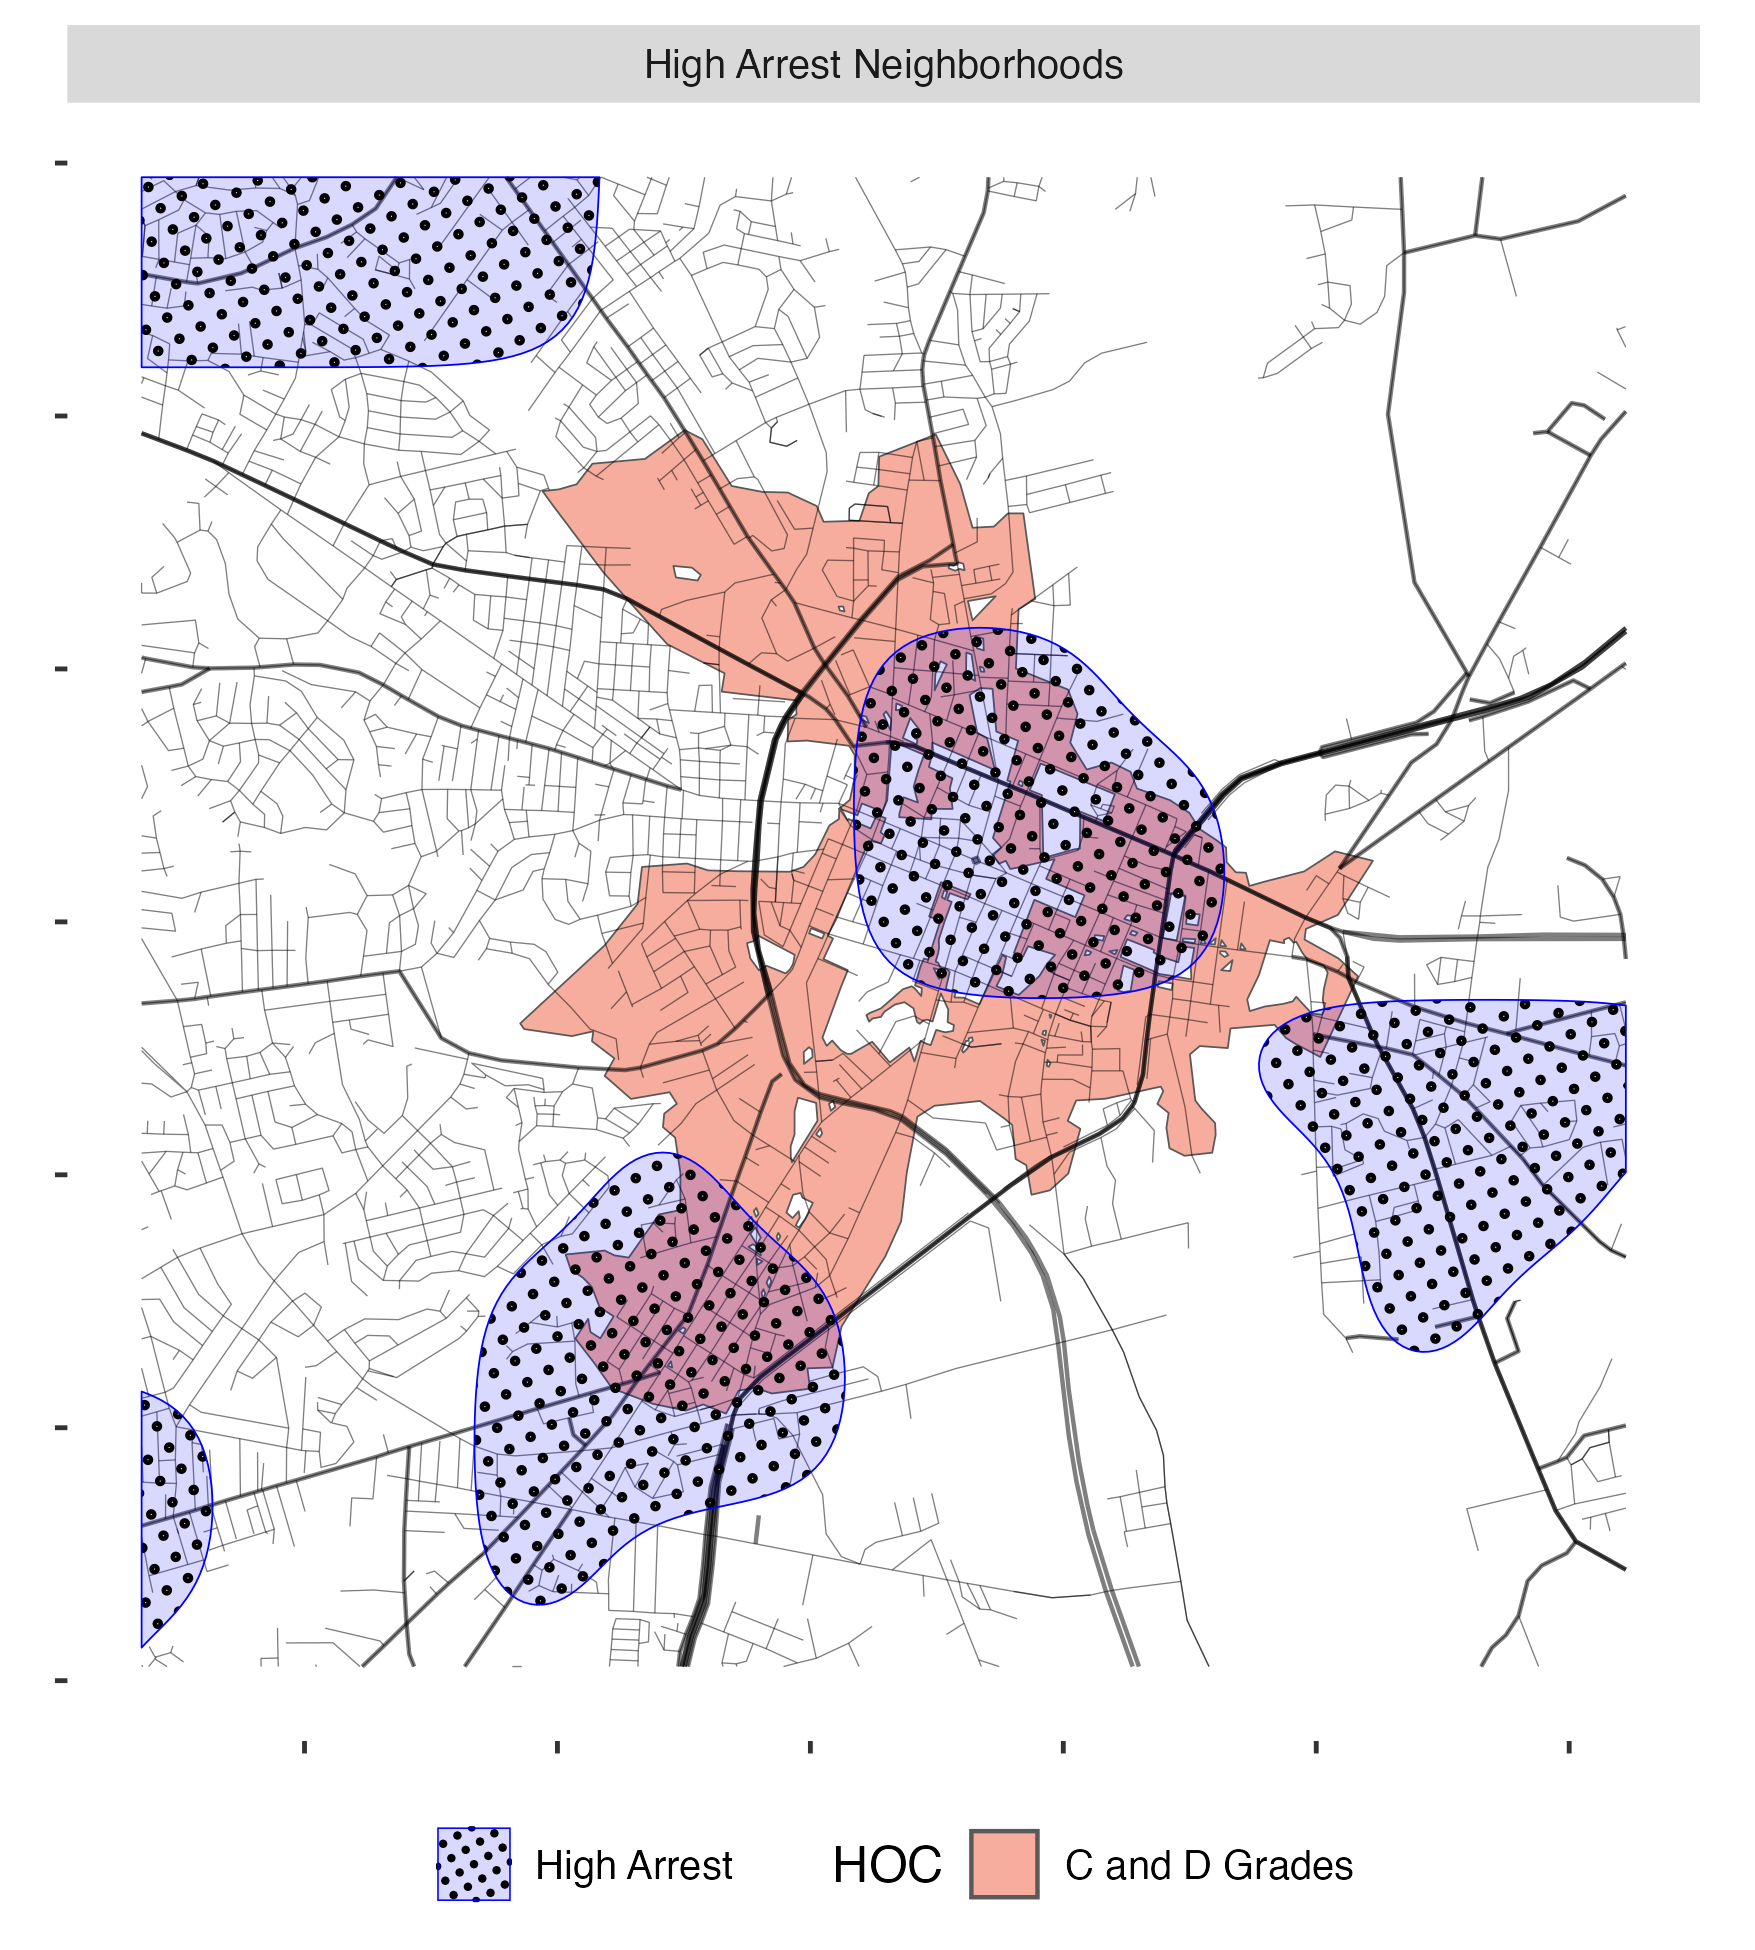
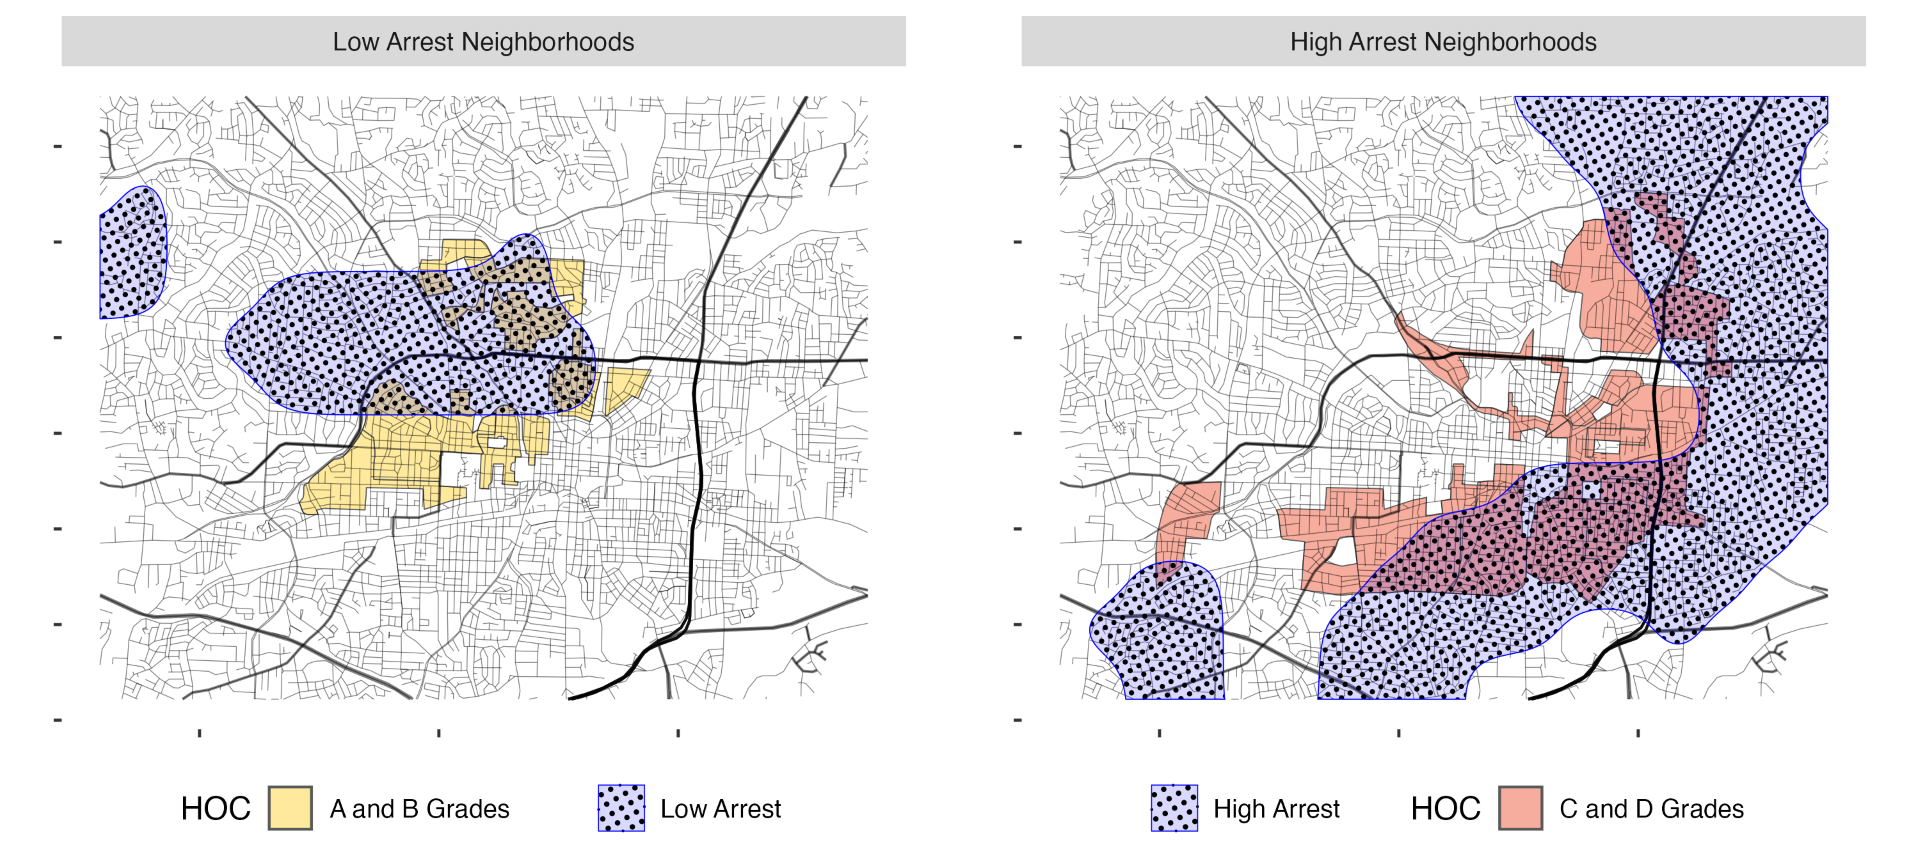
If available, we also replicate here our maps showing the rate of arrests per 100 residents, from Chapter 9. These maps outline the "high" and "low" arrest areas, and overlay these with the corresponding neighborhoods from the HOLC maps, "A" and "B-grade" corresponding to the low arrest areas, and "C" or "D" grade corresponding with the high arrest areas. Note that this is available only for some of the larger cities. Also note that the Richmond team was not able to locate any historical map for the city of Raleigh; apparently, all copies were destroyed.
Click on a map to see or download a larger version.
| City | Historic Redlining Map | Arrest Map from Chapter 9 |
|---|---|---|
| Asheville | 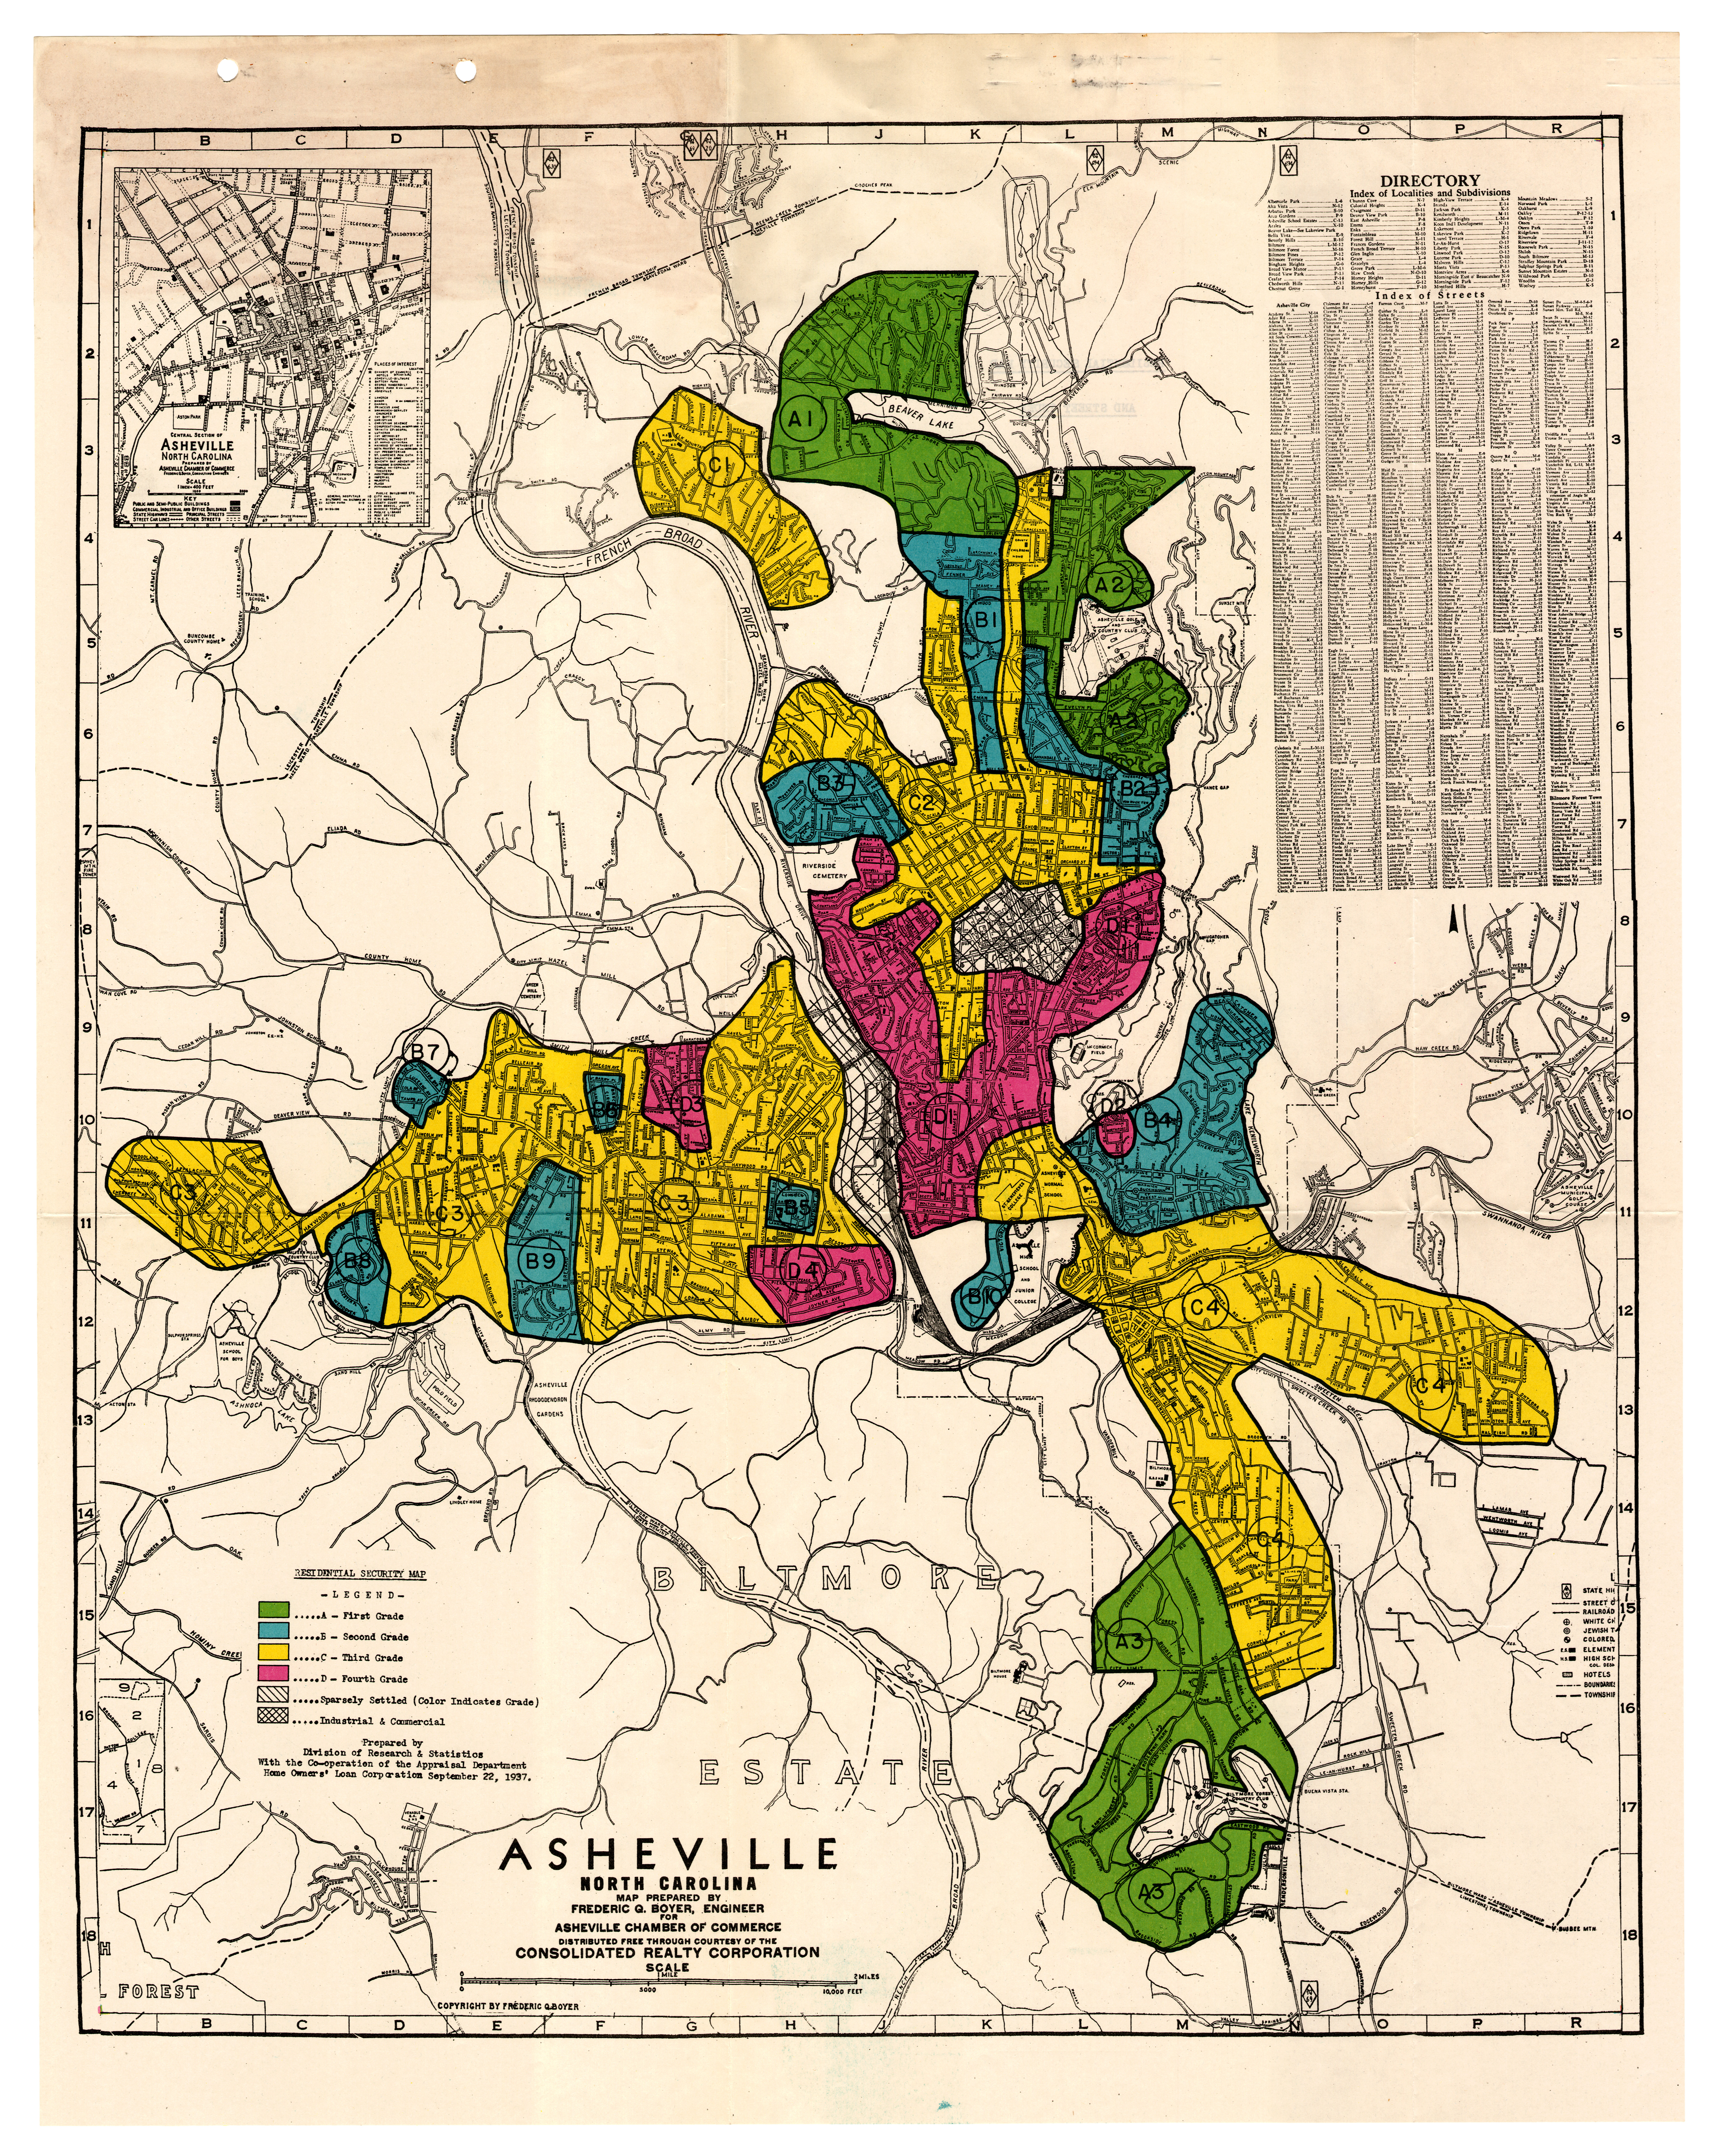 |
|
| Charlotte | 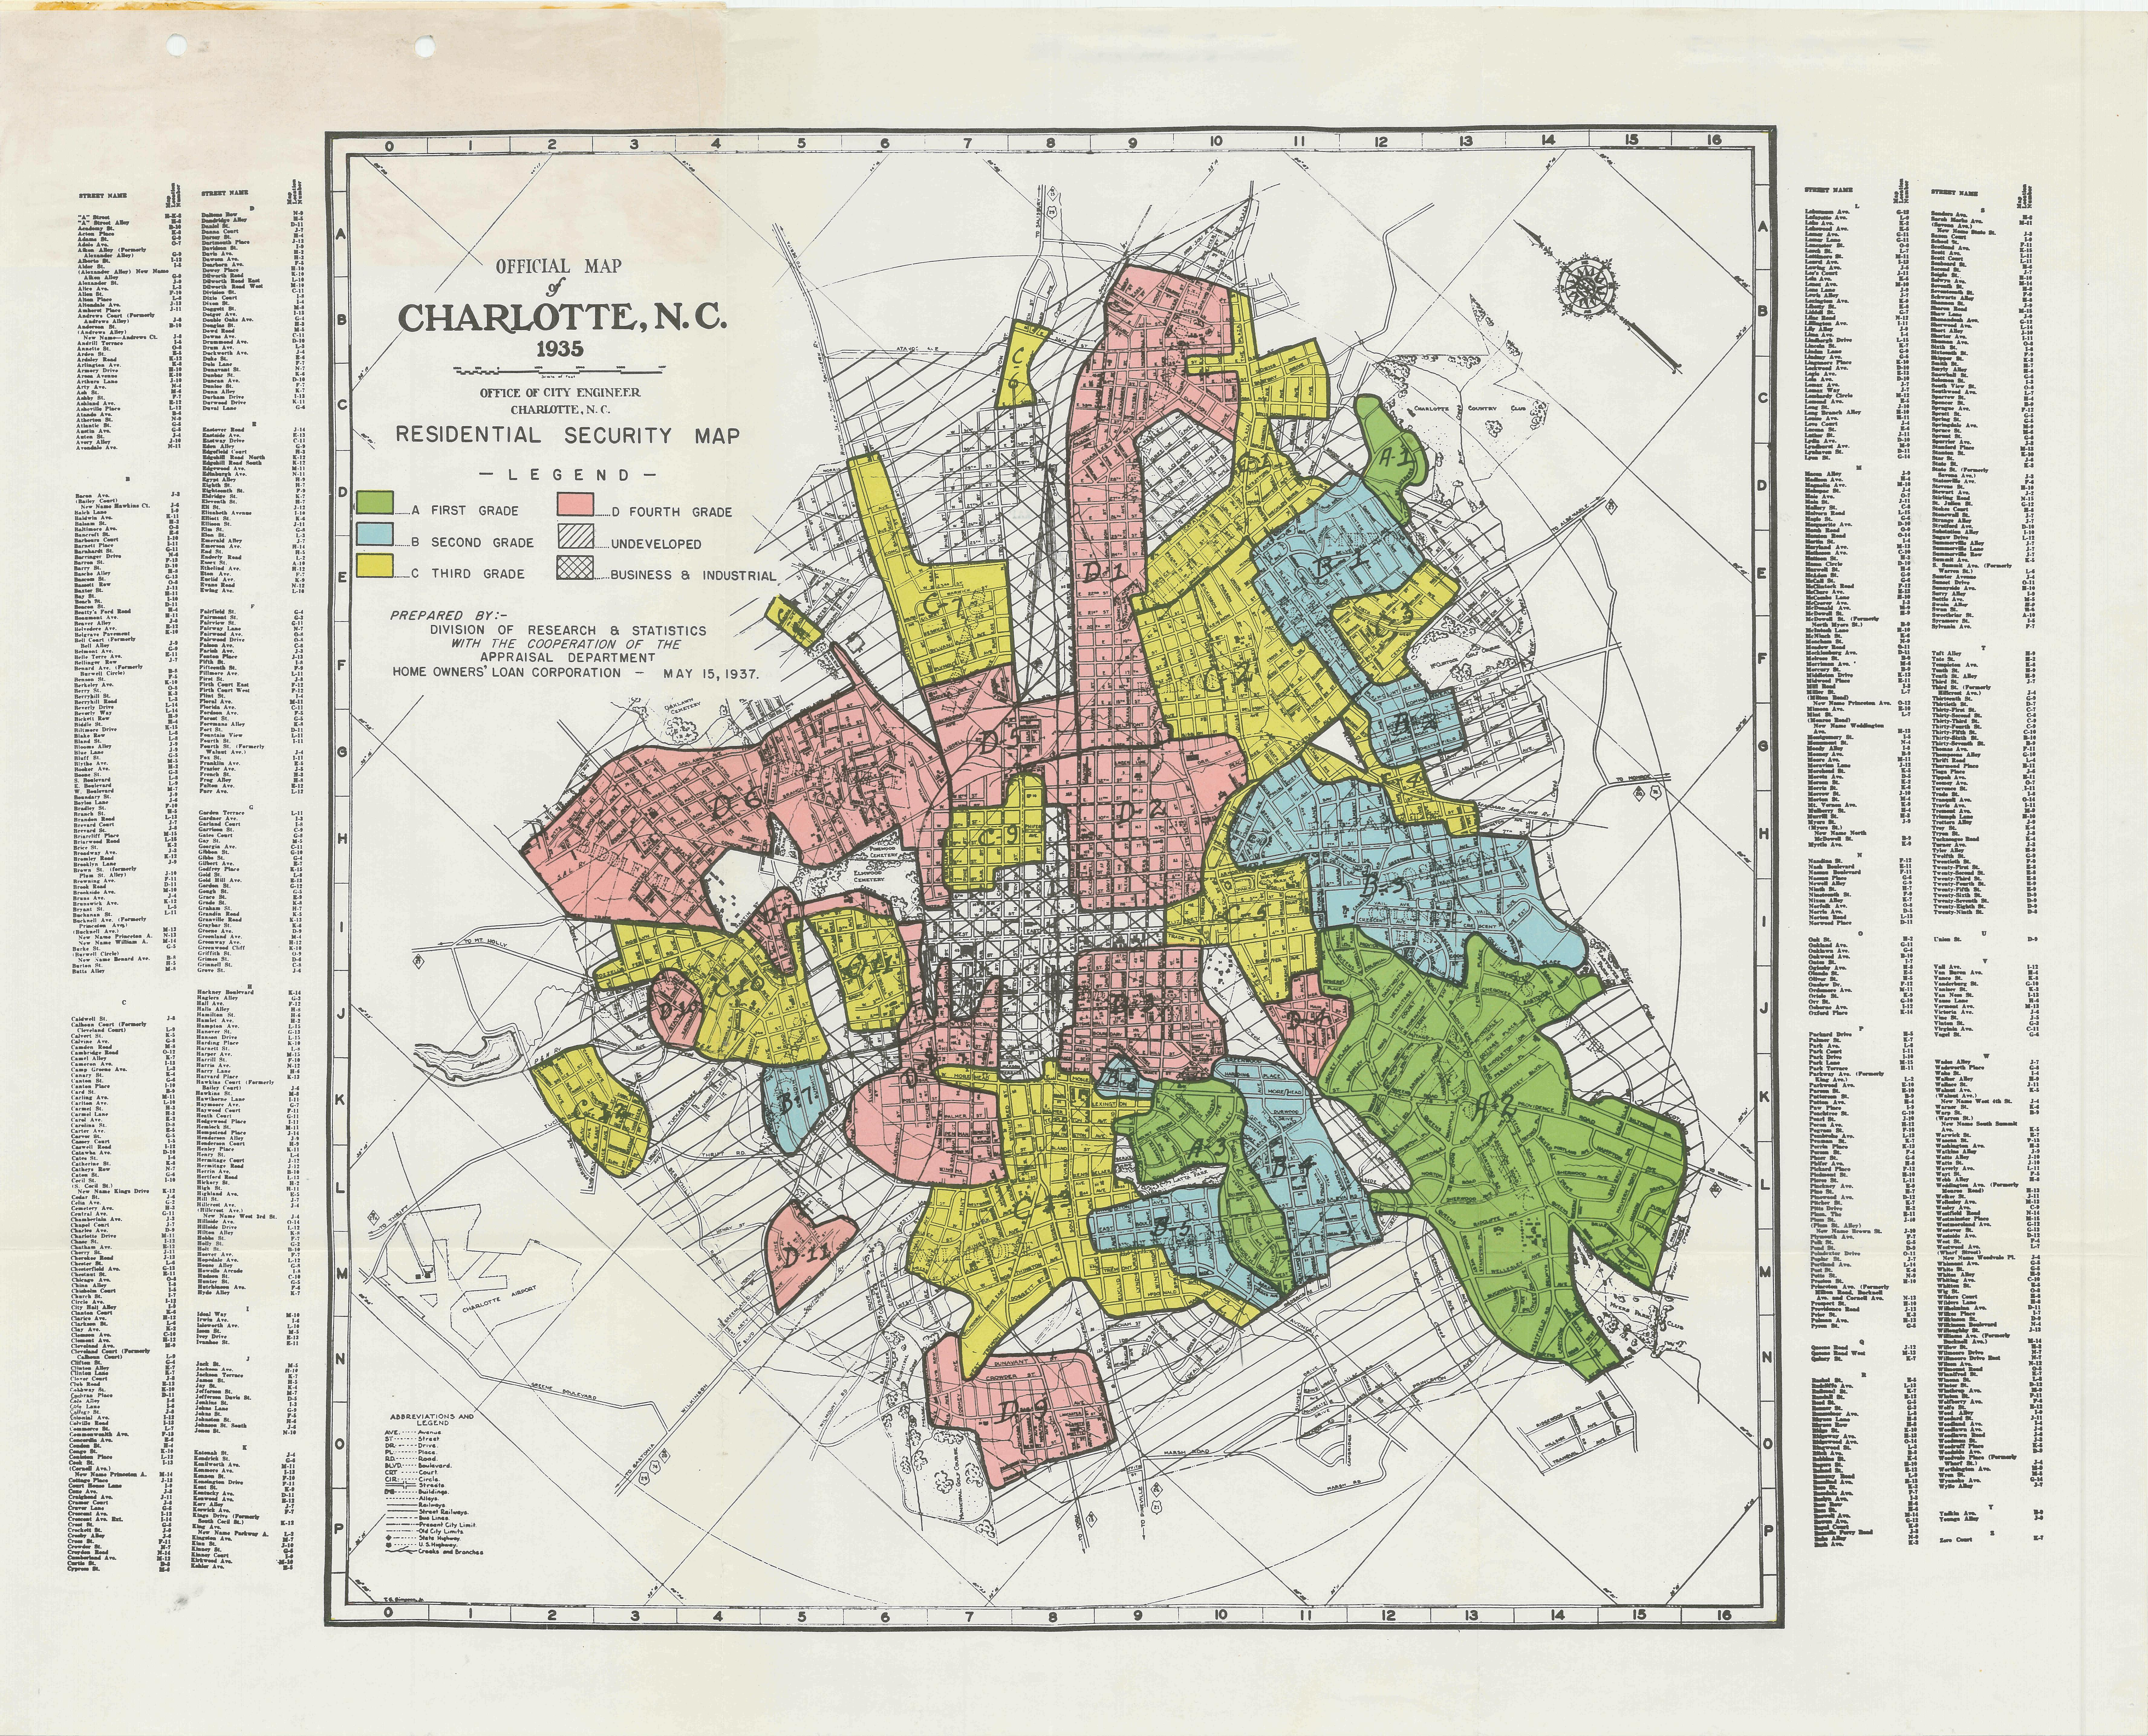 |
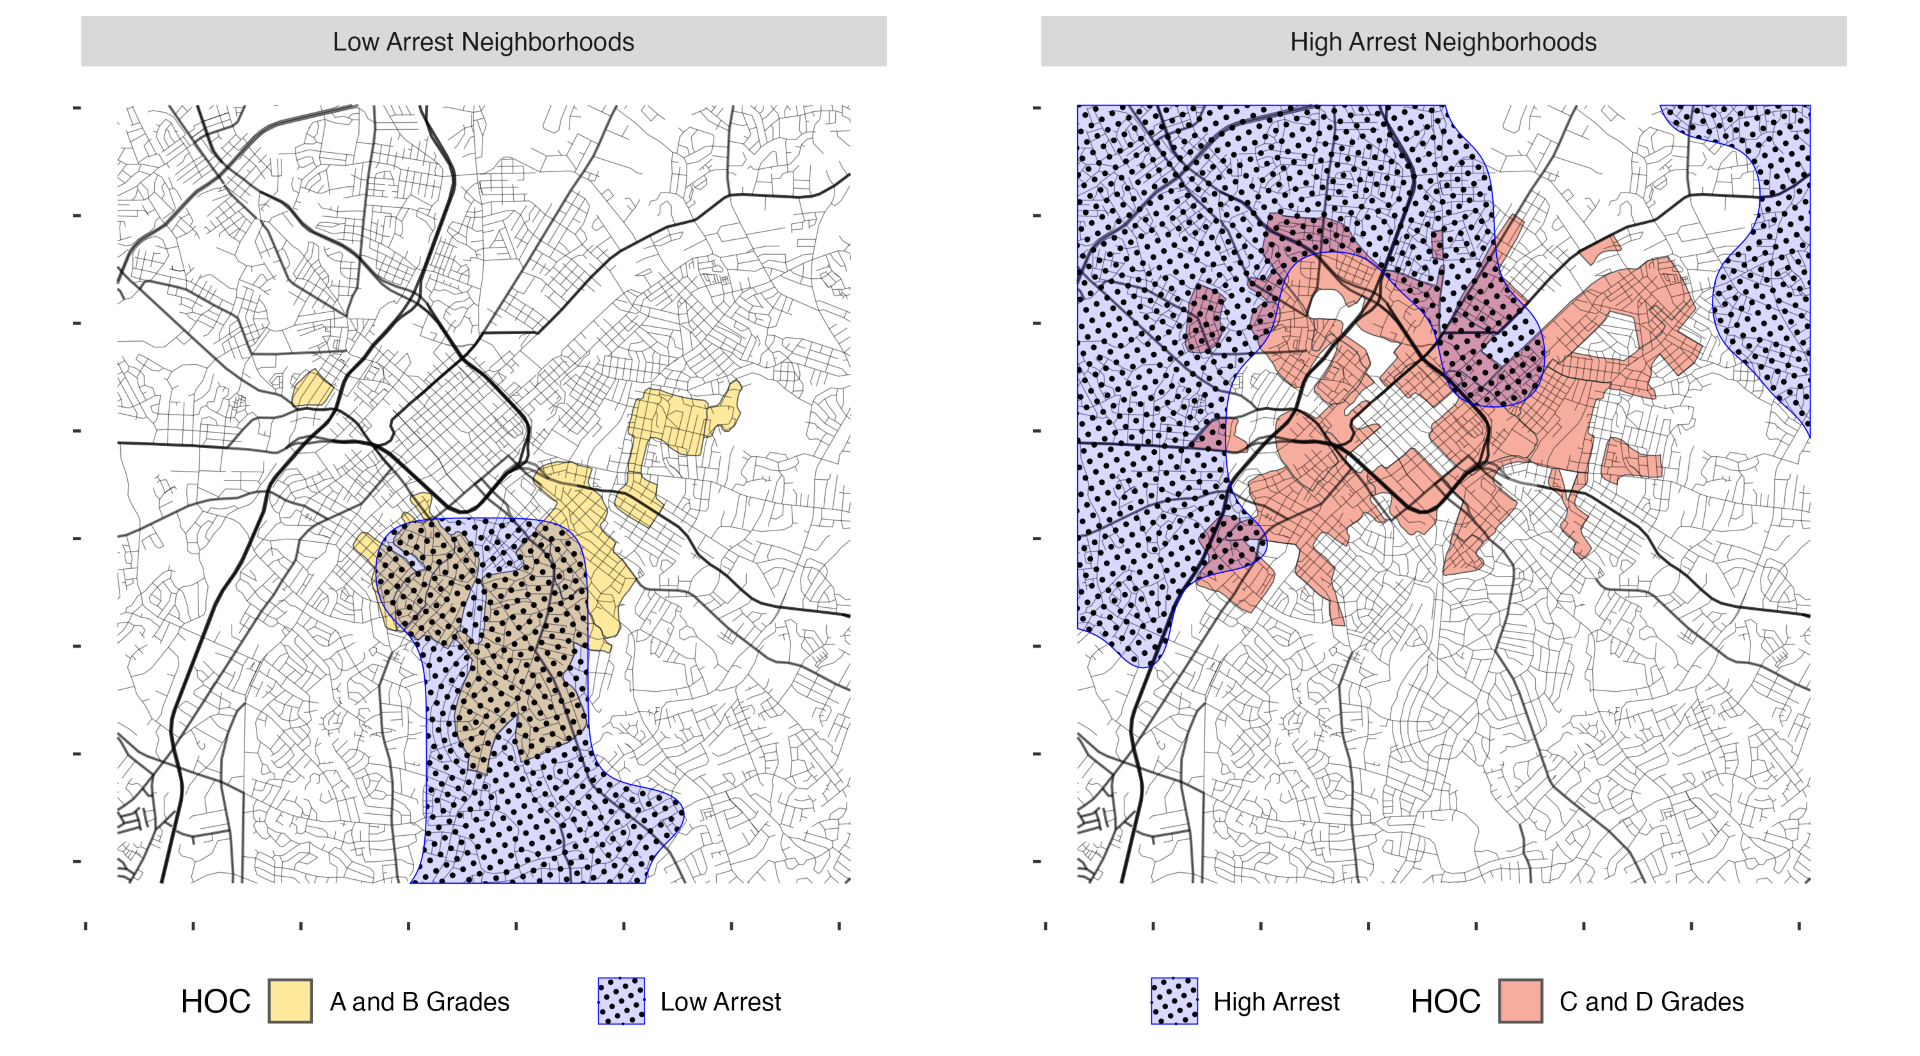
|
| Durham | 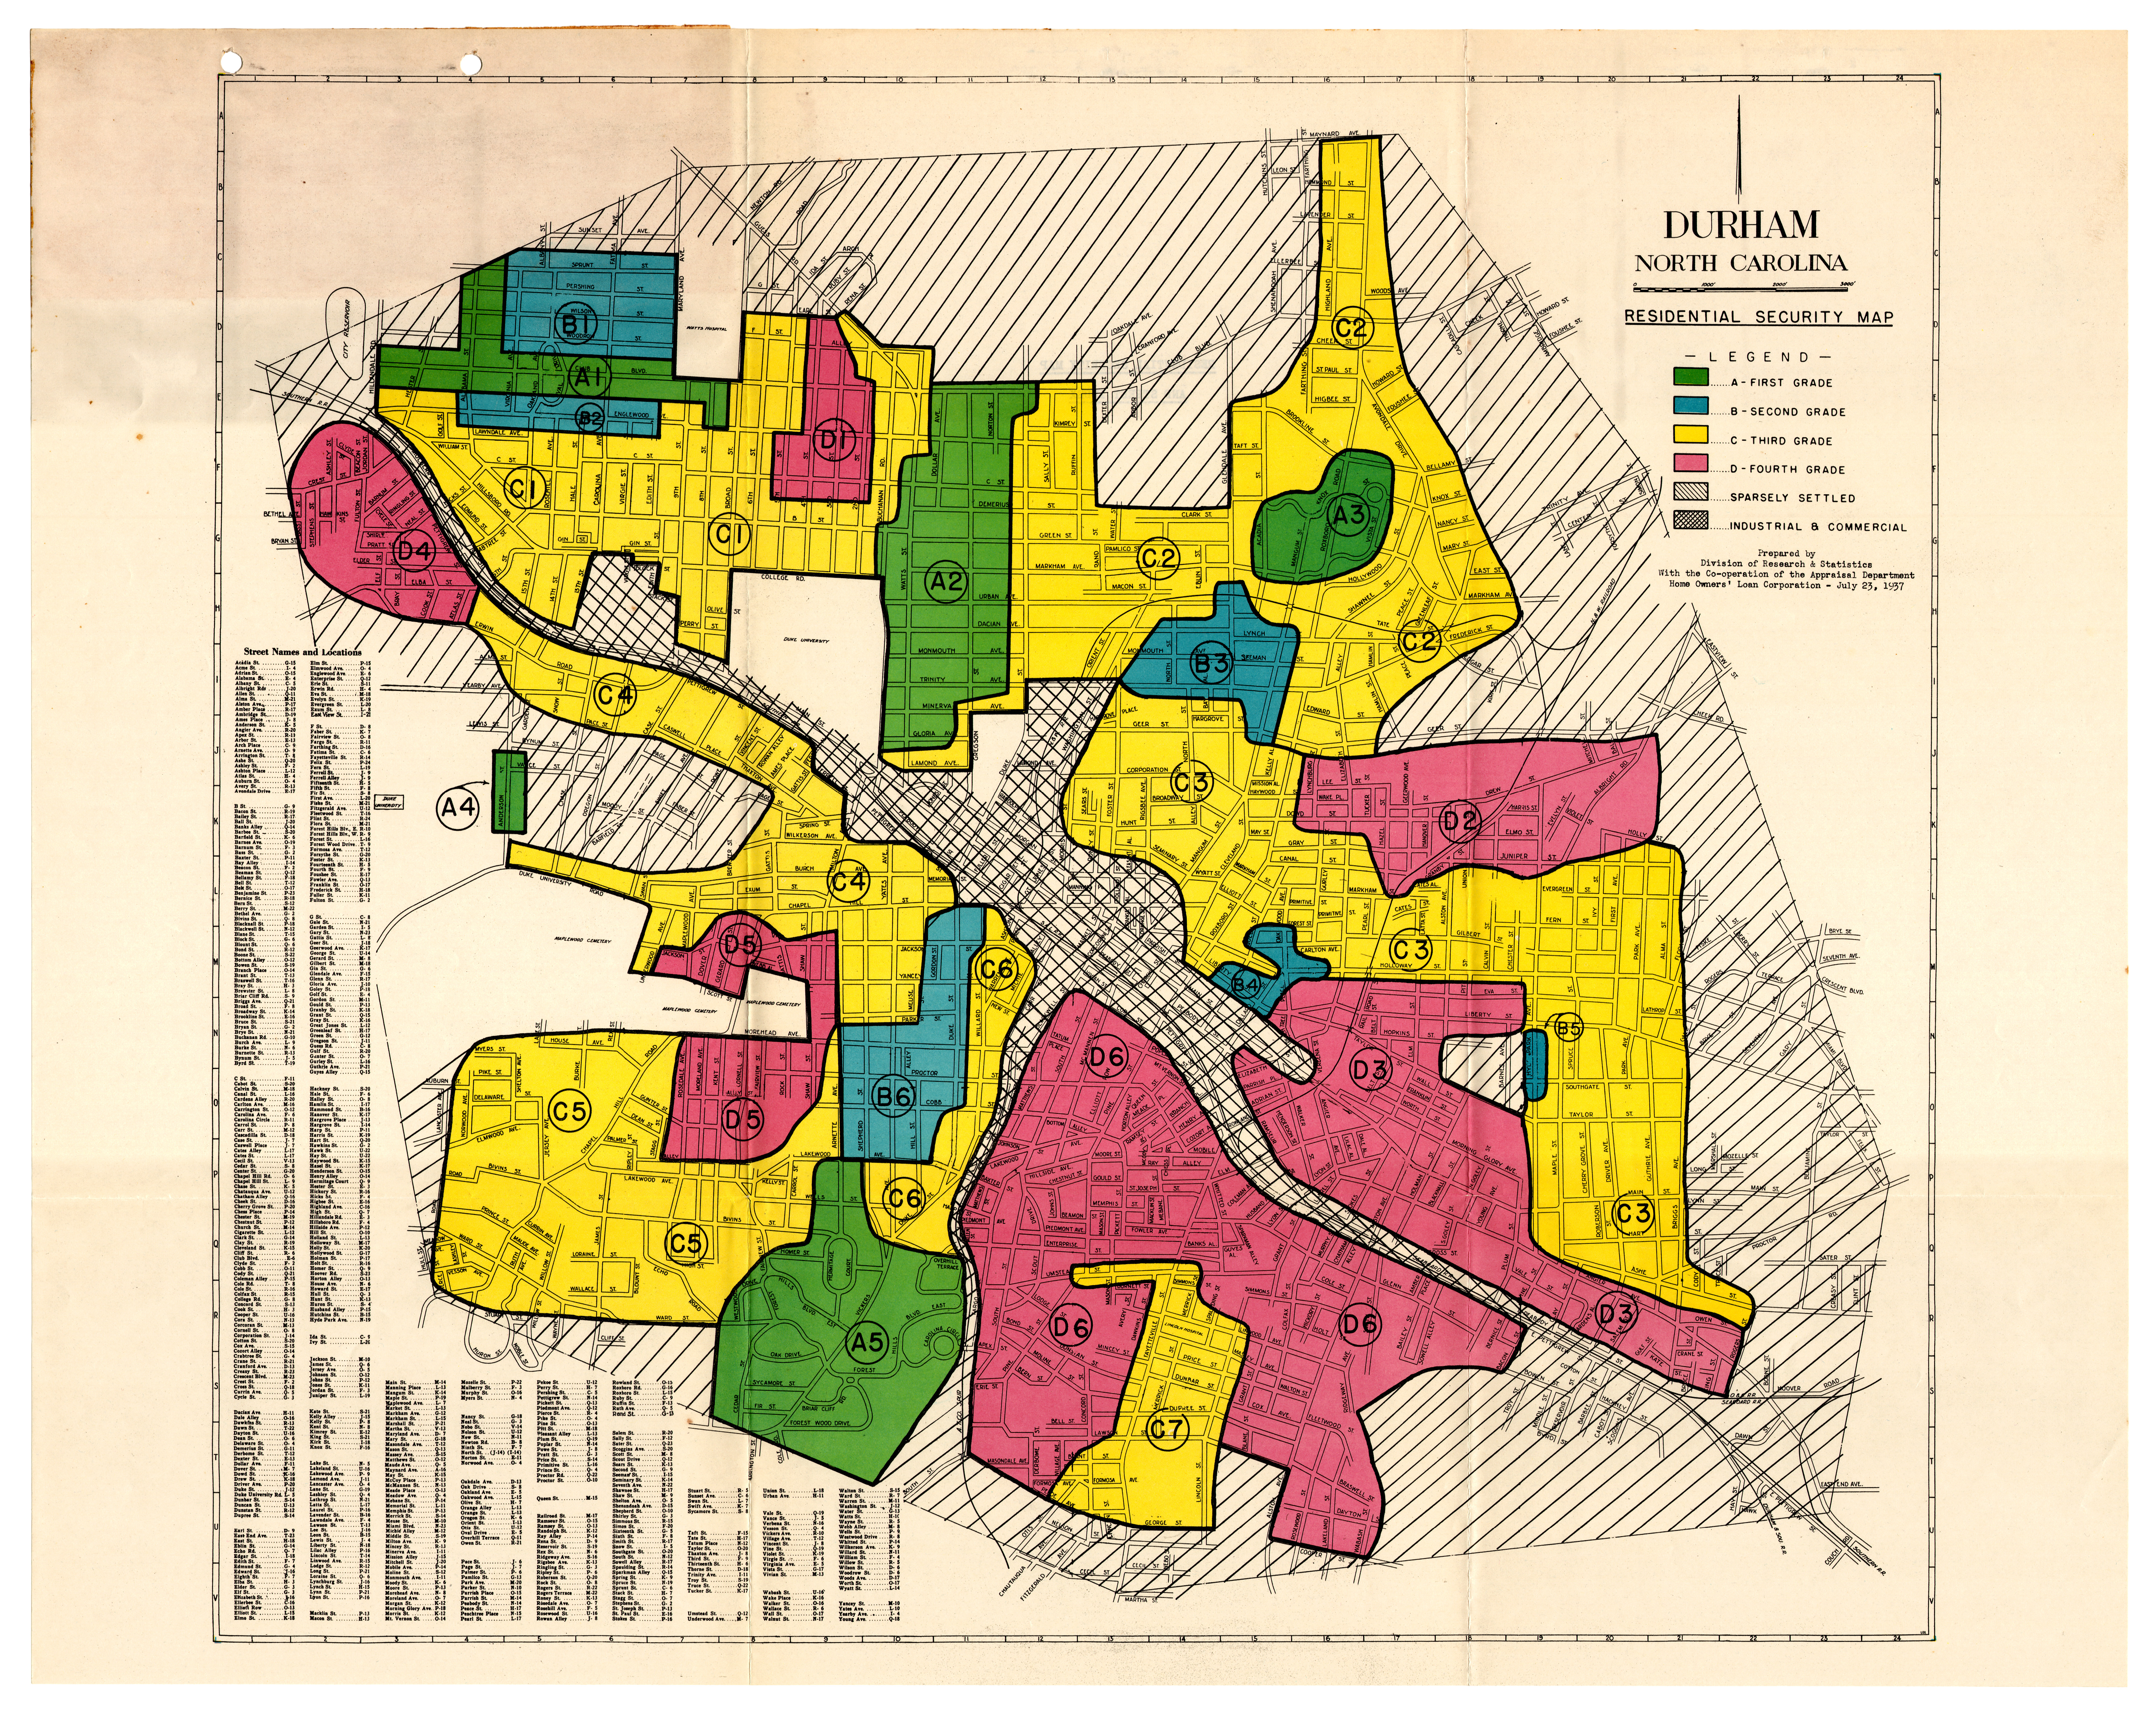 |
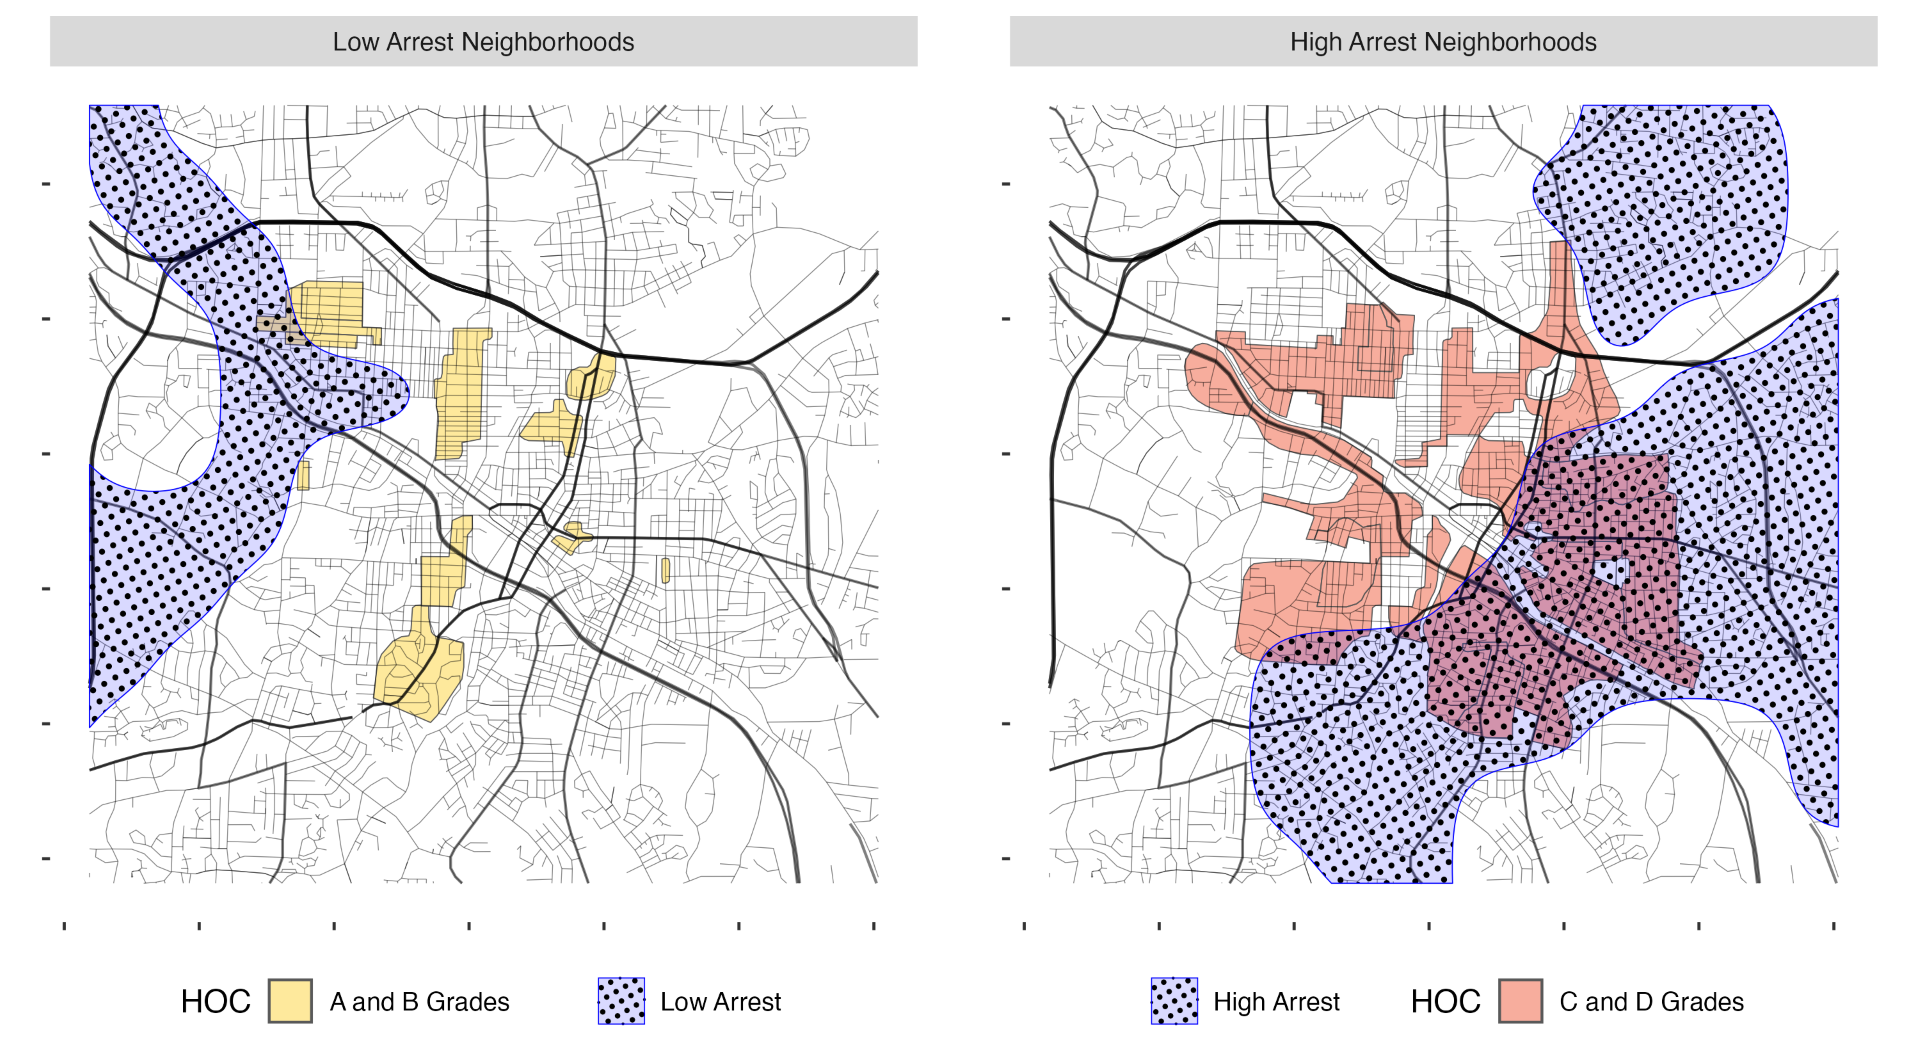
|
| Elizabeth City | 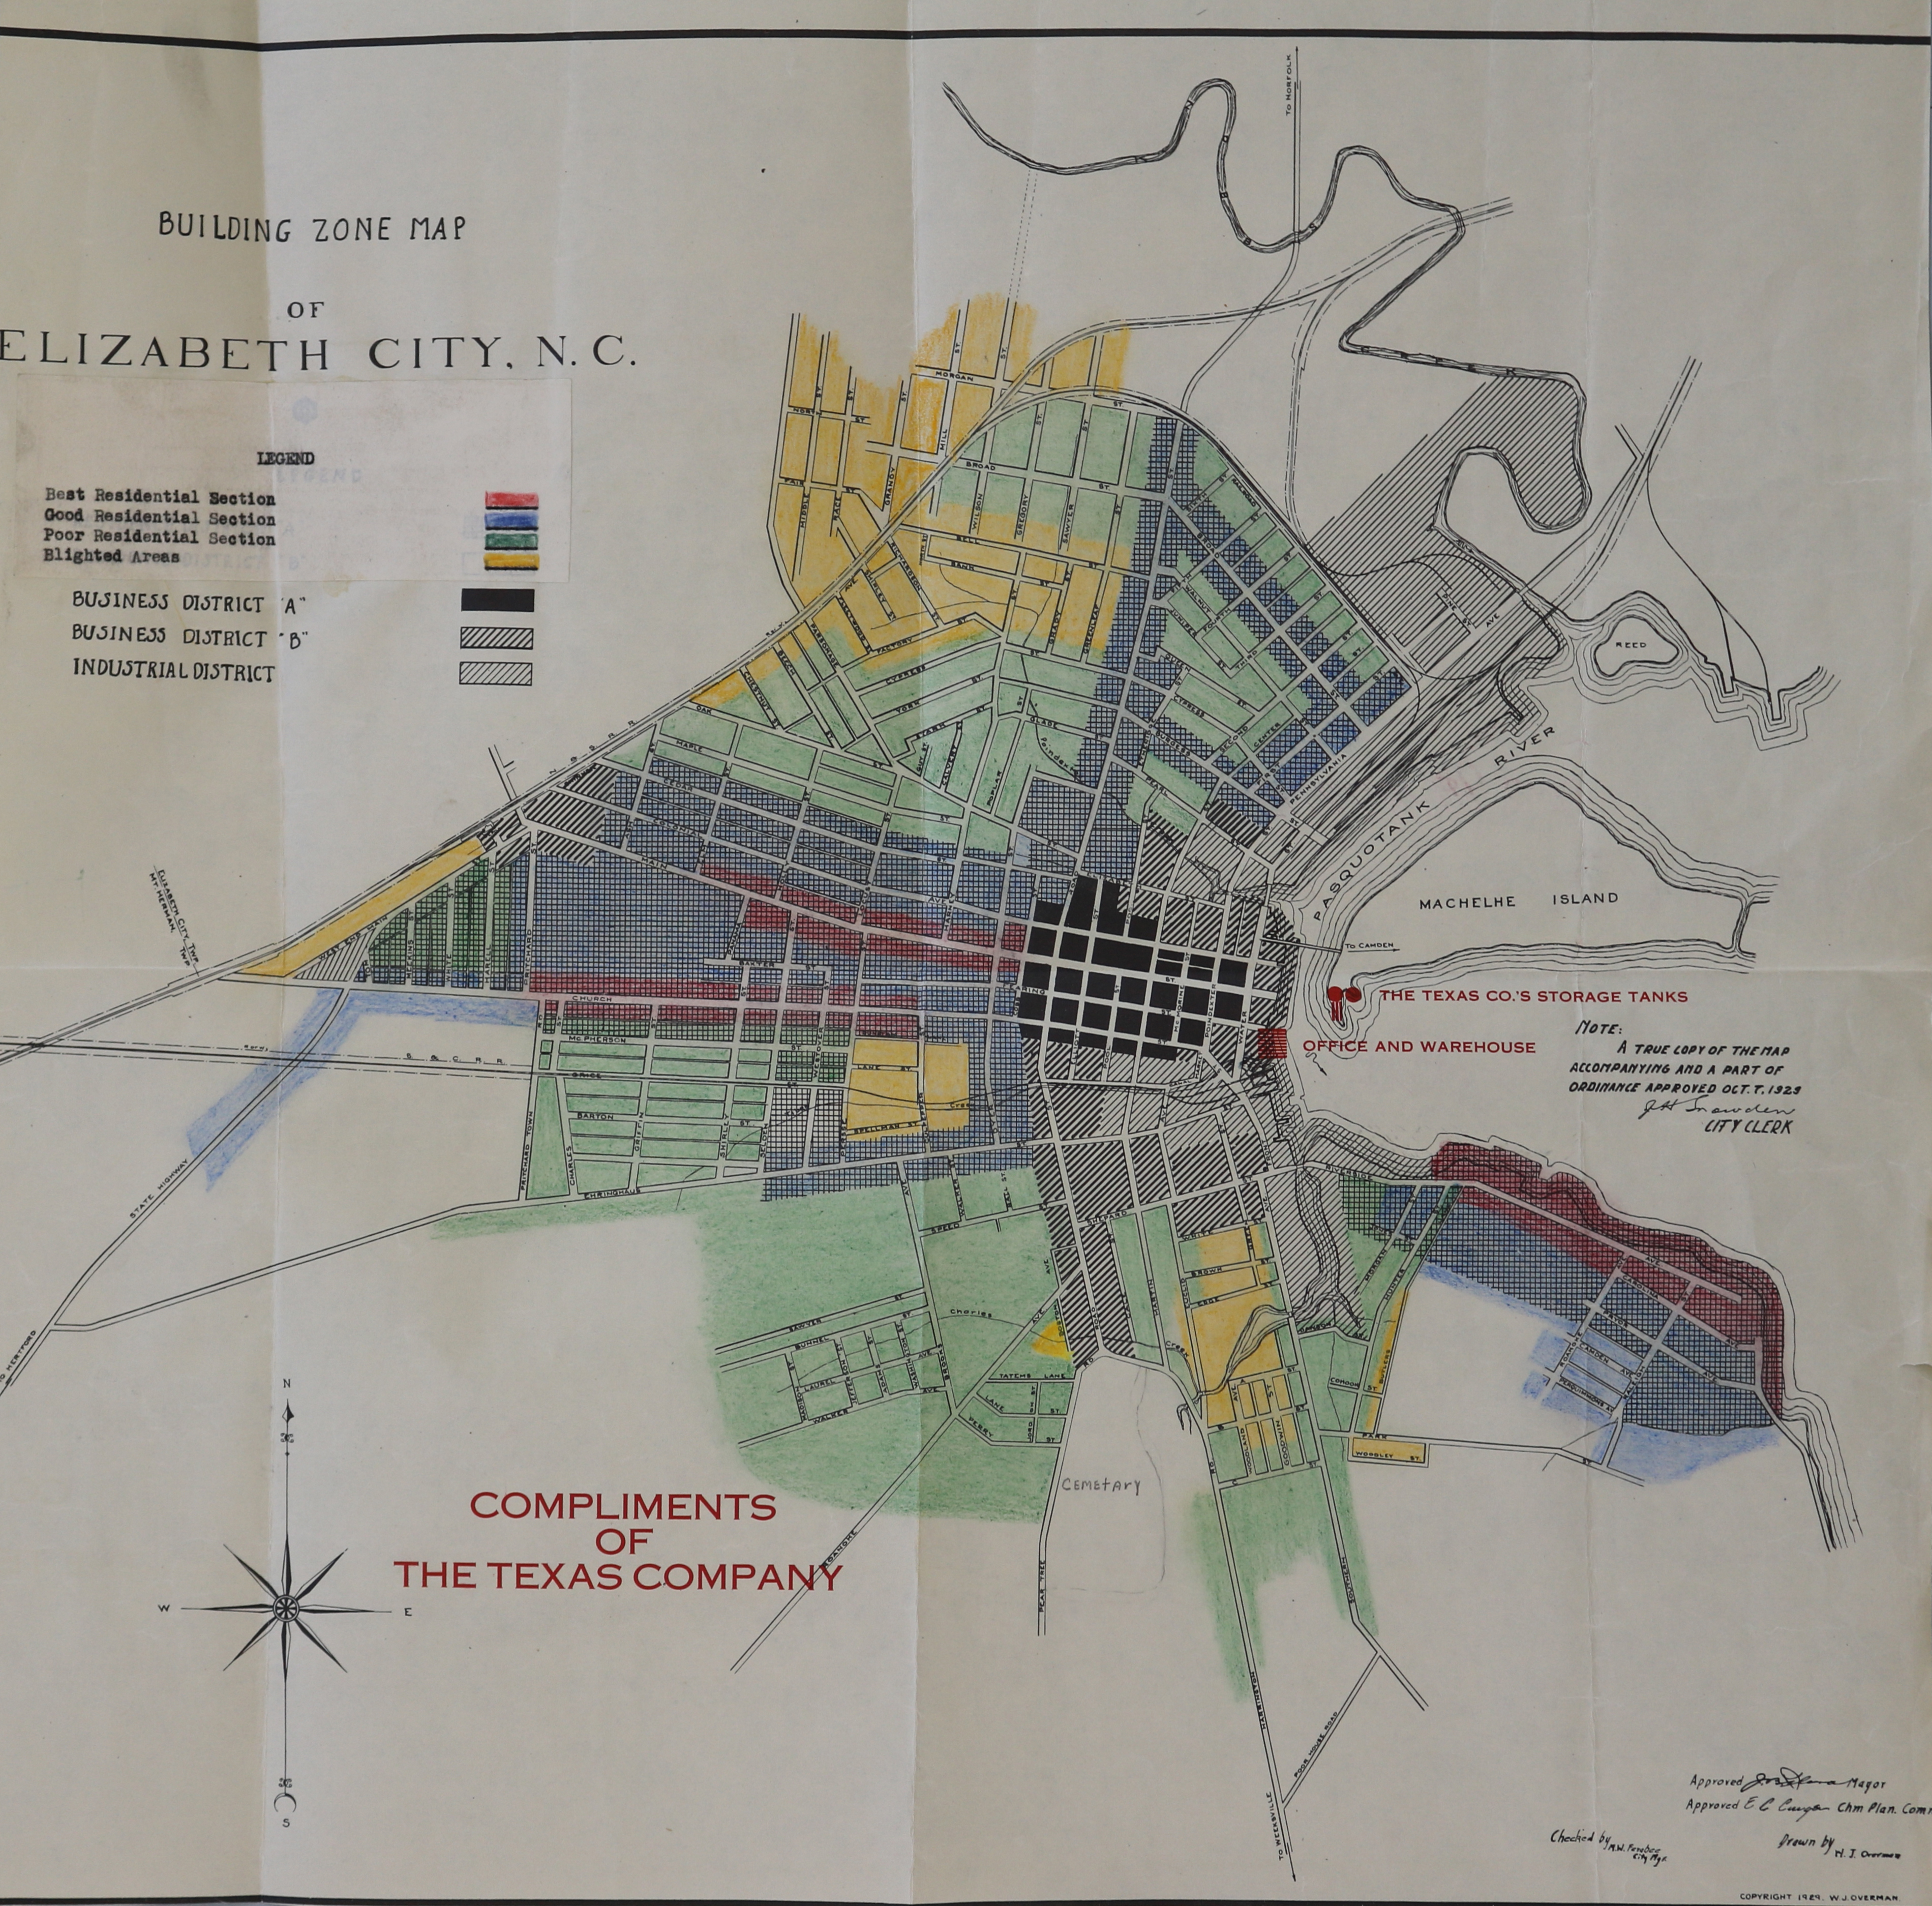 |
|
| Fayetteville | 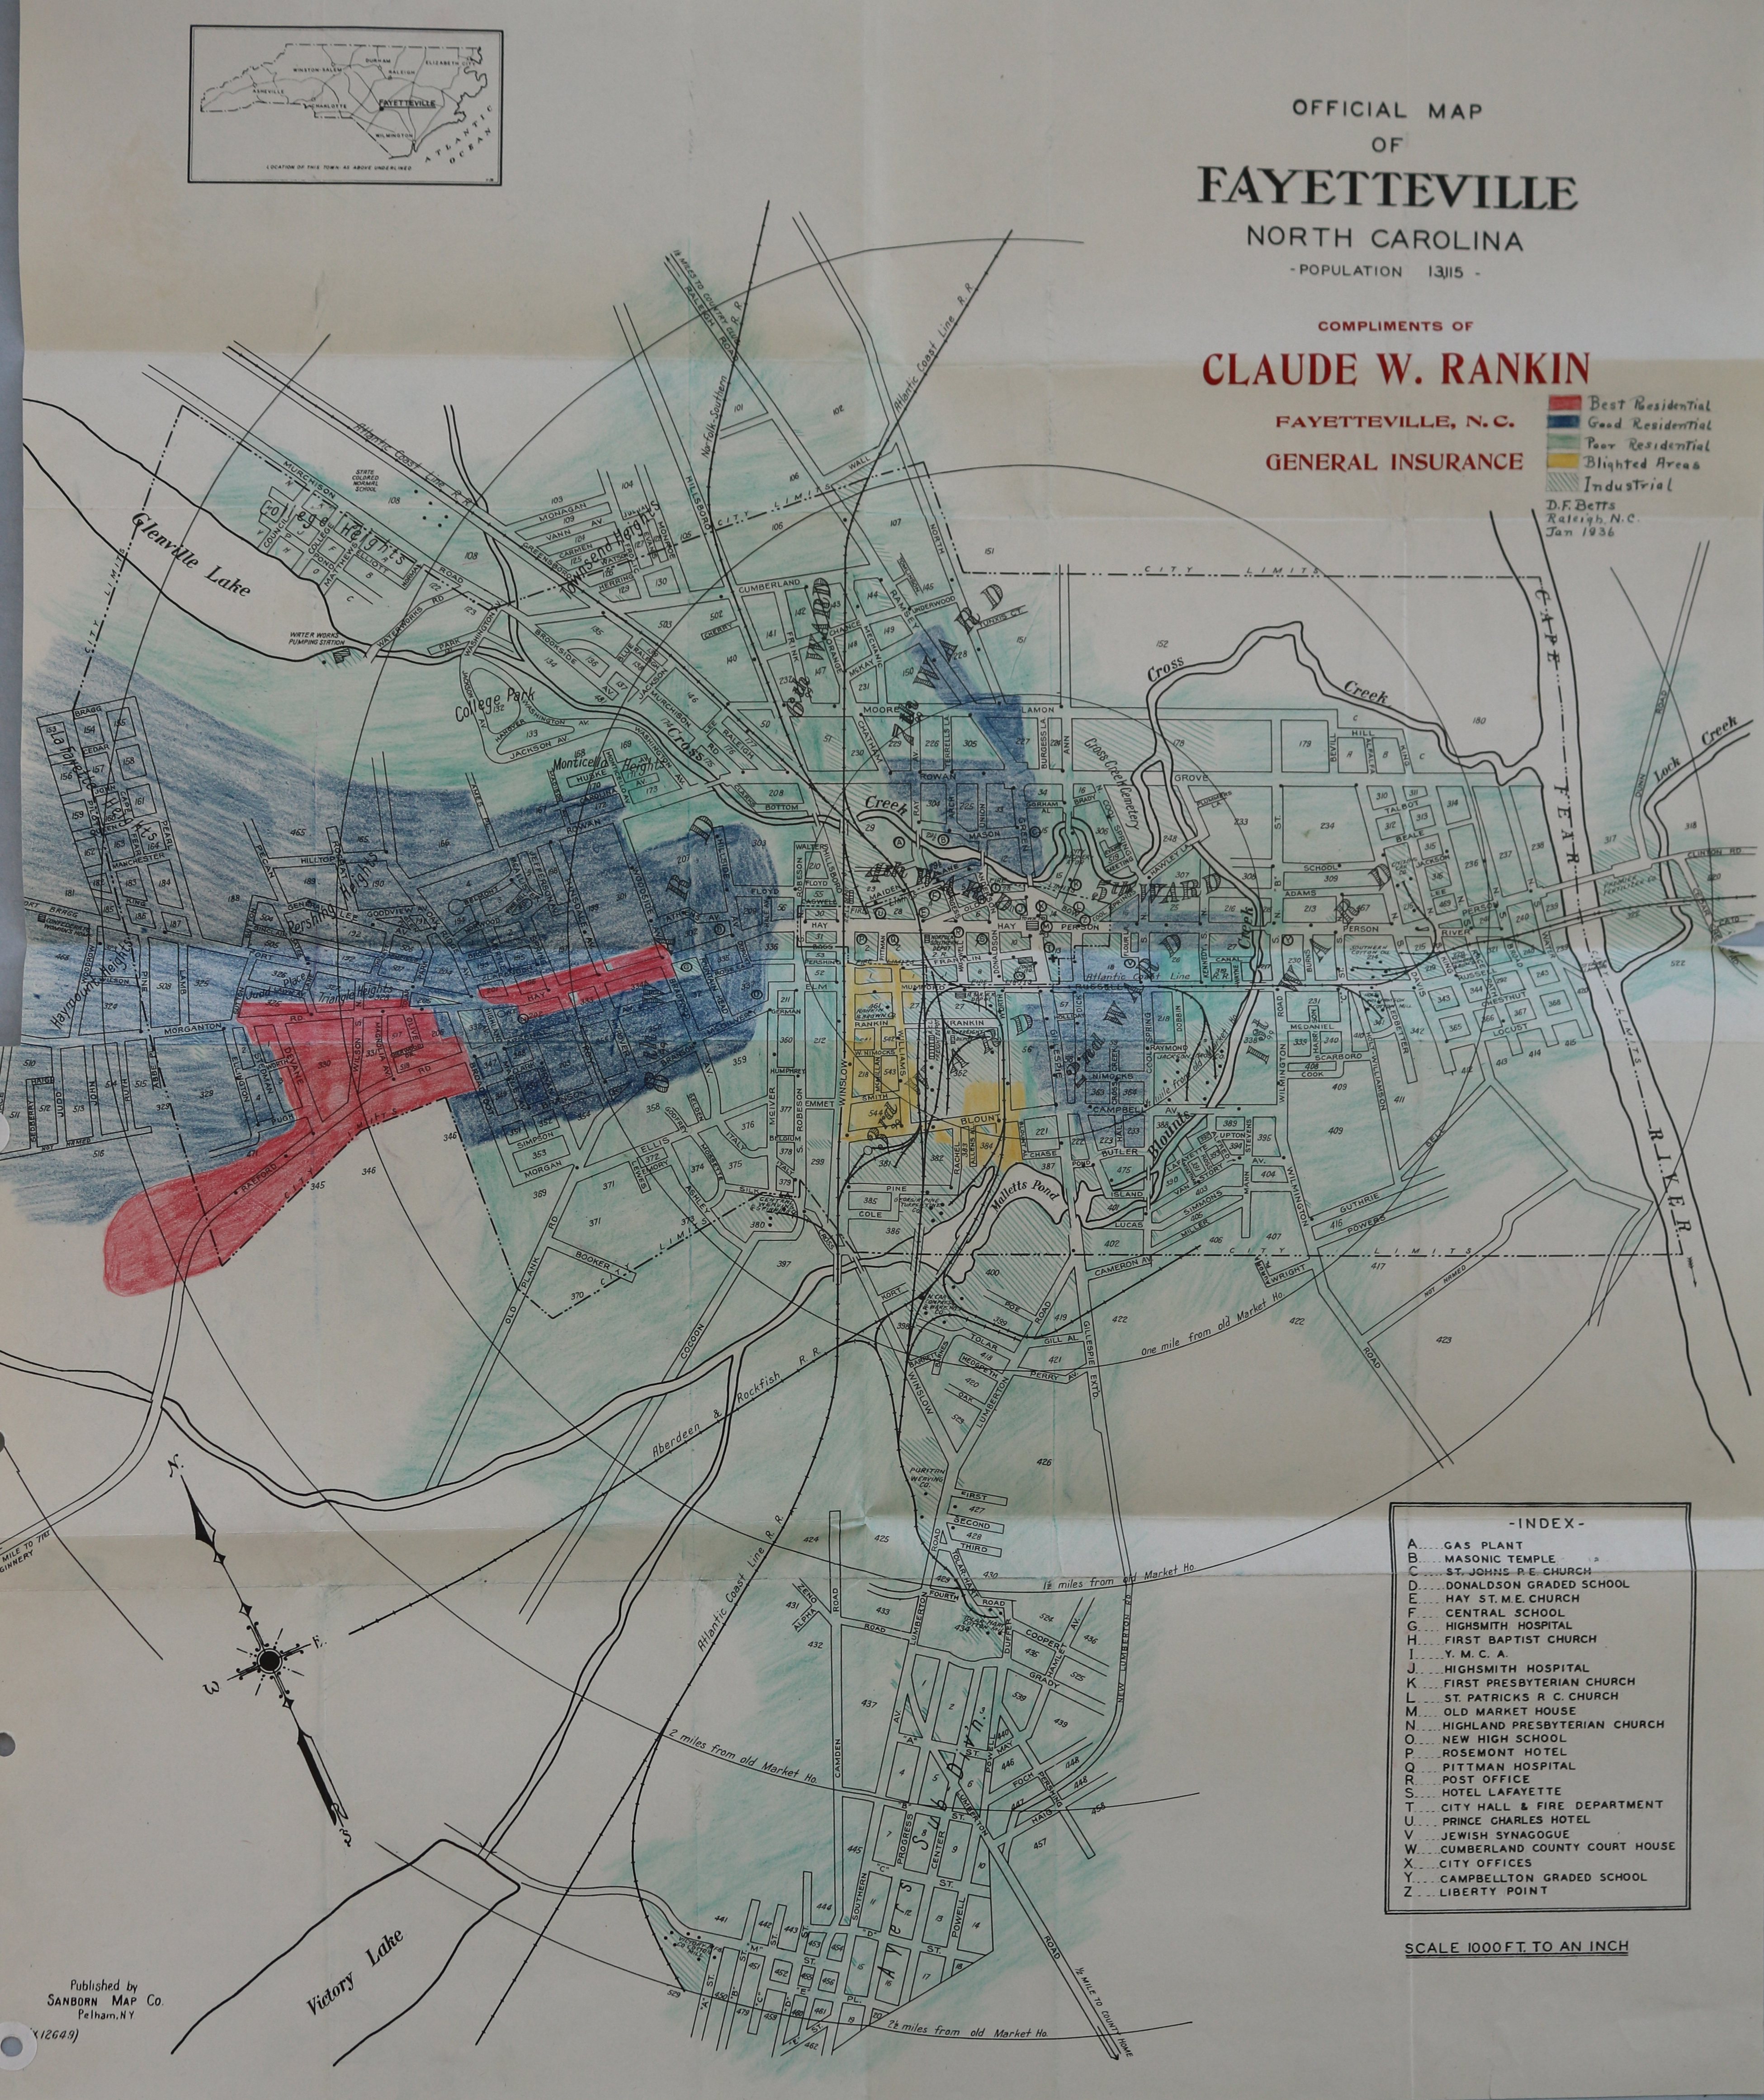 |
|
| Goldsboro | 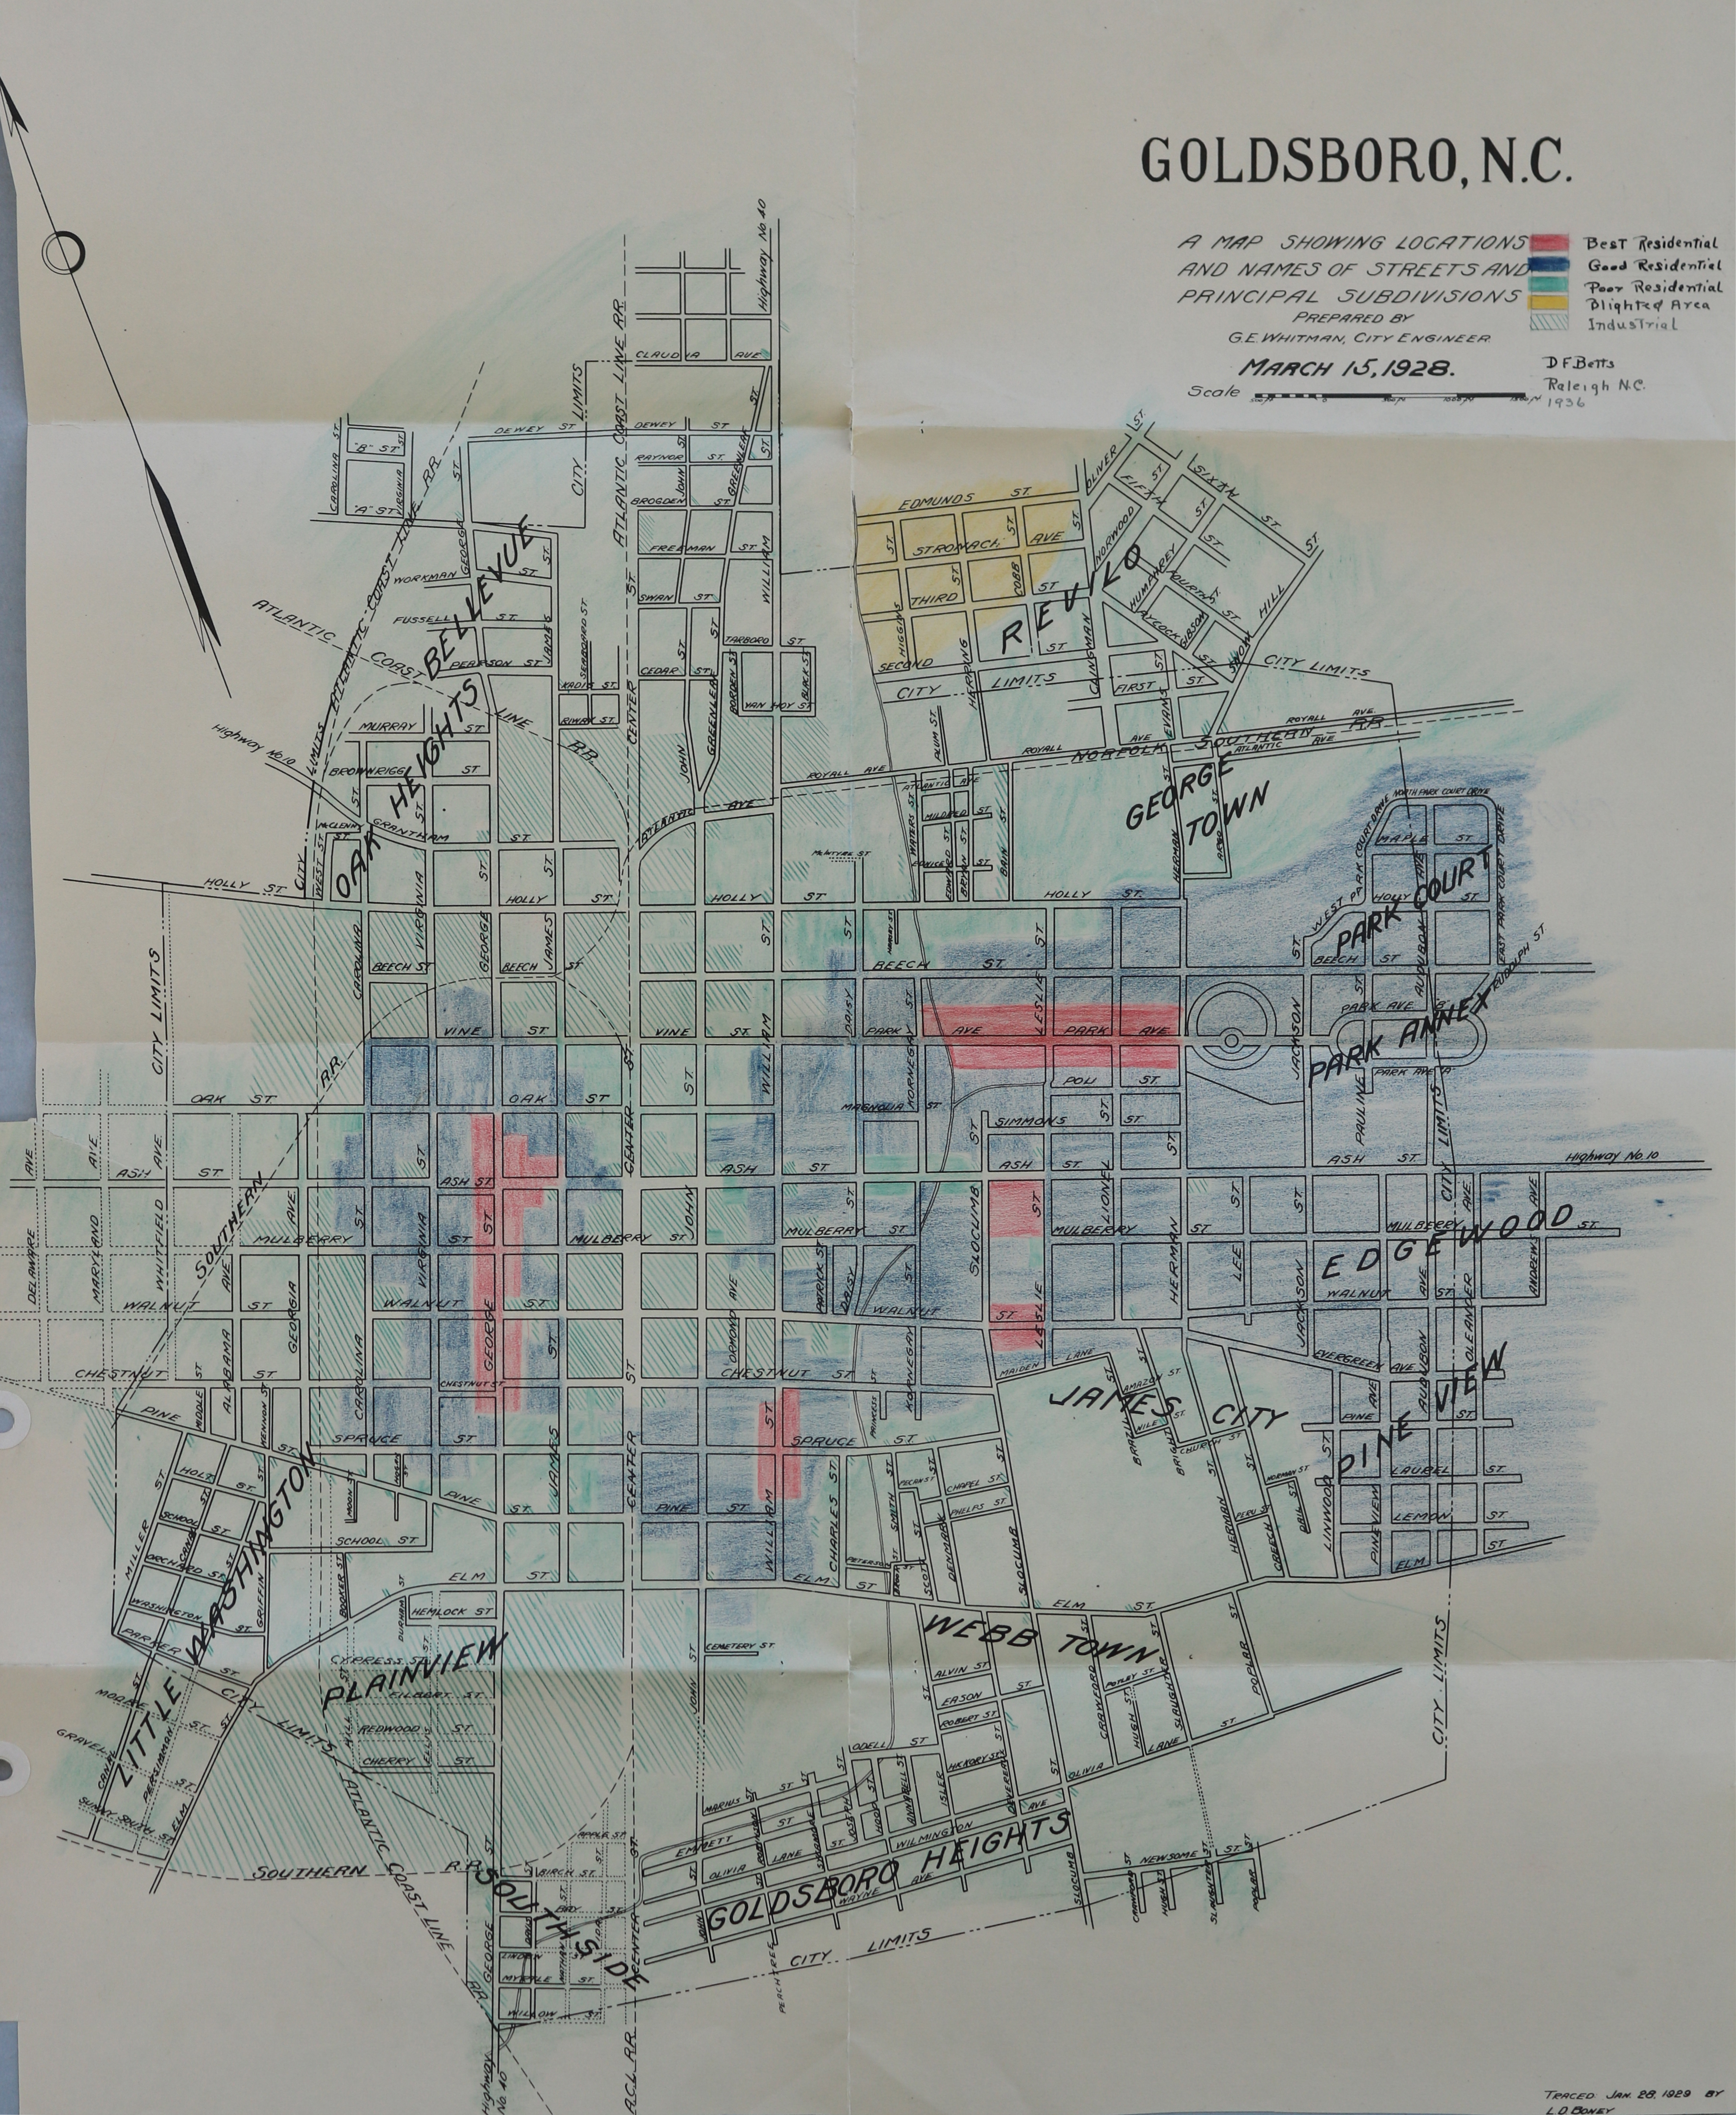 |
|
| Greensboro | 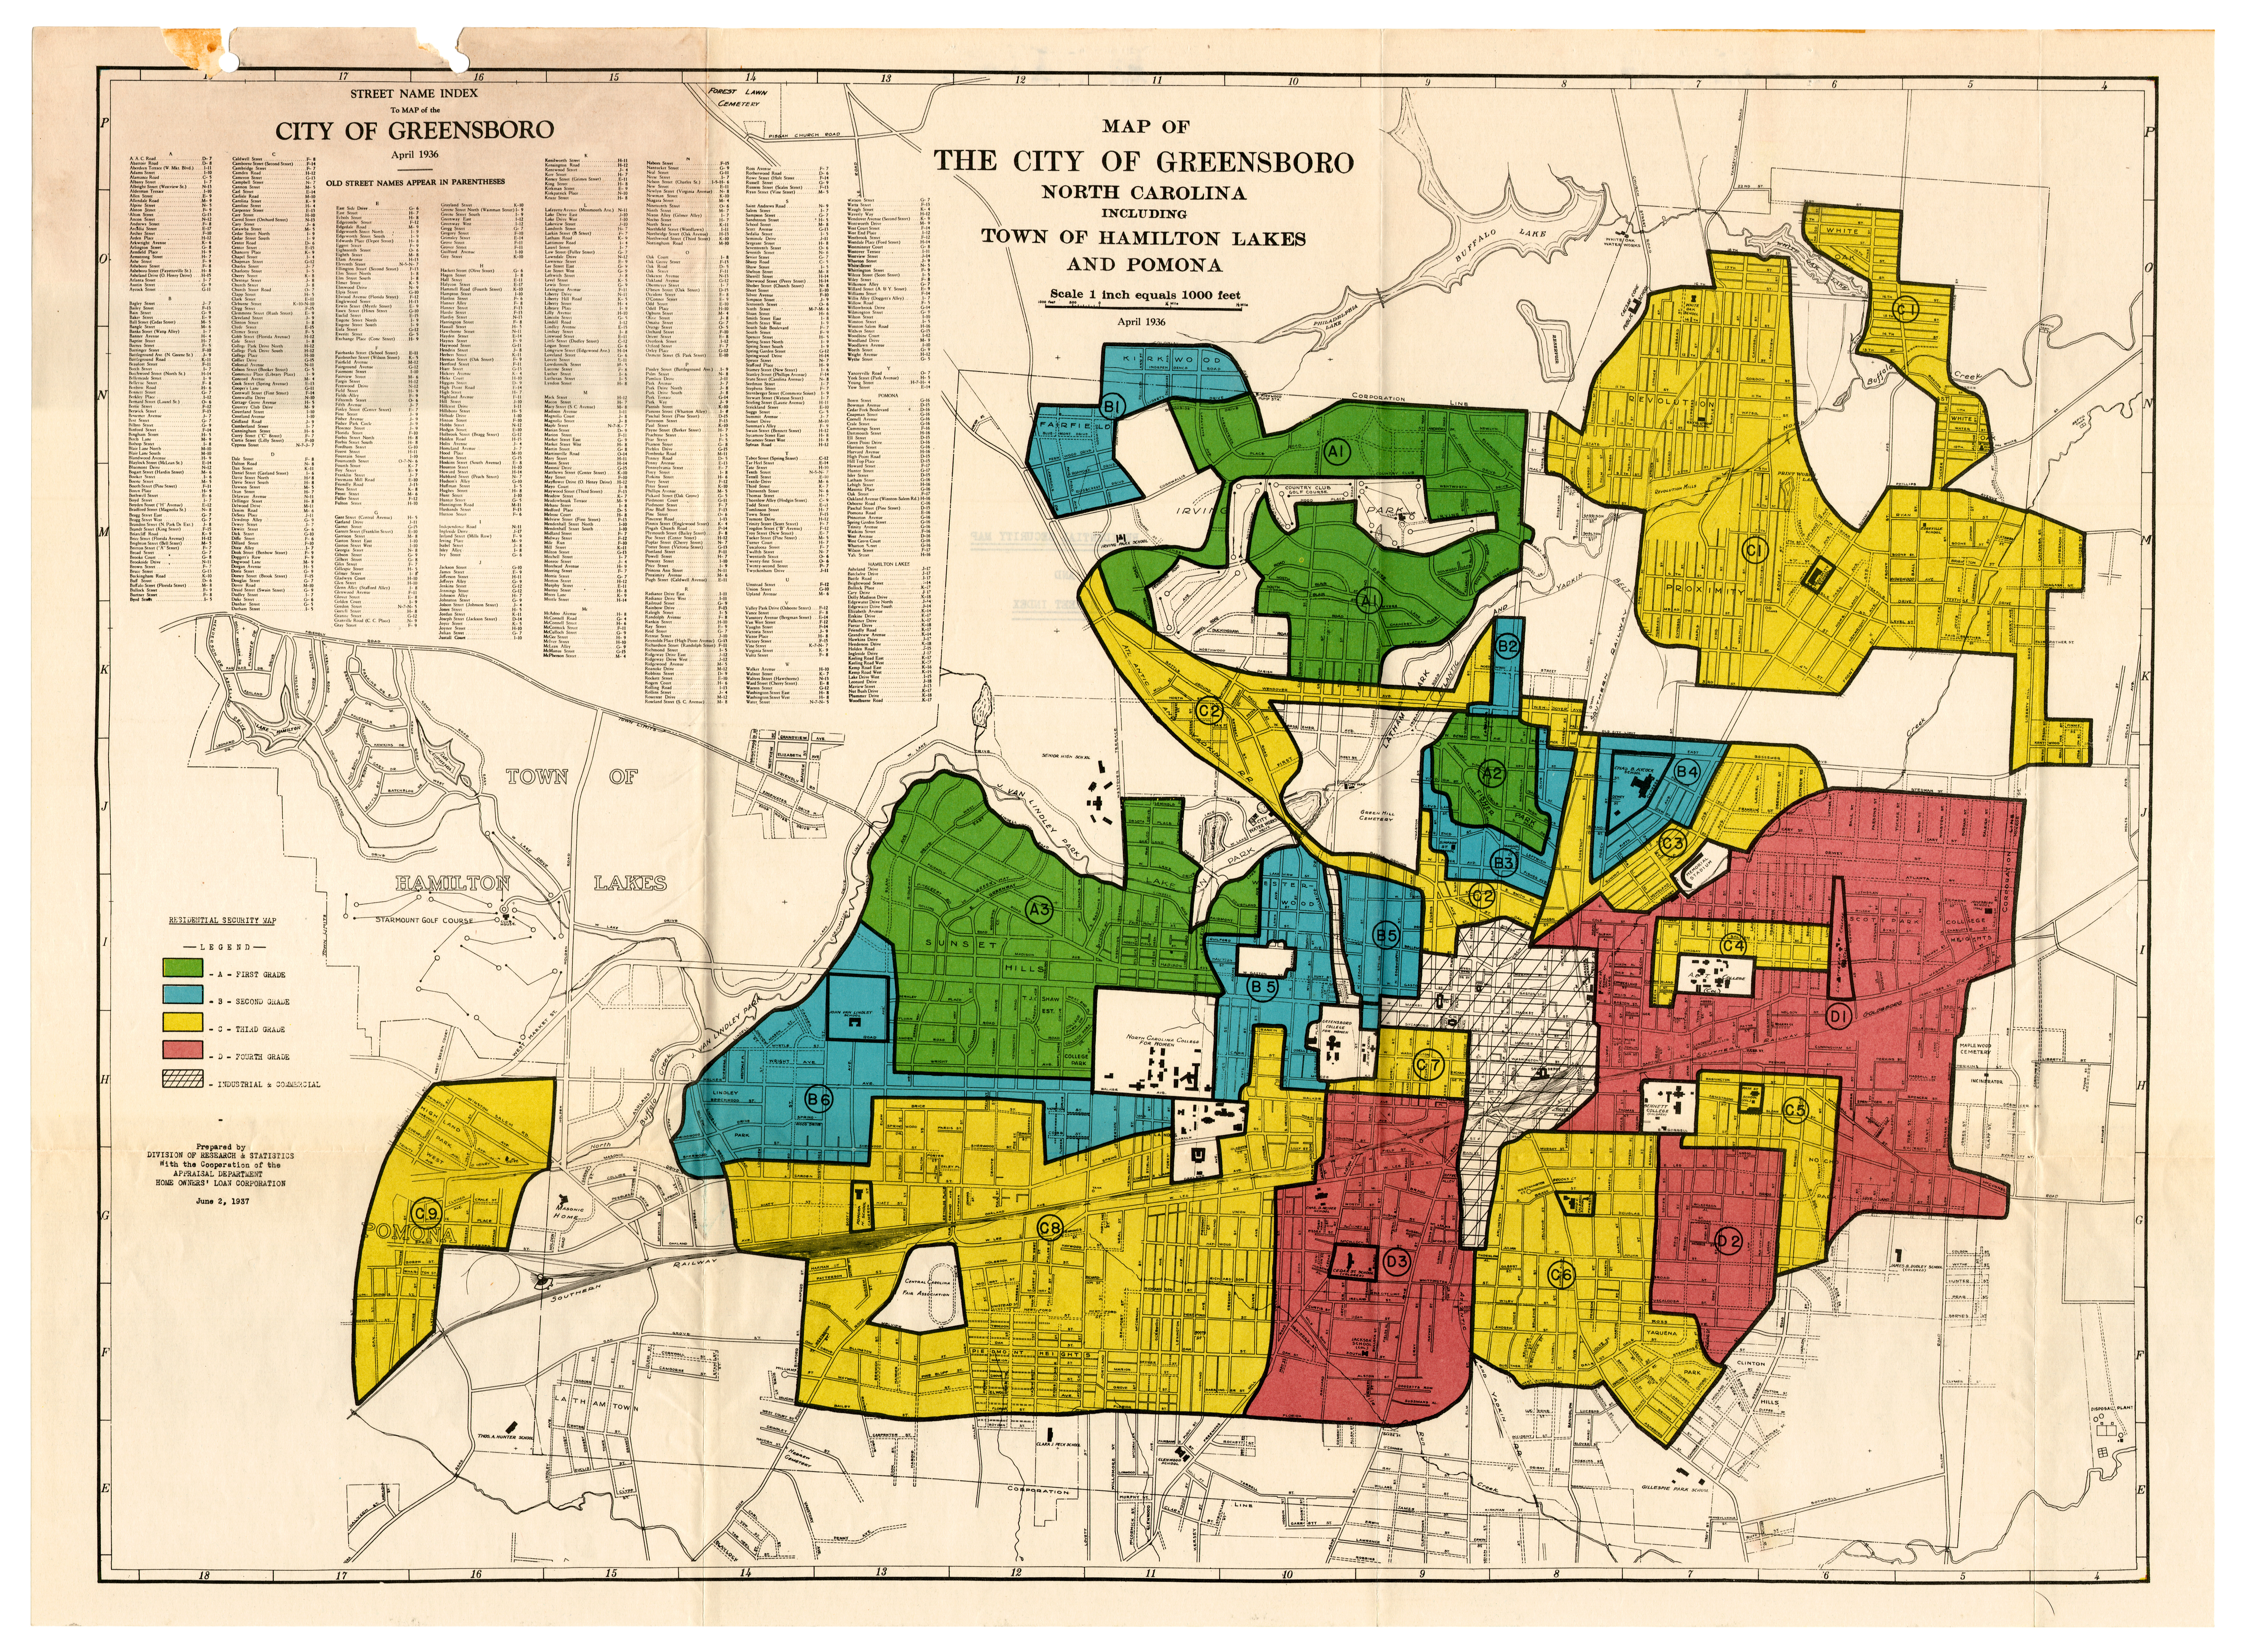 |
|
| Hendersonville | 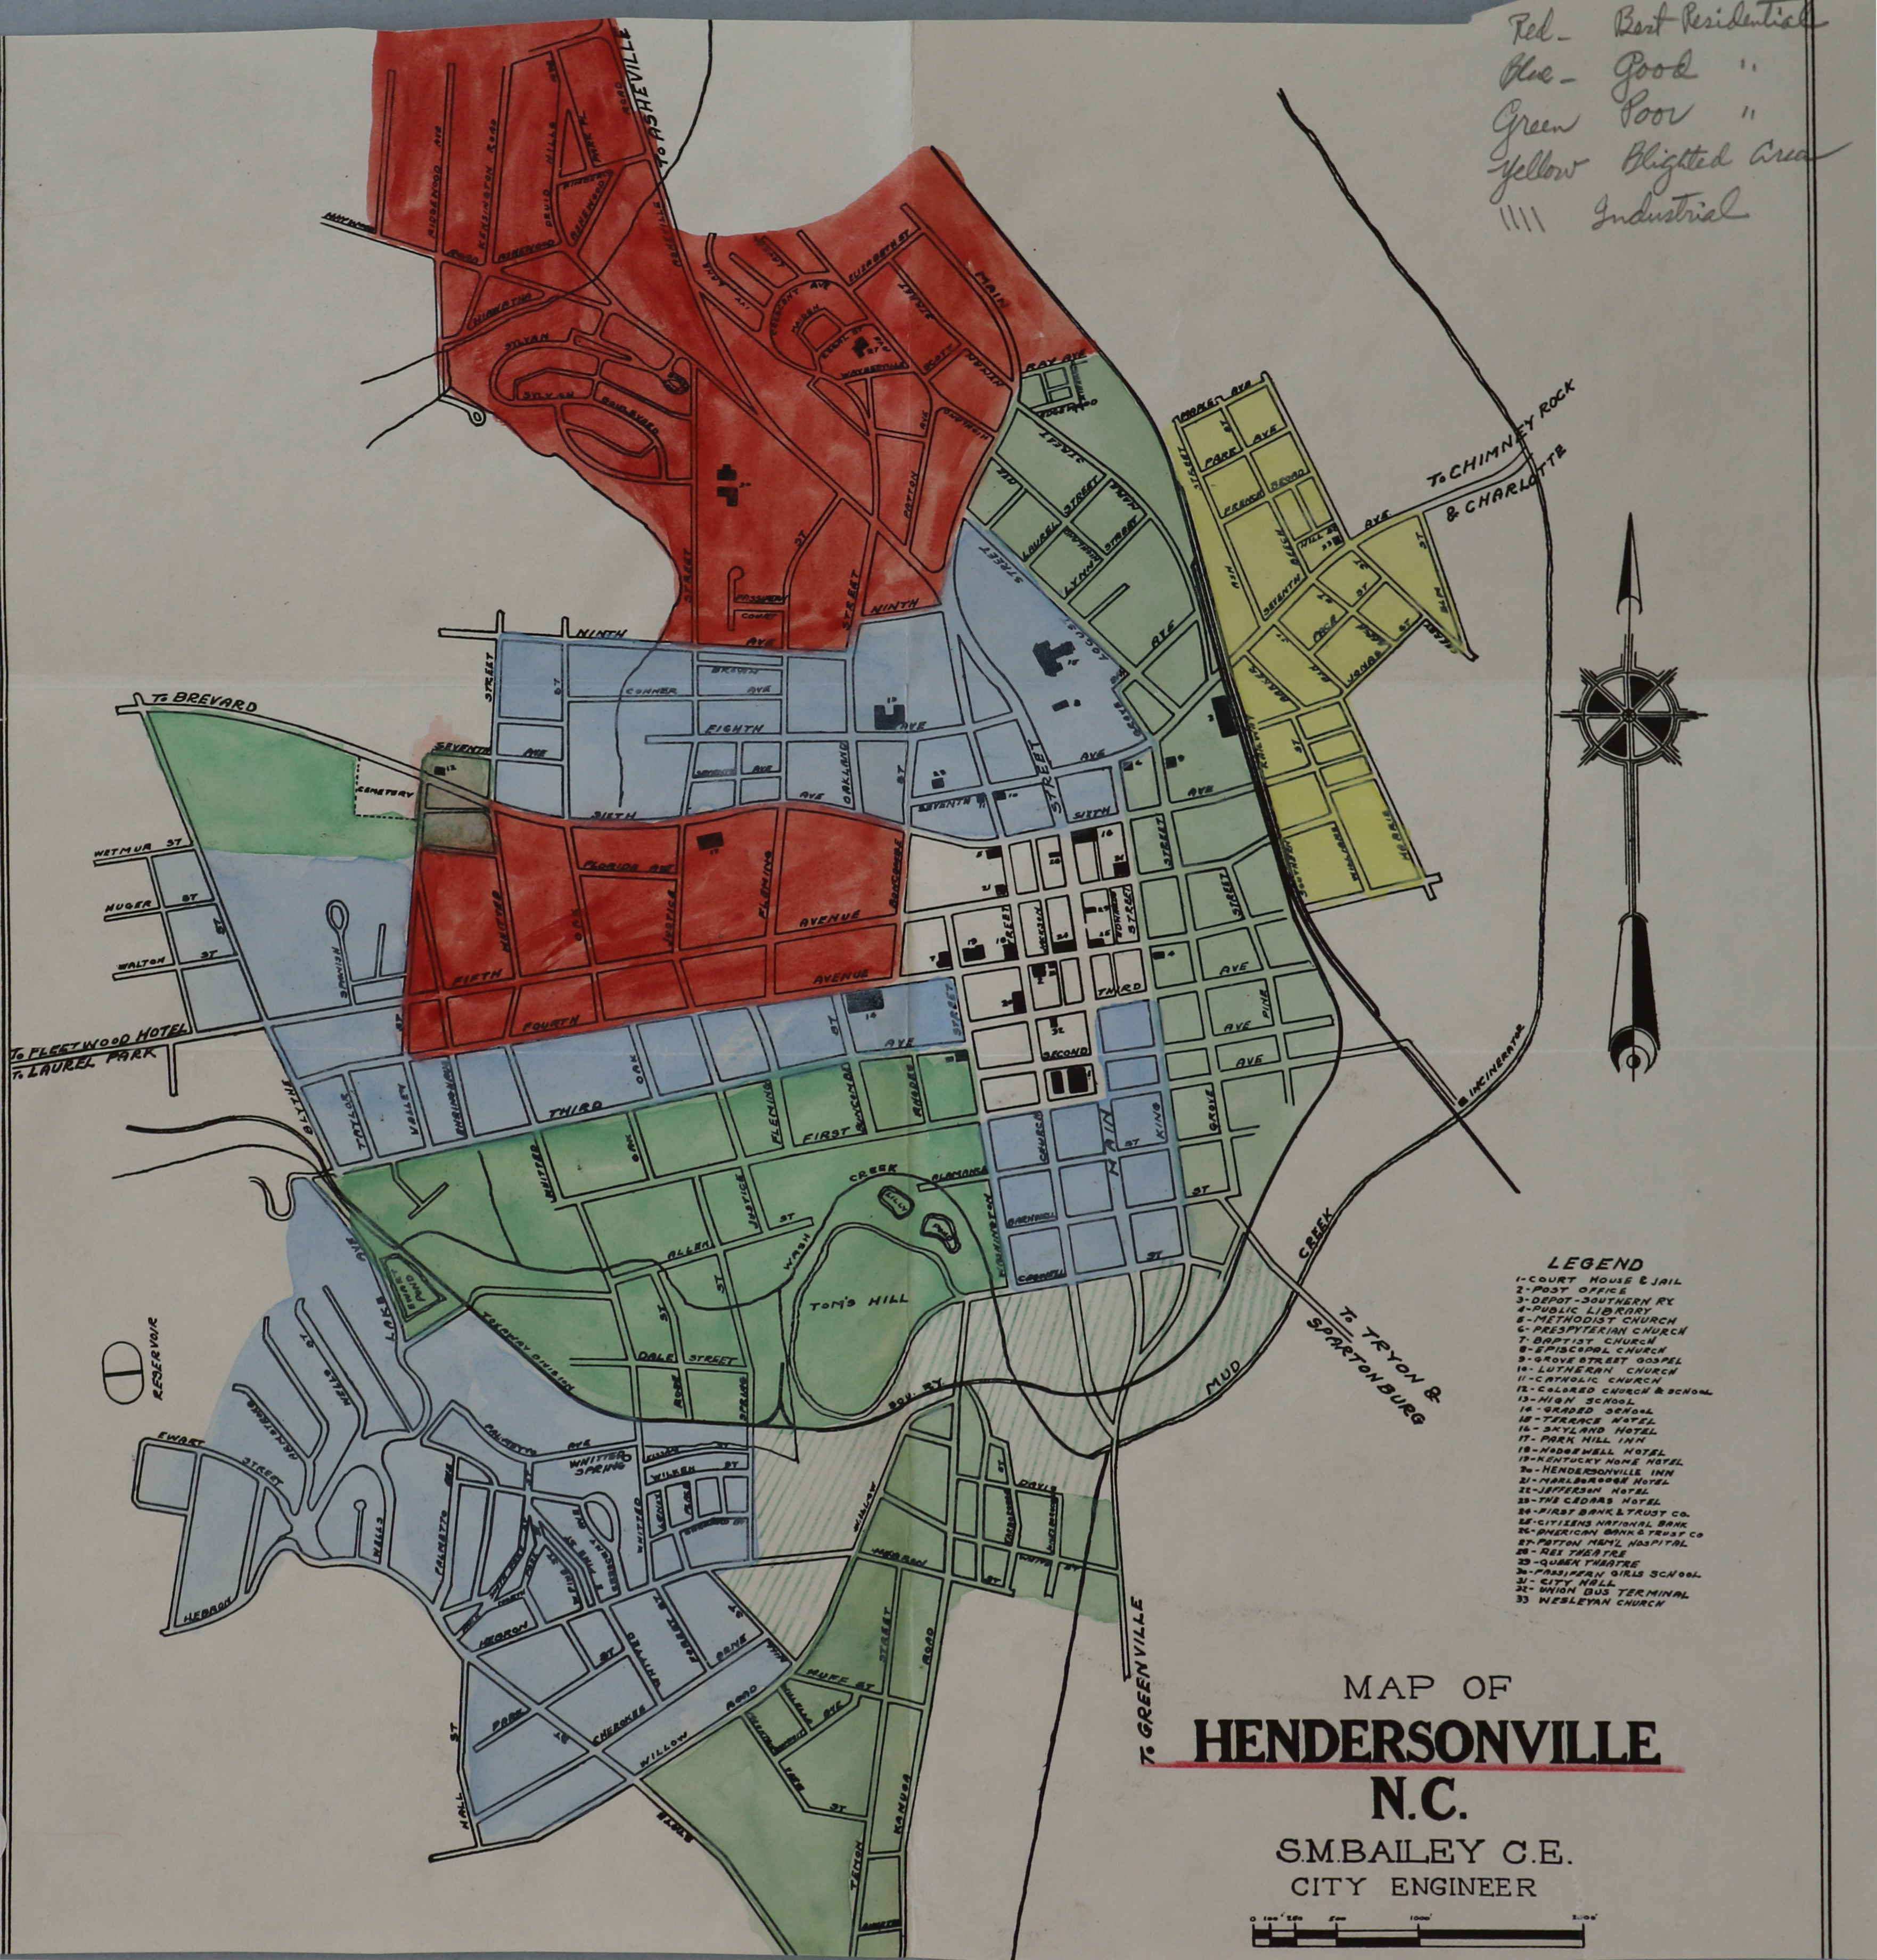 |
|
| High Point | 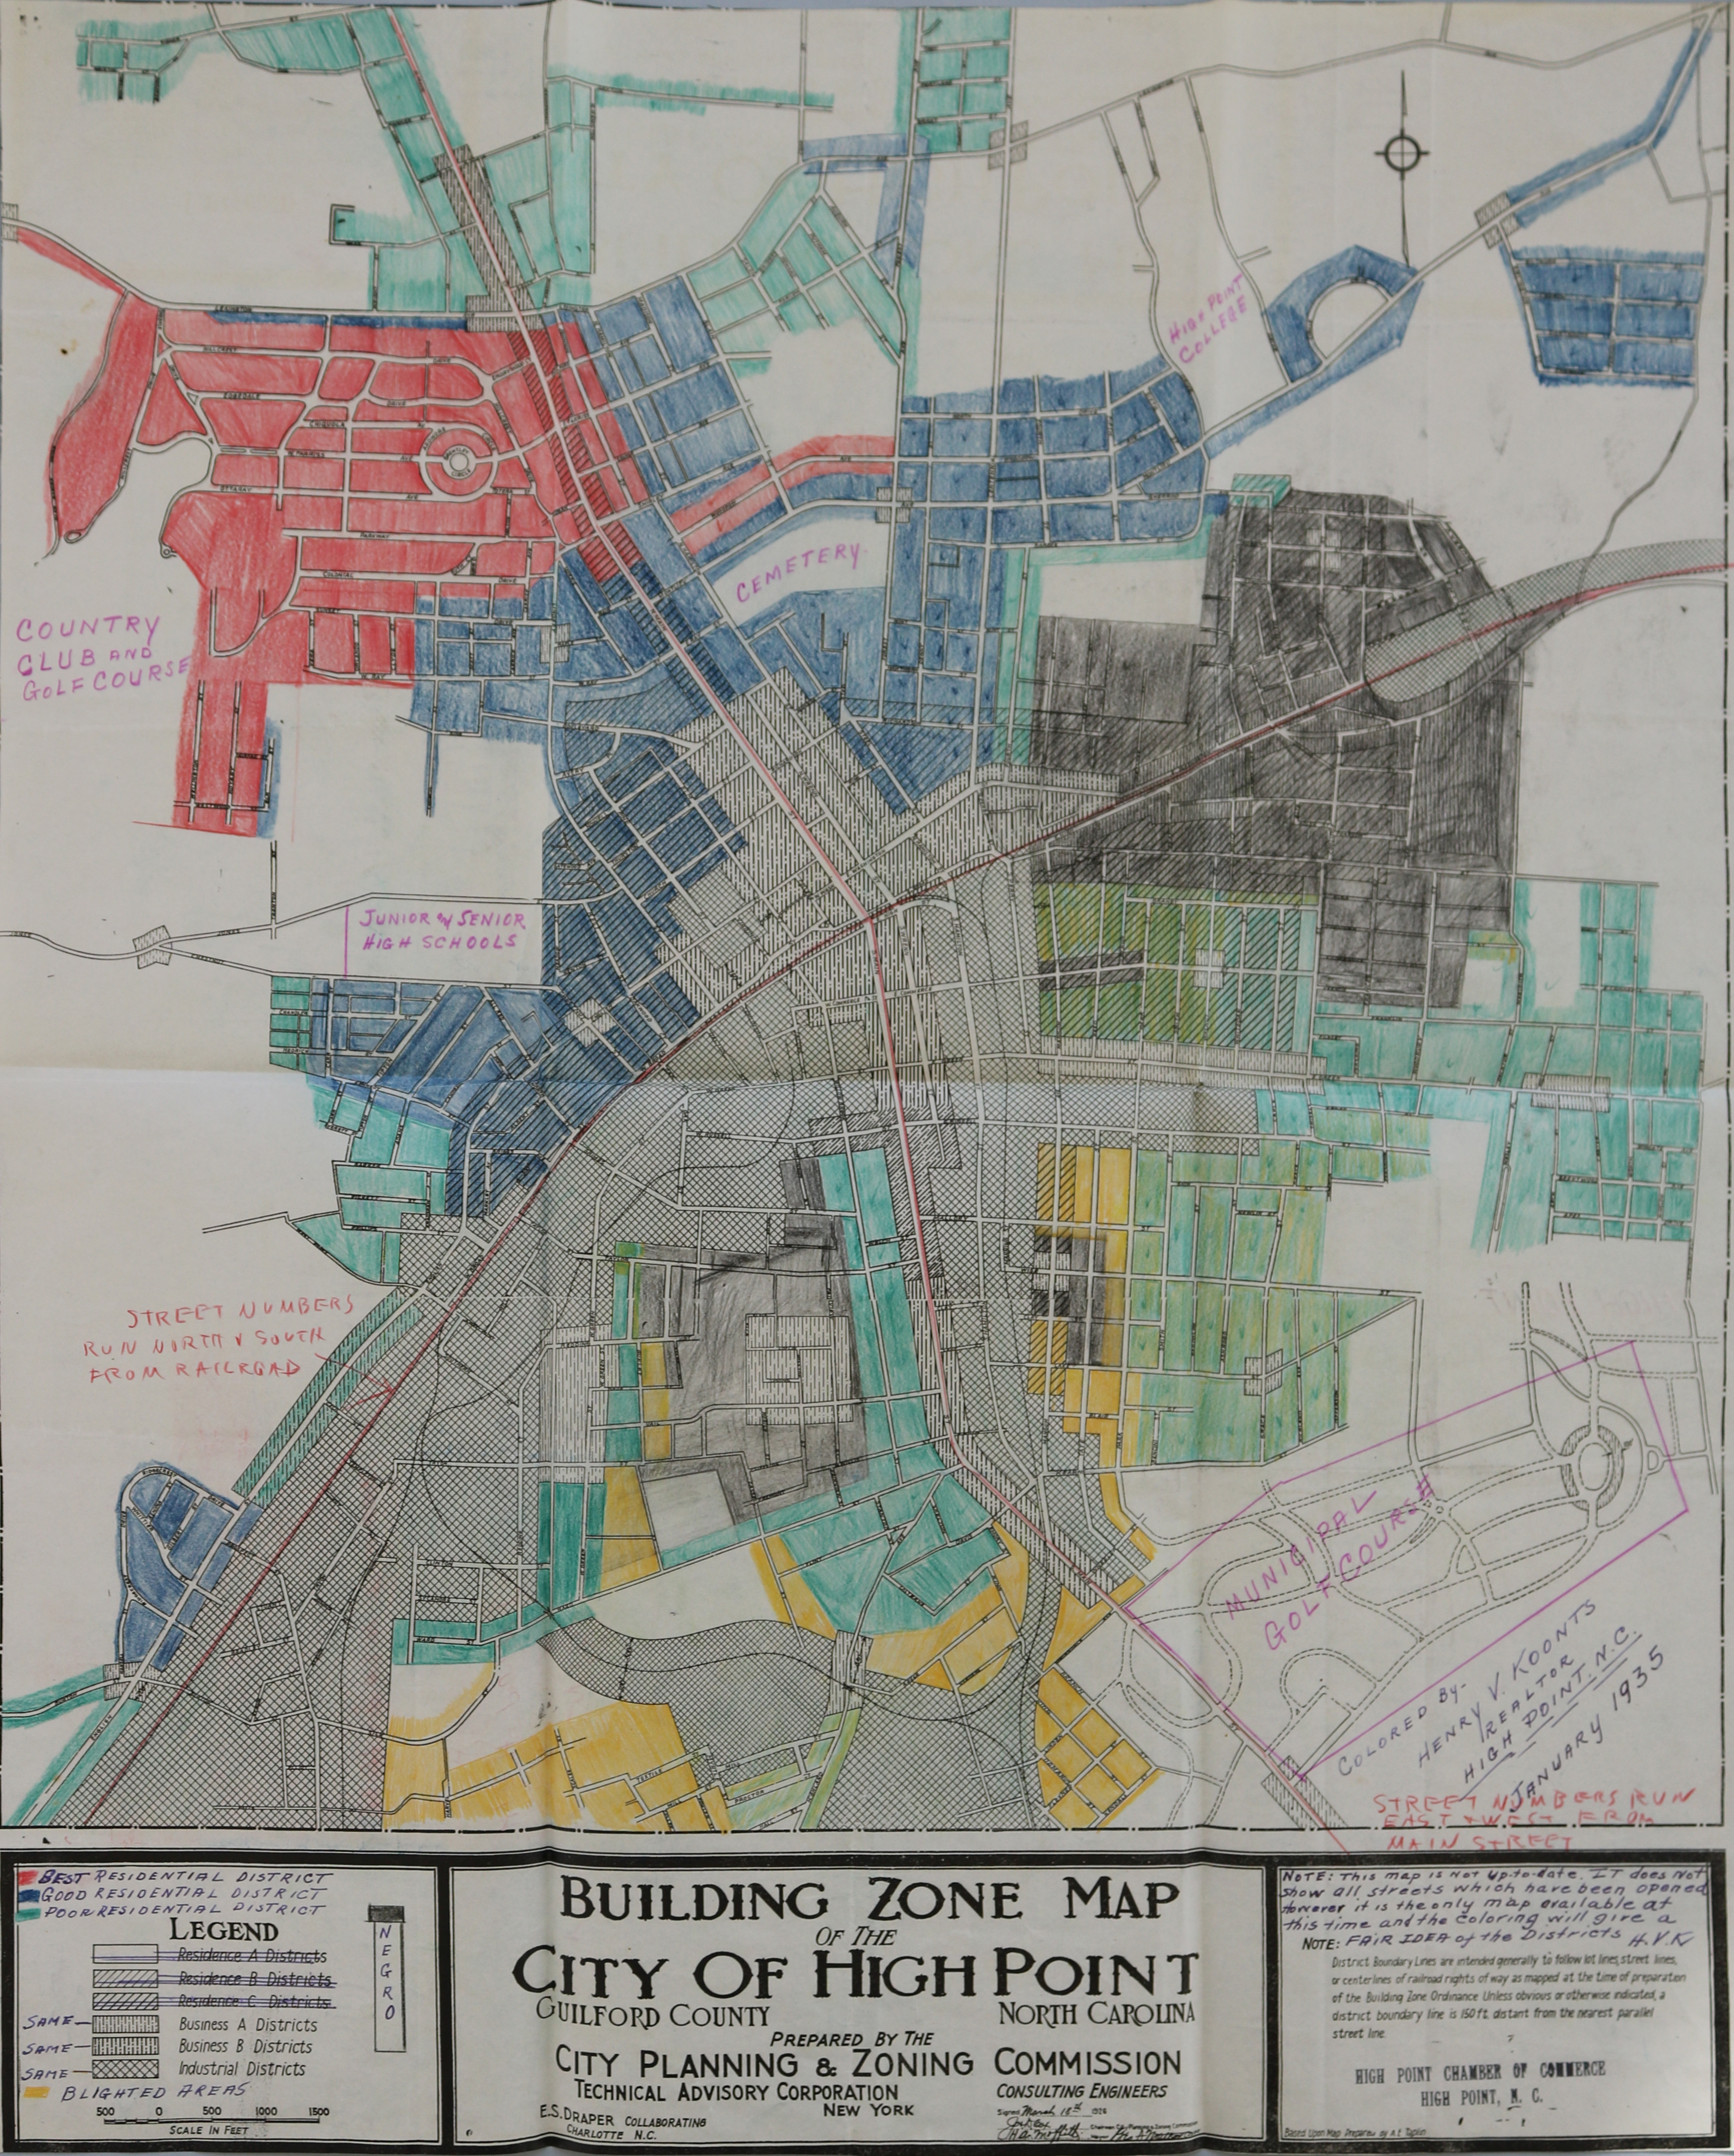 |
|
| New Bern | 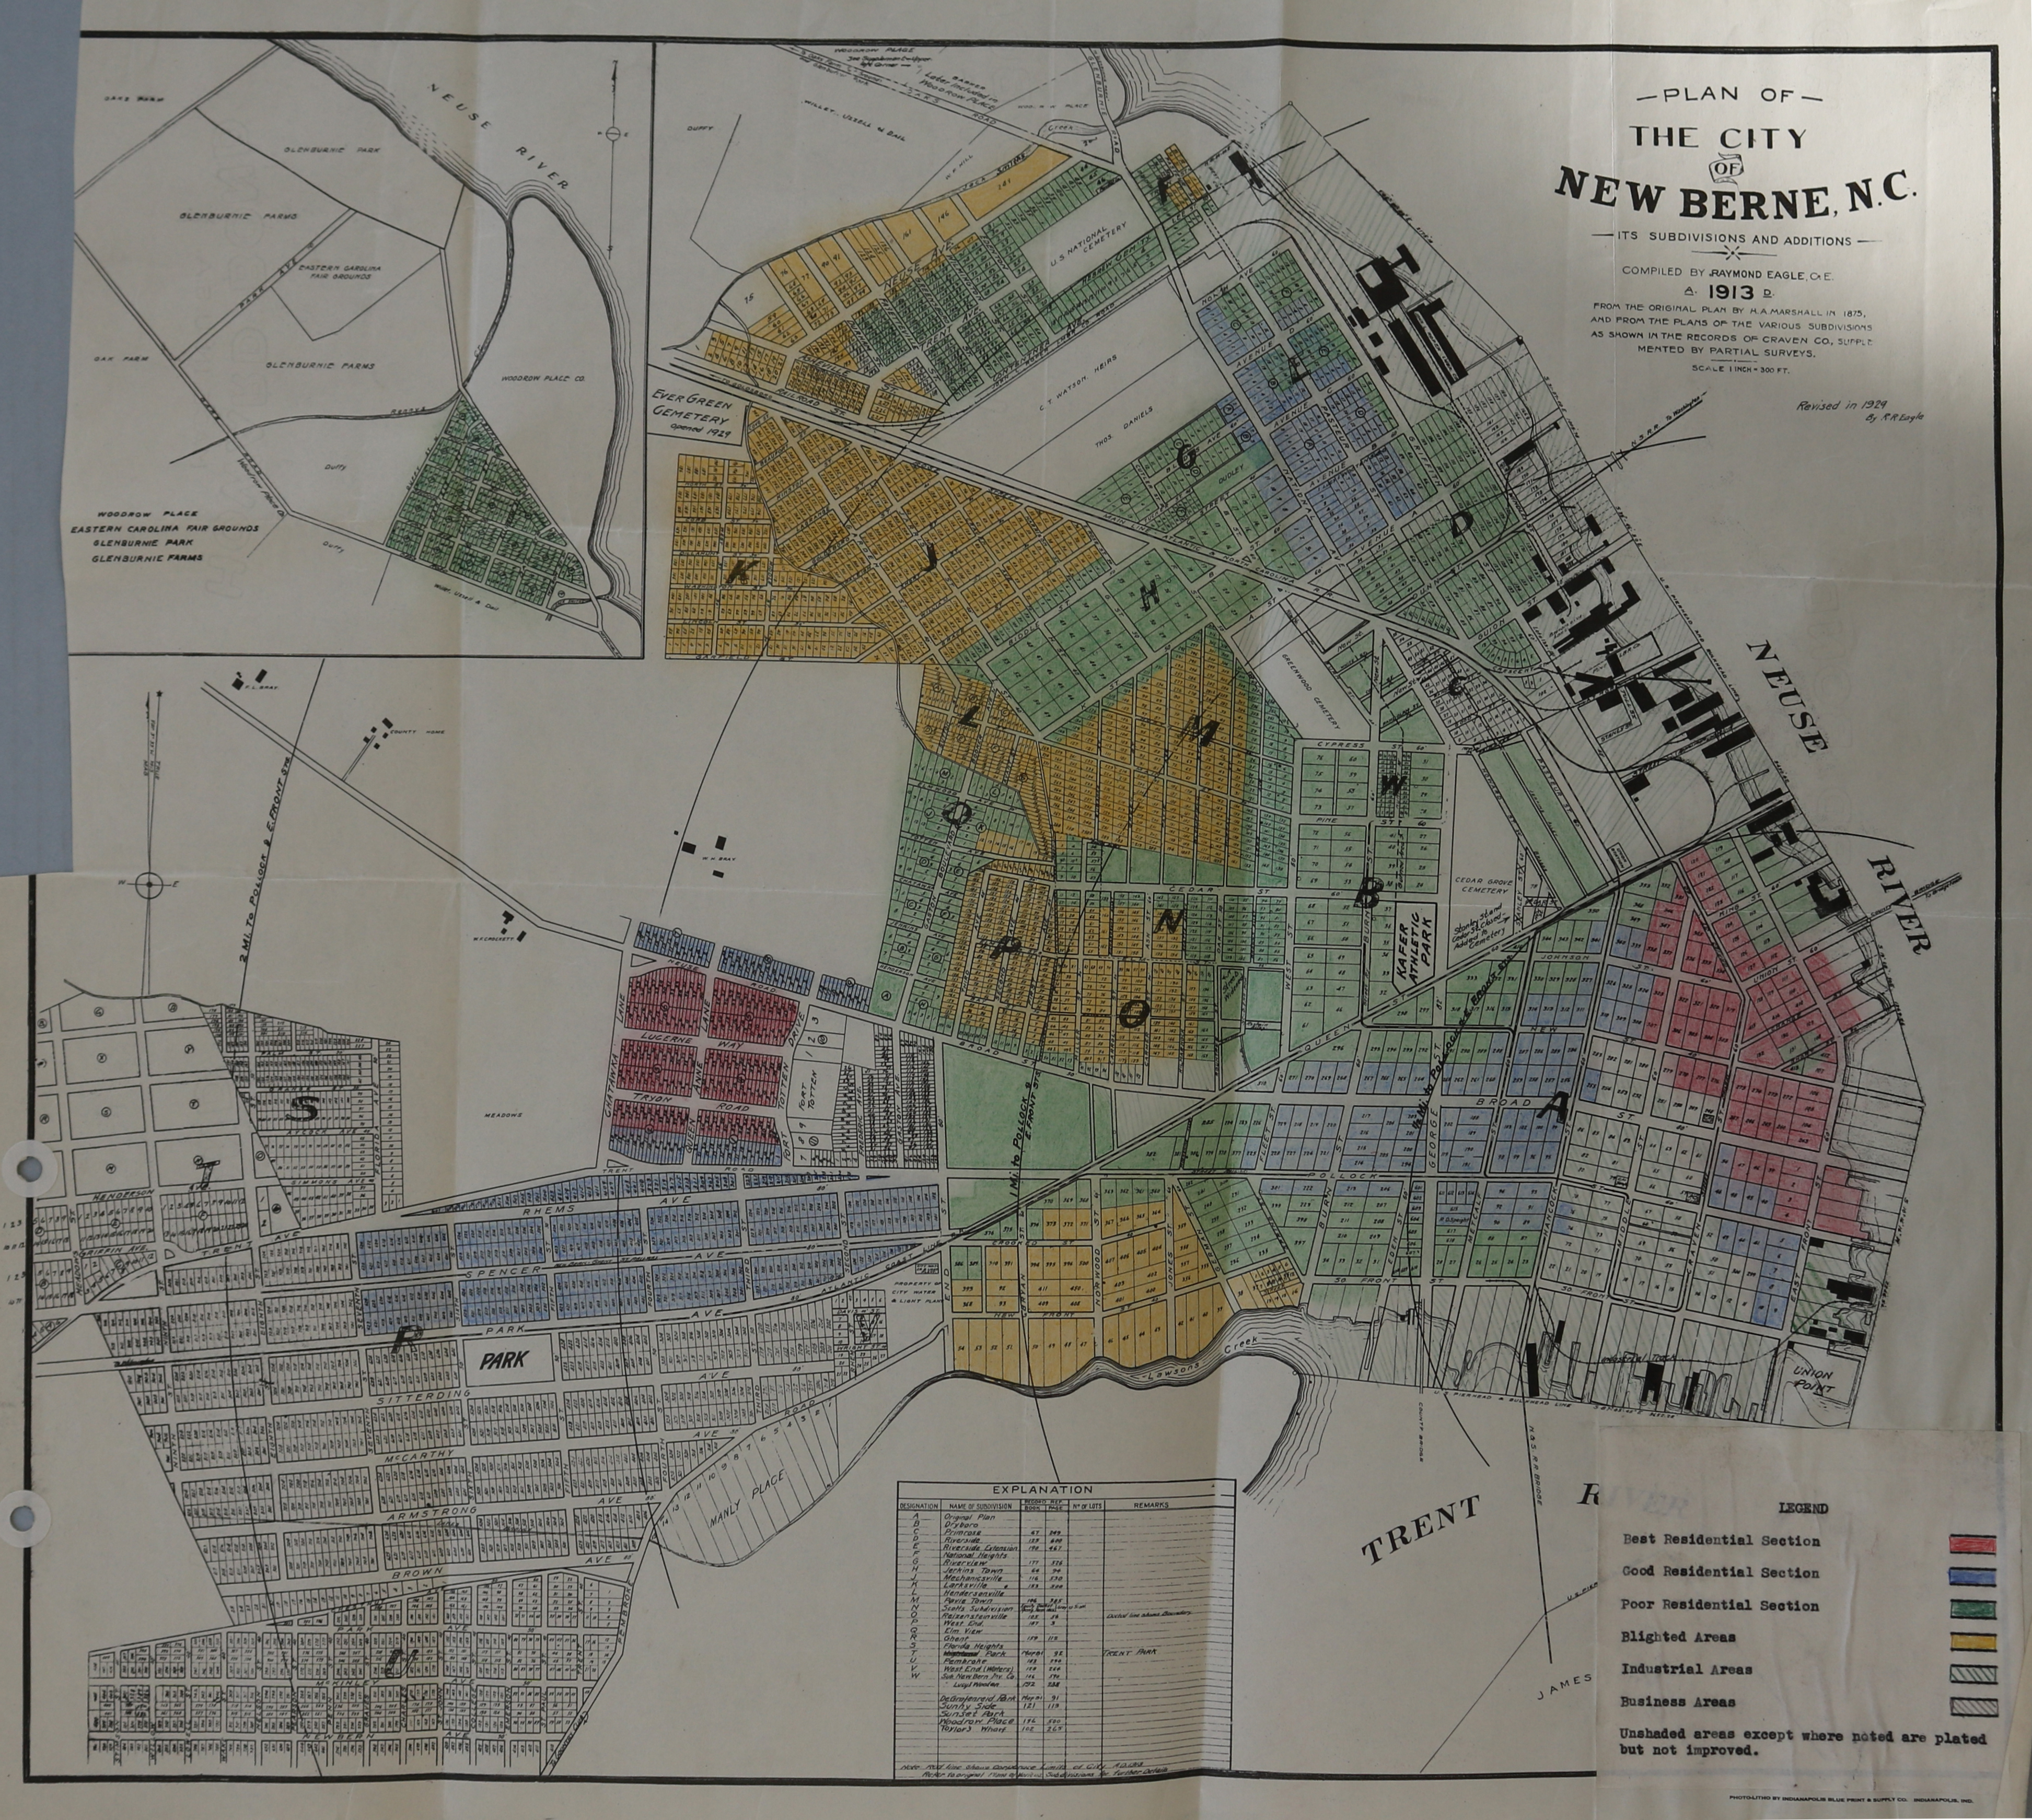 |
|
| Rocky Mount | 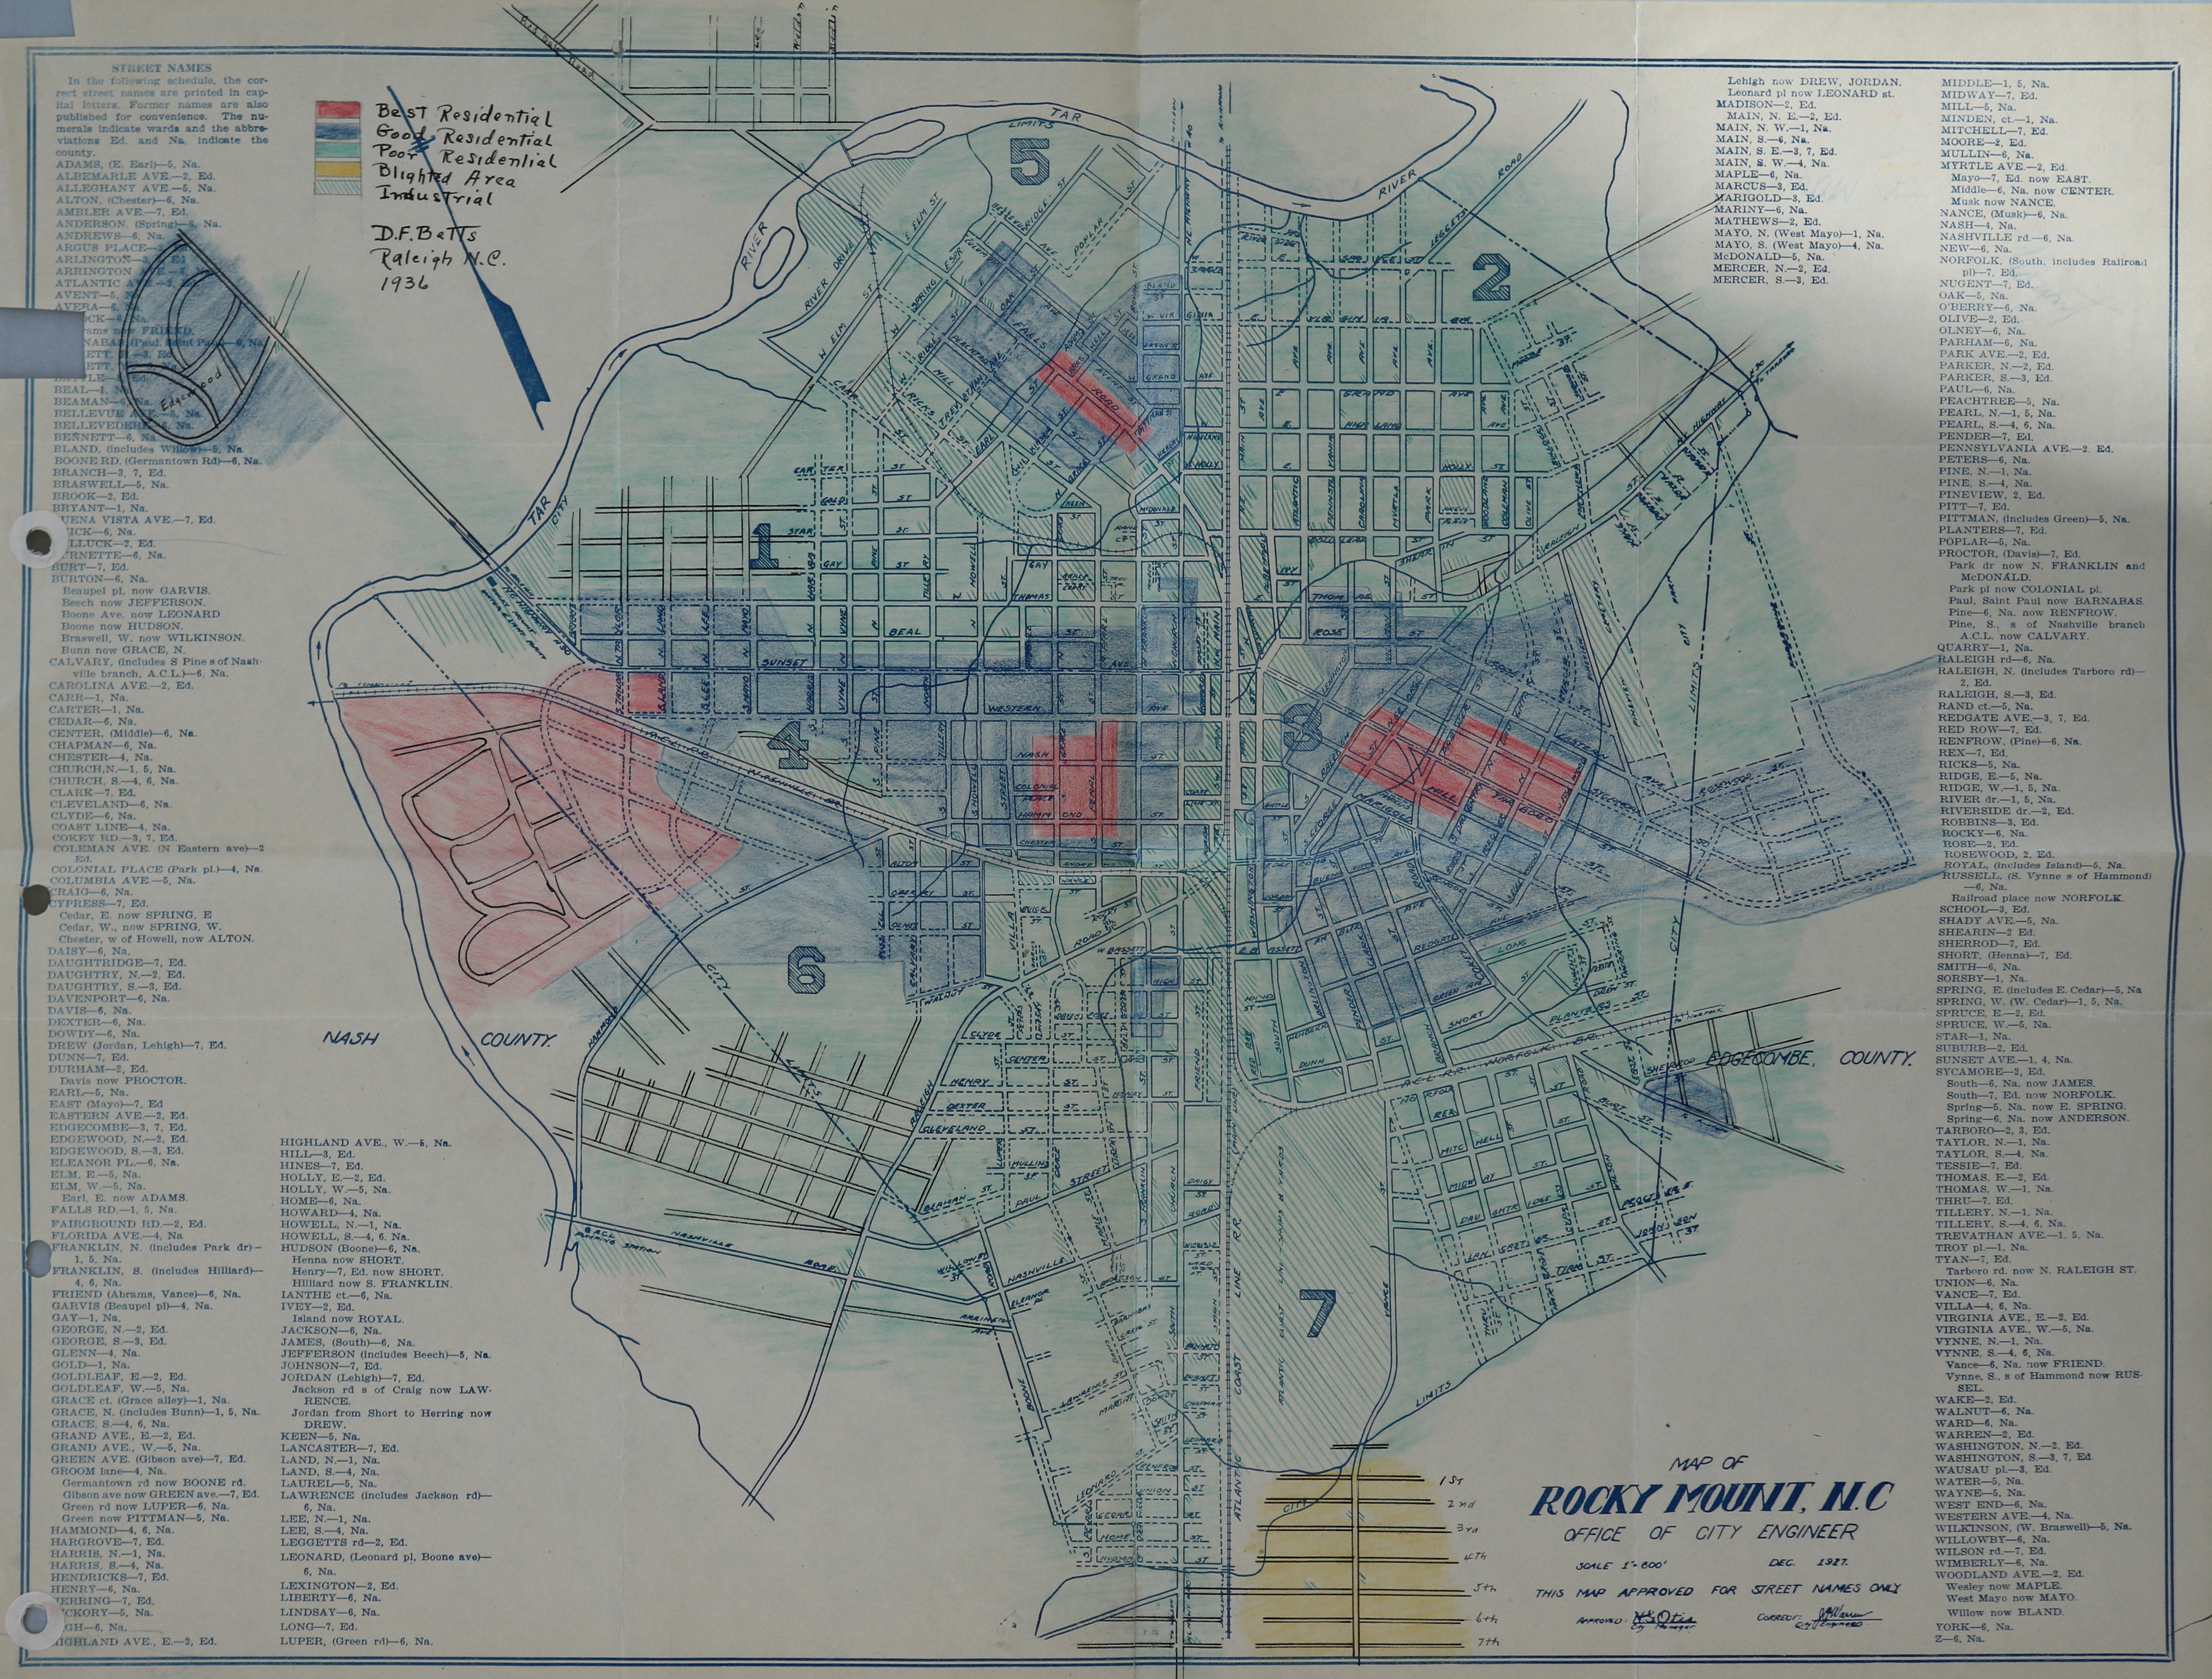 |
|
| Raleigh | Historic map not available. | 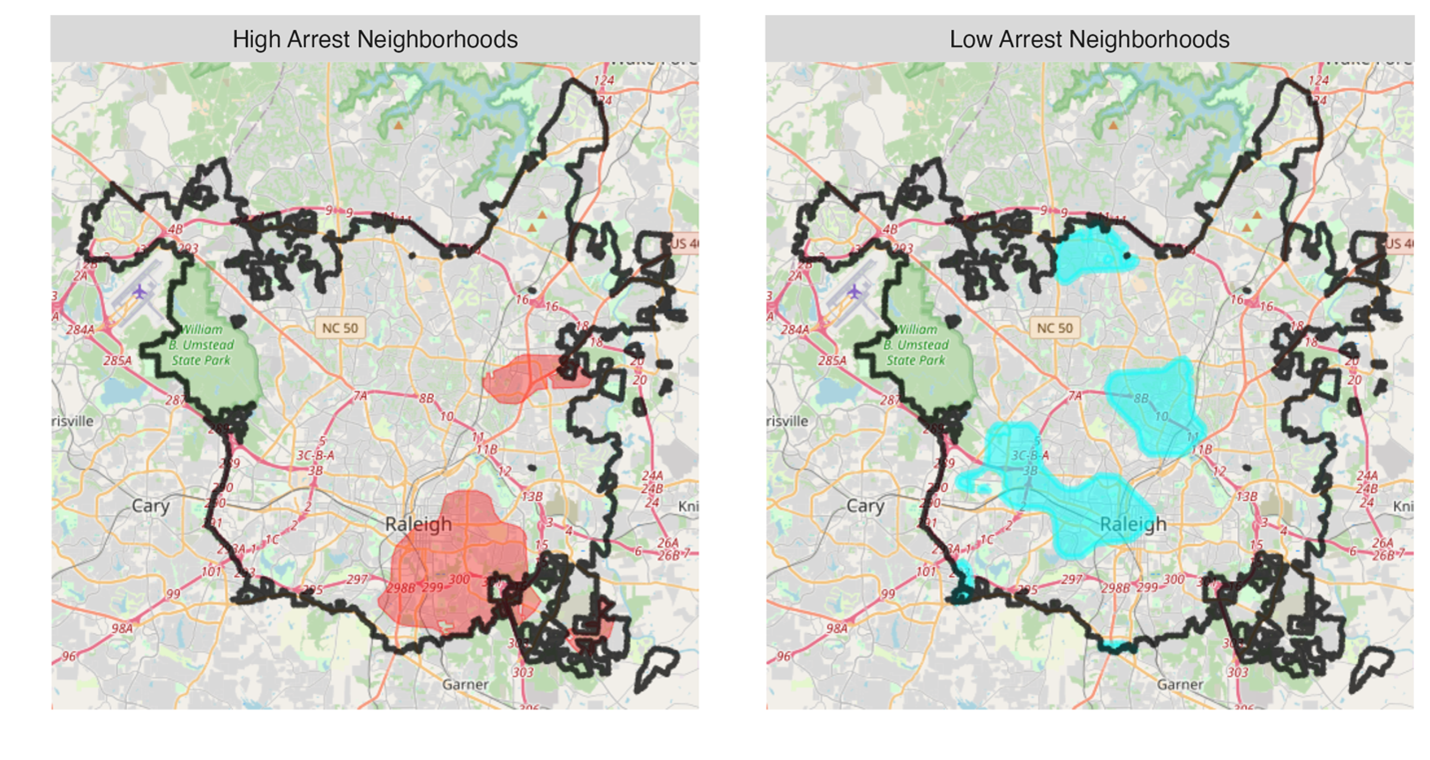
|
| Statesville | 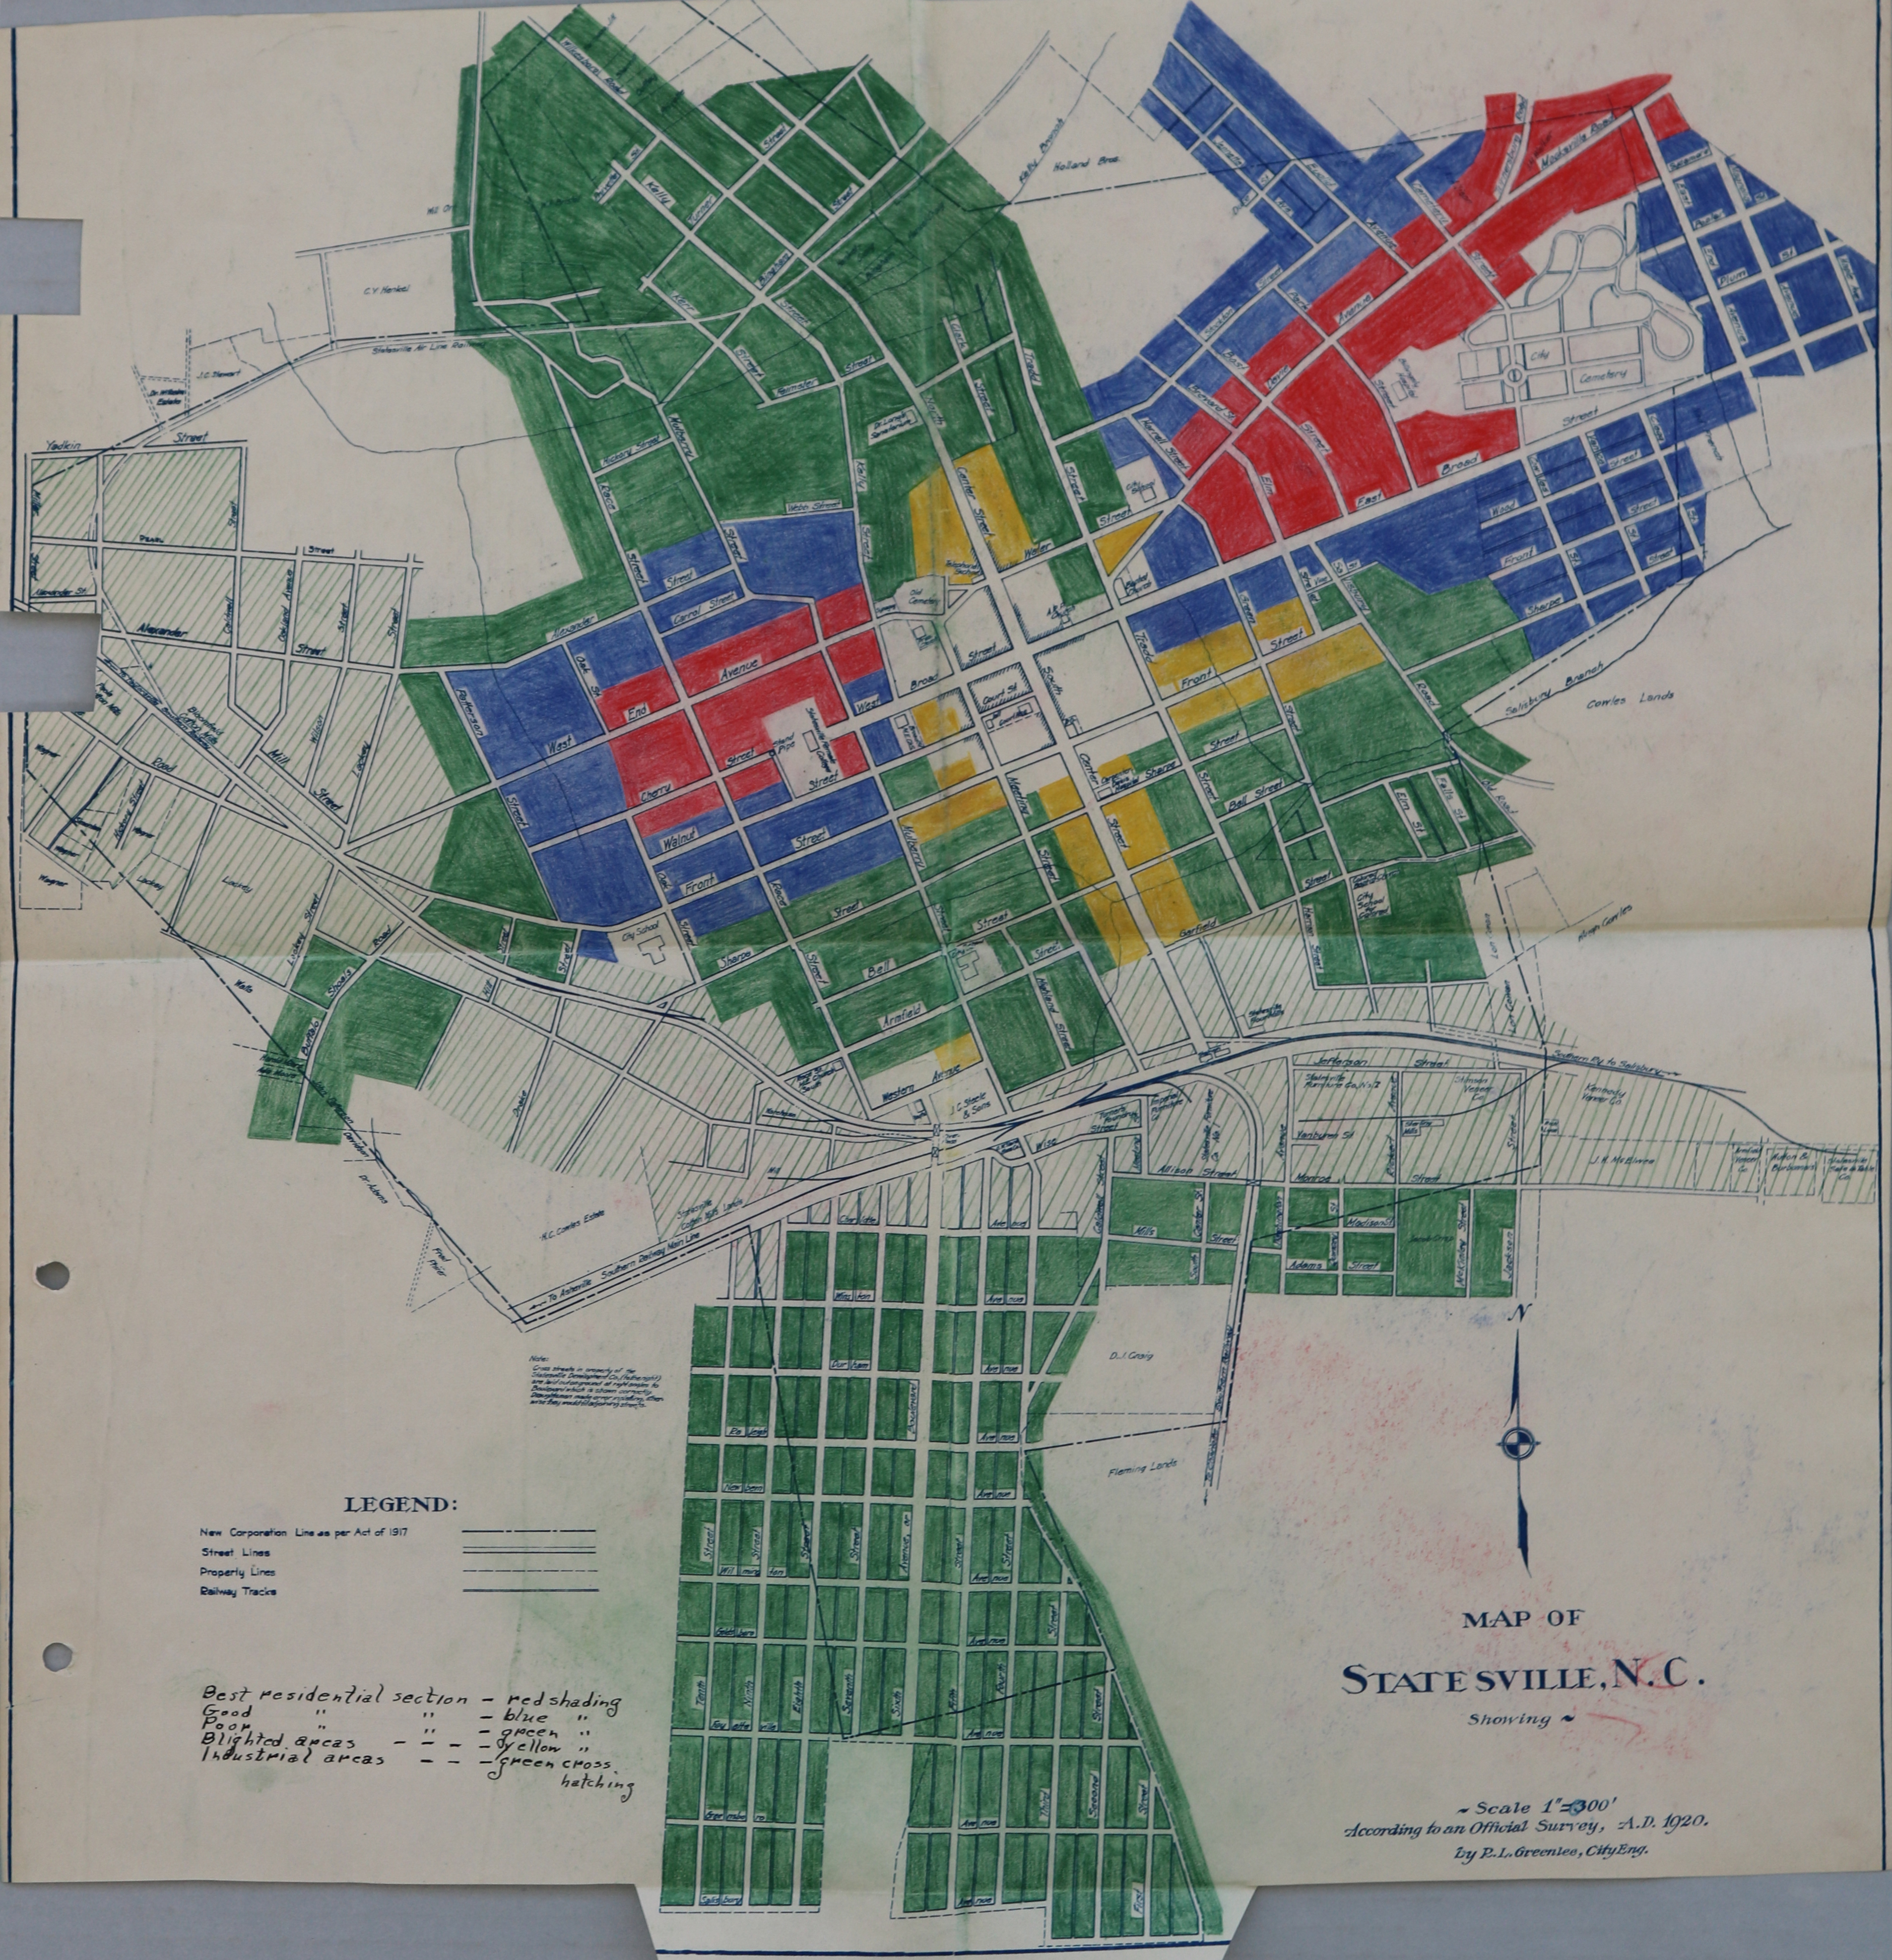 |
|
| Winston-Salem | 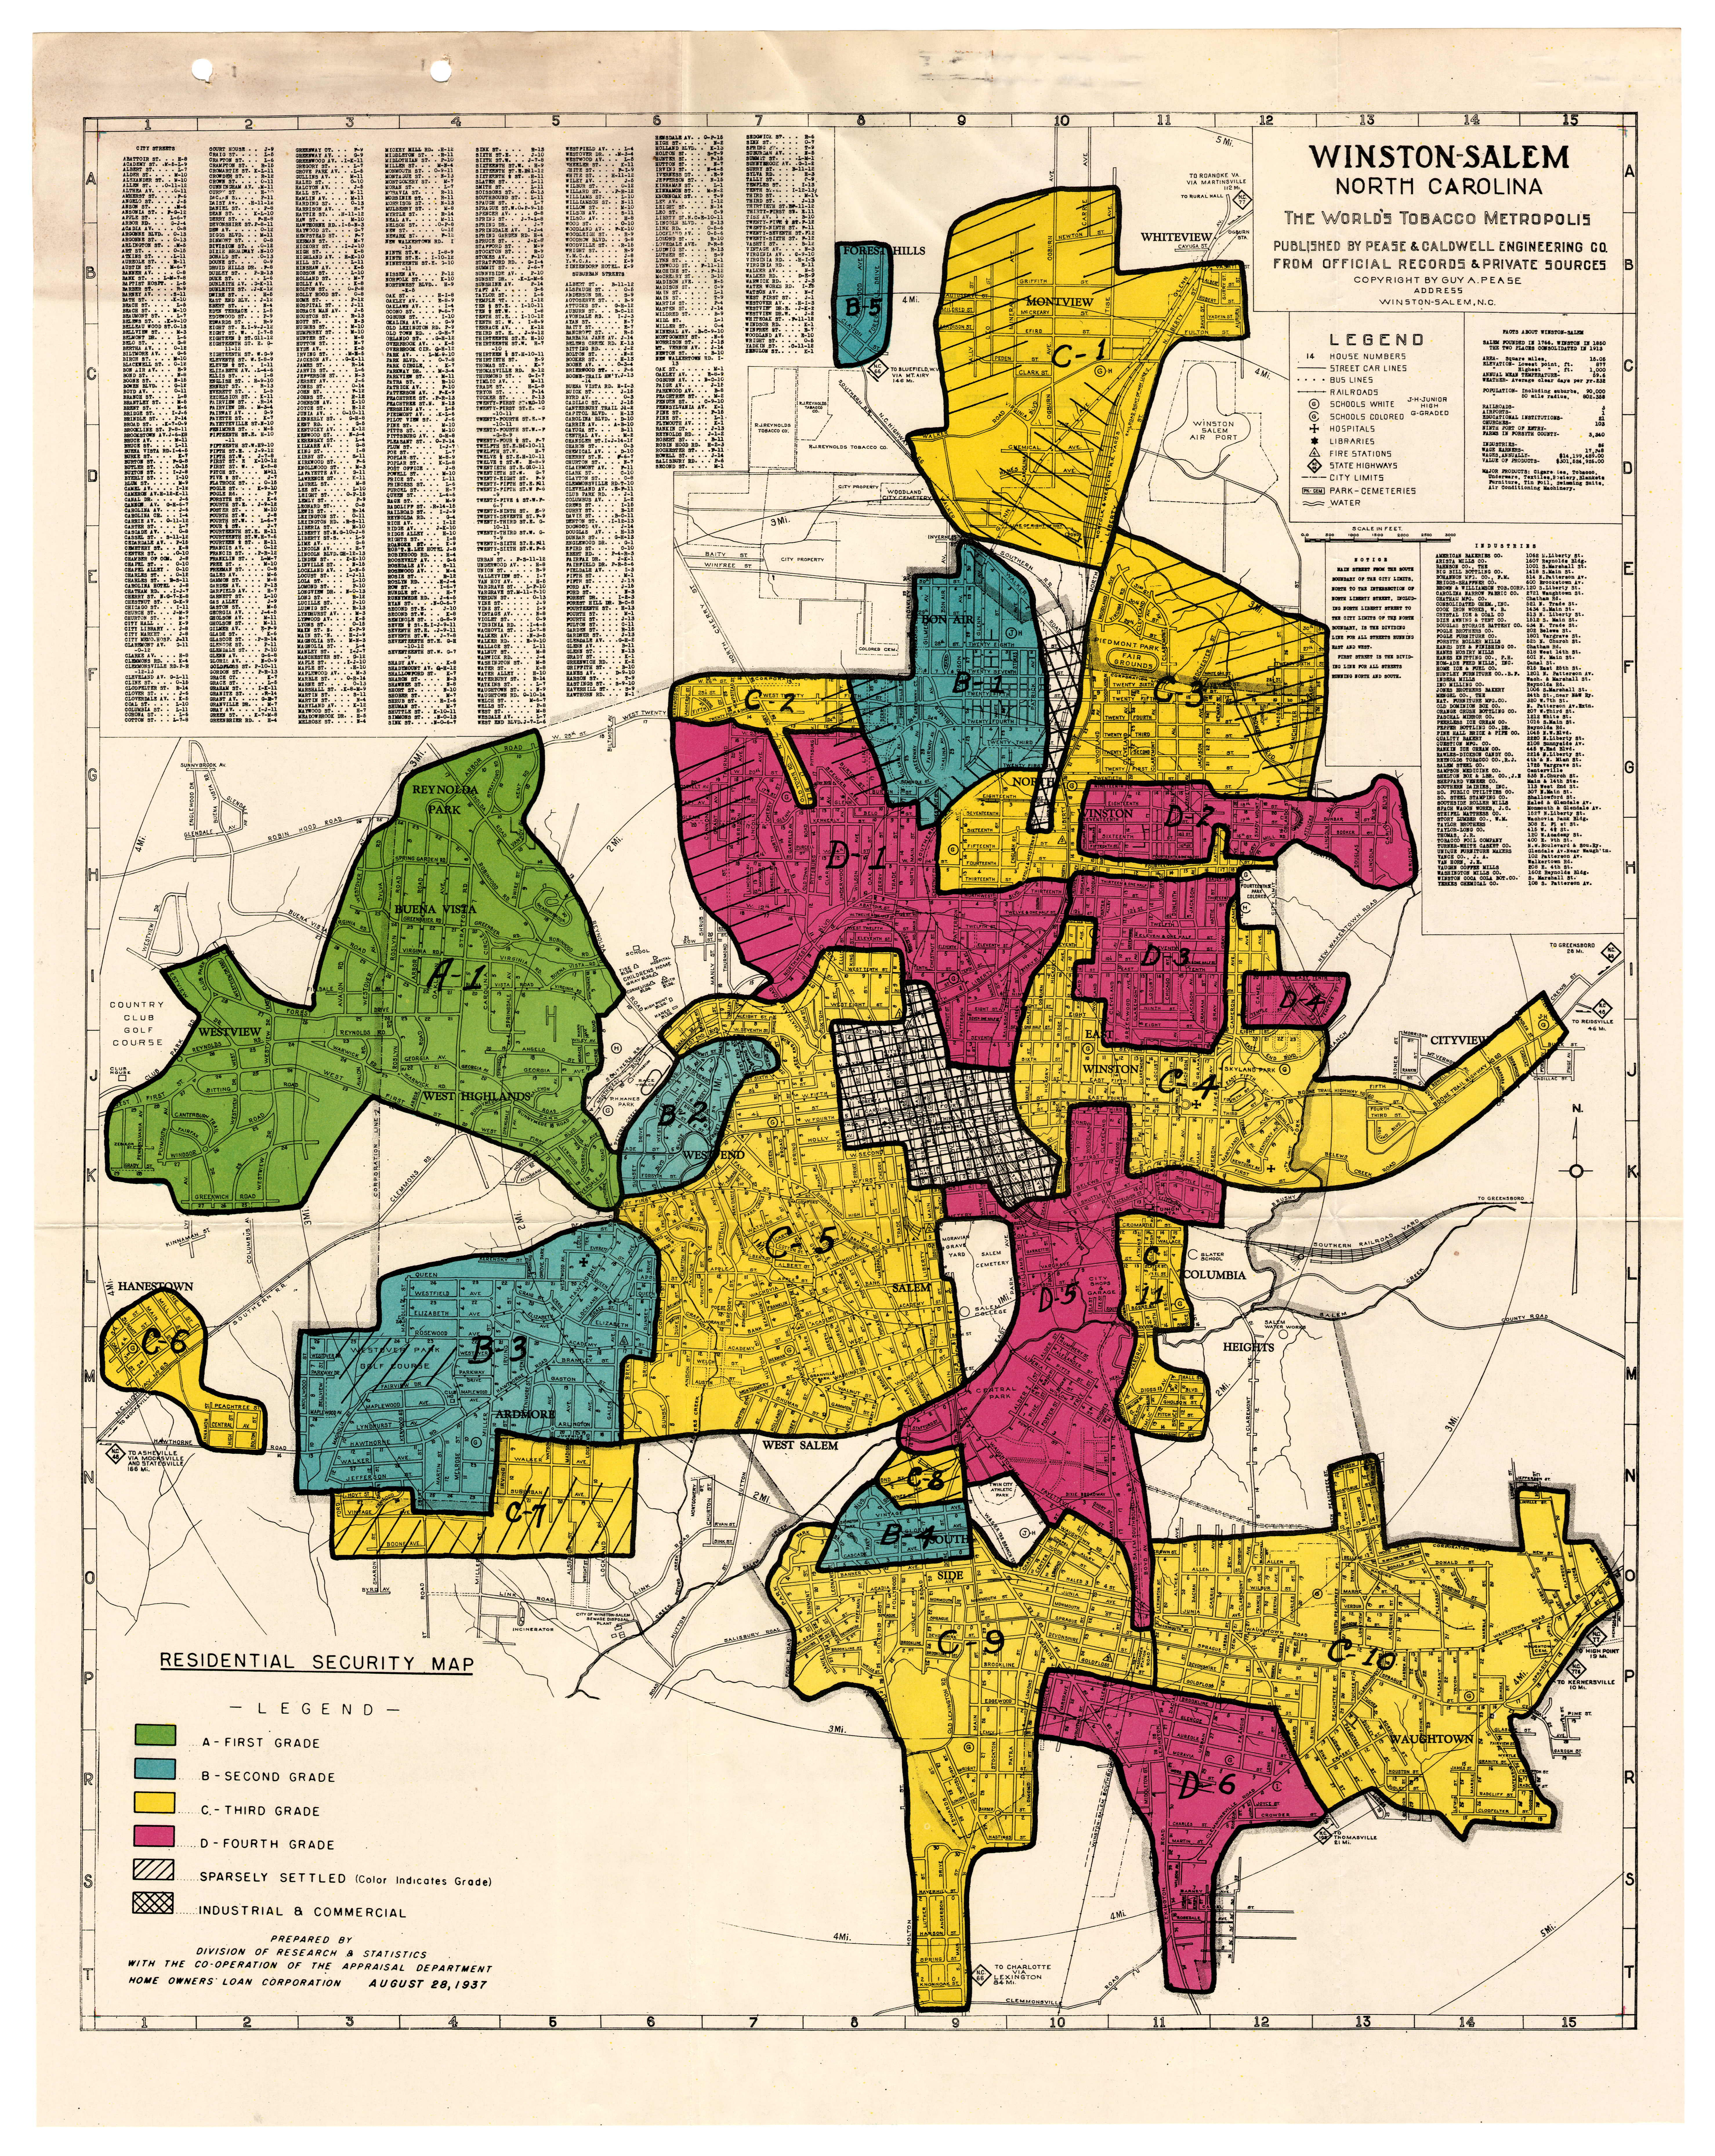 |
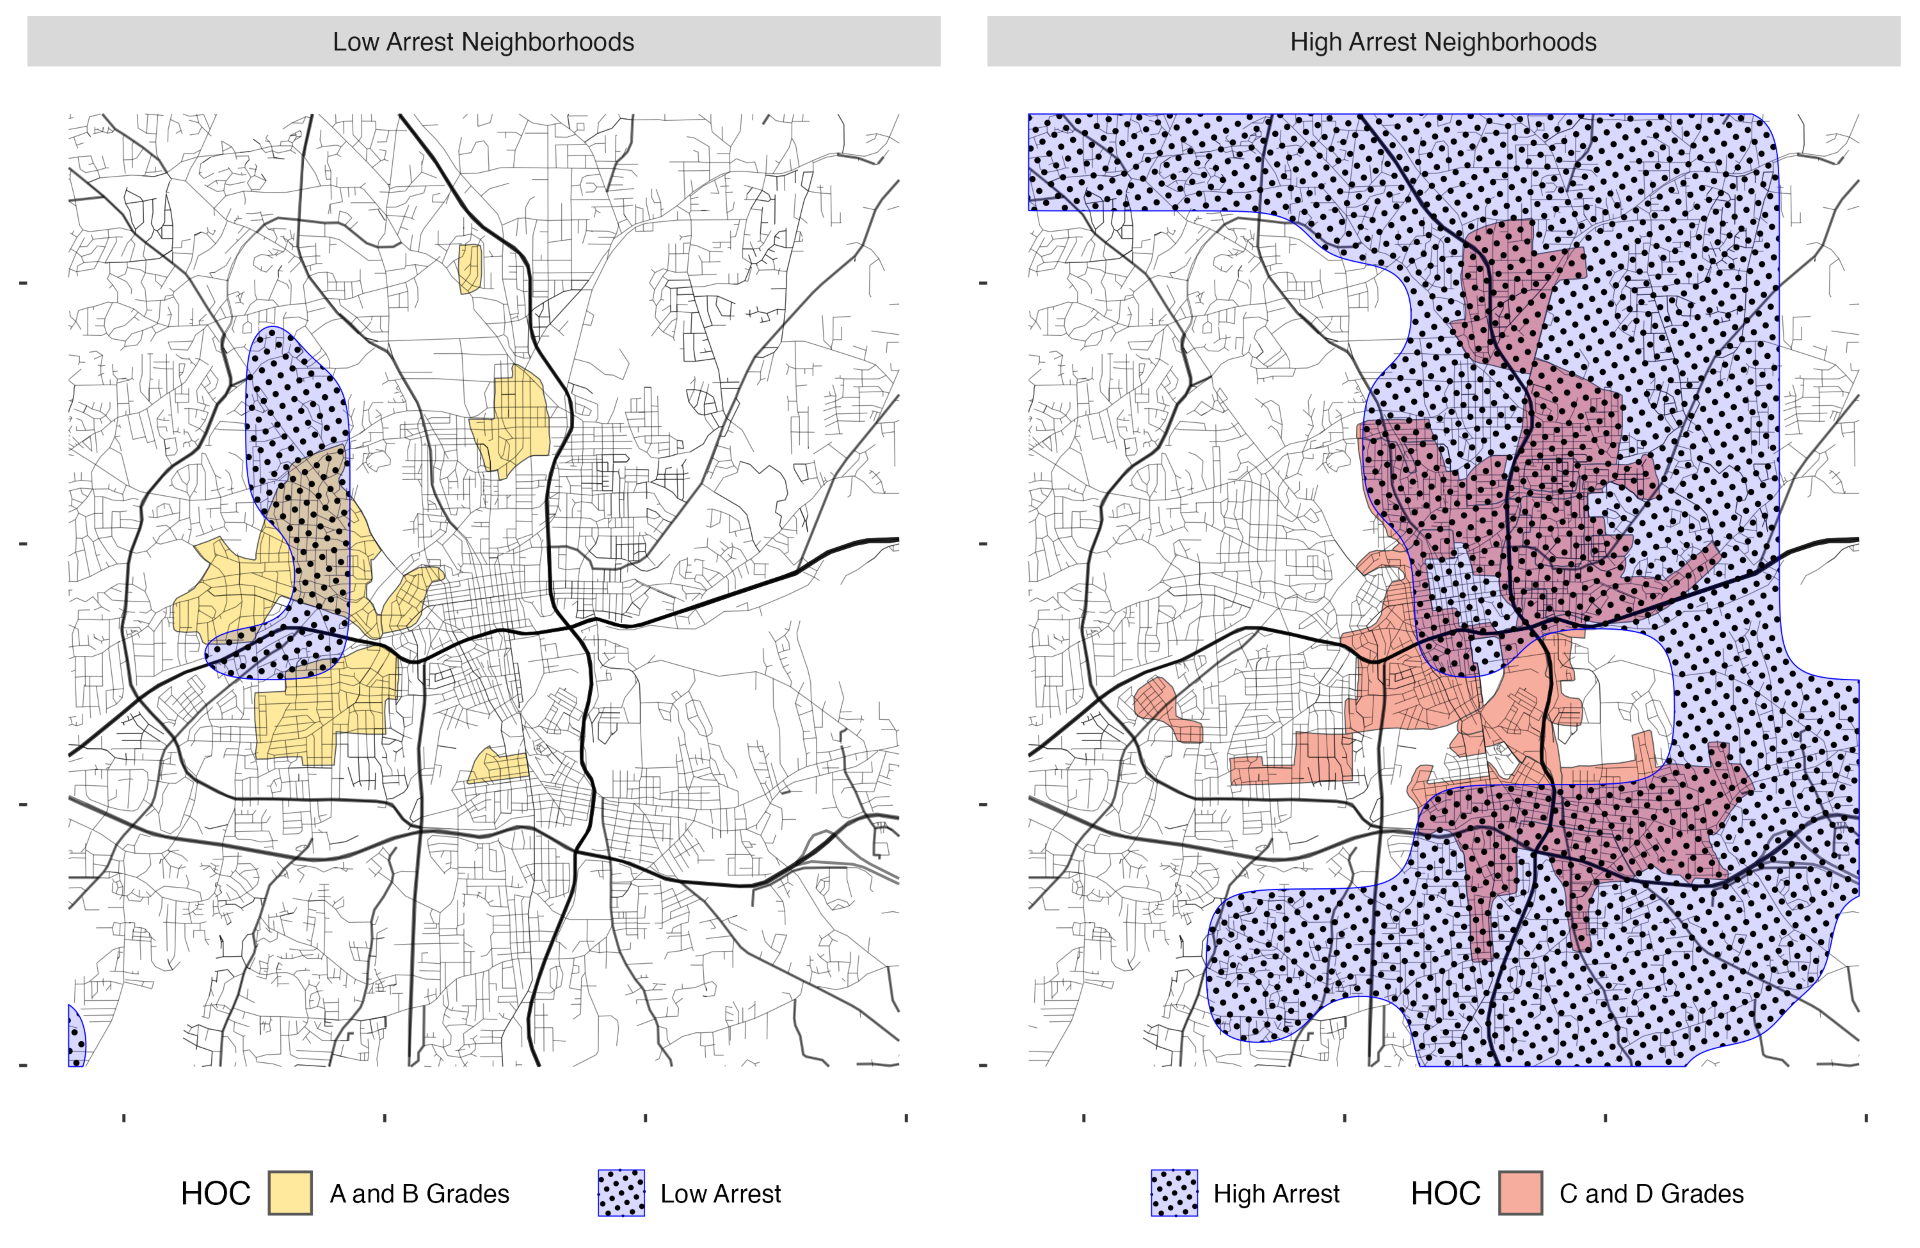
|
(This page was last updated June 30, 2026.)